Averages for the 2020 tax year for zip code 32694, filed in 2021:
Average Adjusted Gross Income (AGI) in 2020: $47,818 (Individual Income Tax Returns)
Here:
$47,818
State:
$82,200
Salary/wage: $40,209 (reported on 80.5% of returns)
Here:
$40,209
State:
$58,347
(% of AGI for various income ranges: 1125.7% for AGIs below $25k, 3353.3% for AGIs $25k-50k, 6462.9% for AGIs $50k-75k, 8305.0% for AGIs $75k-100k, 20212.0% for AGIs $100k-200k)
Taxable interest for individuals: $428 (reported on 20.7% of returns)
This zip code:
$428
Florida:
$4,272
(% of AGI for various income ranges: 9.6% for AGIs below $25k, 10.5% for AGIs $25k-50k, 15.7% for AGIs $50k-75k, 34.0% for AGIs $100k-200k)
Ordinary dividends: $3,625 (reported on 9.2% of returns)
Here:
$3,625
State:
$15,863
(% of AGI for various income ranges: 4.6% for AGIs below $25k, 27.1% for AGIs $25k-50k, 440.0% for AGIs $100k-200k)
Net capital gain/loss in AGI: +$7,962 (reported on 9.2% of returns)
Here:
+$7,962
State:
+$62,983
(% of AGI for various income ranges: 3.2% for AGIs below $25k, 49.5% for AGIs $25k-50k, 1048.0% for AGIs $100k-200k)
Profit/loss from business: +$4,515 (reported on 14.9% of returns)
Here:
+$4,515
State:
+$9,719
(% of AGI for various income ranges: 116.4% for AGIs below $25k, 15.2% for AGIs $25k-50k, 327.1% for AGIs $50k-75k)
Taxable individual retirement arrangement distribution: $18,320 (reported on 5.7% of returns)
32694:
$18,320
Florida:
$24,823
(% of AGI for various income ranges: 77.1% for AGIs below $25k, 1000.0% for AGIs $50k-75k)
Total itemized deductions: $28,450 (reported on 2.3% of returns)
Here:
$28,450
State:
$45,393
(% of AGI for various income ranges: 271.0% for AGIs $25k-50k)
Taxes paid: $6,050 (reported on 2.3% of returns)
32694:
$6,050
State:
$6,967
(% of AGI for various income ranges: 57.6% for AGIs $25k-50k)
Earned income credit: $2,343 (reported on 24.1% of returns)
Here:
$2,343
State:
$2,306
(% of AGI for various income ranges: 127.5% for AGIs below $25k, 64.3% for AGIs $25k-50k)
Percentage of individuals using paid preparers for their 2020 taxes: 90.8%
Here:
91%
State:
92%
(% for various income ranges: 91.7% for AGIs below $25k, 92.0% for AGIs $25k-50k, 90.0% for AGIs $50k-75k, 83.3% for AGIs $75k-100k, 112.5% for AGIs $100k-200k, 0.0% for AGIs over 200k)
Averages for the 2012 tax year for zip code 32694, filed in 2013:
Average Adjusted Gross Income (AGI) in 2012: $42,715 (Individual Income Tax Returns)
Here:
$42,715
State:
$60,316
Salary/wage: $34,040 (reported on 82.7% of returns)
Here:
$34,040
State:
$45,277
(% of AGI for various income ranges: 72.0% for AGIs below $25k, 77.0% for AGIs $25k-50k, 77.1% for AGIs $50k-75k, 81.7% for AGIs $75k-100k, 41.6% for AGIs $100k-200k)
Taxable interest for individuals: $560 (reported on 20.0% of returns)
This zip code:
$560
Florida:
$3,587
(% of AGI for various income ranges: 0.4% for AGIs below $25k, 0.2% for AGIs $25k-50k, 0.2% for AGIs $50k-75k, 0.4% for AGIs $100k-200k)
Ordinary dividends: $7,233 (reported on 8.0% of returns)
Here:
$7,233
State:
$12,831
Net capital gain/loss in AGI: +$450 (reported on 5.3% of returns)
Here:
+$450
State:
+$33,493
Profit/loss from business: +$4,675 (reported on 10.7% of returns)
Here:
+$4,675
State:
+$10,012
Taxable individual retirement arrangement distribution: $8,340 (reported on 6.7% of returns)
32694:
$8,340
Florida:
$21,544
Total itemized deductions: $18,973 (24% of AGI, reported on 14.7% of returns)
Here:
$18,973
State:
$25,533
Here:
23.8% of AGI
State:
18.0% of AGI
(% of AGI for various income ranges: 7.8% for AGIs $25k-50k, 15.0% for AGIs $50k-75k, 6.9% for AGIs $100k-200k)
Charity contributions: $3,856 (reported on 12.0% of returns)
Here:
$3,856
State:
$5,698
(% of AGI for various income ranges: 1.9% for AGIs below $25k, 2.4% for AGIs $50k-75k, 1.3% for AGIs $100k-200k)
Taxes paid: $4,191 (reported on 14.7% of returns)
32694:
$4,191
State:
$6,203
(% of AGI for various income ranges: 1.1% for AGIs $25k-50k, 2.9% for AGIs $50k-75k, 2.2% for AGIs $100k-200k)
Earned income credit: $2,438 (reported on 28.0% of returns)
Here:
$2,438
State:
$2,372
(% of AGI for various income ranges: 8.9% for AGIs below $25k, 1.4% for AGIs $25k-50k)
Percentage of individuals using paid preparers for their 2012 taxes: 41.3%
Here:
41%
State:
54%
(% for various income ranges: 40.0% for AGIs below $25k, 38.1% for AGIs $25k-50k, 44.4% for AGIs $50k-75k, 40.0% for AGIs $75k-100k, 60.0% for AGIs $100k-200k)
Averages for the 2004 tax year for zip code 32694, filed in 2005:
Average Adjusted Gross Income (AGI) in 2004: $32,109 (Individual Income Tax Returns)
Here:
$32,109
State:
$50,523
Salary/wage: $29,082 (reported on 84.4% of returns)
Here:
$29,082
State:
$39,563
(% of AGI for various income ranges: 83.6% for AGIs below $10k, 80.3% for AGIs $10k-25k, 84.0% for AGIs $25k-50k, 86.5% for AGIs $50k-75k, 76.3% for AGIs $75k-100k, 46.7% for AGIs over 100k)
Taxable interest for individuals: $727 (reported on 24.1% of returns)
This zip code:
$727
Florida:
$3,211
(% of AGI for various income ranges: 4.7% for AGIs below $10k, 0.6% for AGIs $10k-25k, 0.4% for AGIs $25k-50k, 0.1% for AGIs $50k-75k, 0.2% for AGIs $75k-100k, 0.7% for AGIs over 100k)
Taxable dividends: $1,457 (reported on 11.1% of returns)
Here:
$1,457
State:
$6,129
(% of AGI for various income ranges: 3.5% for AGIs below $10k, 0.4% for AGIs $10k-25k, 0.3% for AGIs $25k-50k, 0.3% for AGIs $50k-75k, 1.0% for AGIs over 100k)
Net capital gain/loss: +$4,814 (reported on 8.2% of returns)
Here:
+$4,814
State:
+$27,205
(% of AGI for various income ranges: 0.3% for AGIs $10k-25k, 0.6% for AGIs $25k-50k, 4.4% for AGIs $75k-100k, 3.1% for AGIs over 100k)
Profit/loss from business: +$5,593 (reported on 13.3% of returns)
Here:
+$5,593
State:
+$10,634
(% of AGI for various income ranges: 12.3% for AGIs below $10k, 6.3% for AGIs $10k-25k, 2.4% for AGIs $25k-50k, 0.2% for AGIs $50k-75k)
IRA payment deduction: $2,700 (reported on 1.2% of returns)
32694:
$2,700
Florida:
$3,082
Total itemized deductions: $14,320 (25% of AGI, reported on 14.7% of returns)
Here:
$14,320
State:
$20,370
Here:
25.2% of AGI
State:
20.7% of AGI
(% of AGI for various income ranges: 5.5% for AGIs $10k-25k, 6.3% for AGIs $25k-50k, 7.1% for AGIs $50k-75k, 14.4% for AGIs $75k-100k, 4.4% for AGIs over 100k)
Charity contributions deductions: $2,703 (4% of AGI, reported on 10.7% of returns)
Here:
$2,703
State:
$4,064
Here:
4.5% of AGI
State:
3.8% of AGI
(% of AGI for various income ranges: 0.6% for AGIs $10k-25k, 0.9% for AGIs $25k-50k, 0.9% for AGIs $50k-75k, 2.2% for AGIs $75k-100k, 0.8% for AGIs over 100k)
Total tax: $4,184 (reported on 70.2% of returns)
32694:
$4,184
State:
$9,431
(% of AGI for various income ranges: 3.3% for AGIs below $10k, 4.1% for AGIs $10k-25k, 6.5% for AGIs $25k-50k, 8.9% for AGIs $50k-75k, 9.6% for AGIs $75k-100k, 20.1% for AGIs over 100k)
Earned income credit: $2,000 (reported on 24.9% of returns)
Here:
$2,000
State:
$1,808
Percentage of individuals using paid preparers for their 2004 taxes: 51.3%
Here:
51%
State:
60%
(% for various income ranges: 47.8% for AGIs below $10k, 52.4% for AGIs $10k-25k, 50.2% for AGIs $25k-50k, 58.1% for AGIs $50k-75k, 46.9% for AGIs $75k-100k, 56.5% for AGIs over 100k)
Household received Food Stamps/SNAP in the past 12 months: 145 Household did not receive Food Stamps/SNAP in the past 12 months: 978
Women who had a birth in the past 12 months: 2 (2 now married, 0 unmarried) Women who did not have a birth in the past 12 months: 254 (55 now married, 199 unmarried)
Housing units in zip code 32694 with a mortgage: 248 (22 second mortgage) Median monthly owner costs for units with a mortgage: $976 Median monthly owner costs for units without a mortgage: $349
Residents with income below the poverty level in 2022:
This zip code:
16.2%
Whole state:
12.7%
Residents with income below 50% of the poverty level in 2022:
This zip code:
7.7%
Whole state:
6.6%
Median number of rooms in houses and condos:
Here:
6.4
State:
5.9
Median number of rooms in apartments:
Here:
4.6
State:
4.2
Notable locations in this zip code not listed on our city pages
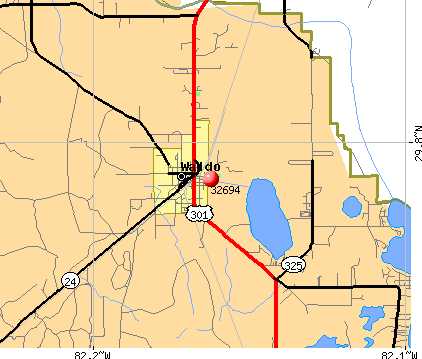
Notable locations in zip code 32694: Waldo Amtrak Station (A), Waldo Community Center (B), Waldo Police Department (C), Waldo Police Department Meeting Hall (D), Waldo Fire and Rescue Station 23 (E), Waldo Branch Library (F). Display/hide their locations on the map
Churches in zip code 32694 include: First Baptist Church of Waldo (A), Waldo First United Methodist Church (B), Lighthouse Global Ministries (C), Free Canaan United Methodist Church (D), Philadelphia Baptist Church (E). Display/hide their locations on the map
Size of family households: 231 2-persons, 86 3-persons, 76 4-persons, 30 5-persons
Size of nonfamily households: 601 1-person, 65 2-persons, 28 3-persons
133 married couples with children.
157 single-parent households (124 men, 33 women).
88.1% of residents of 32694 zip code speak English at home.
6.5% of residents speak Spanish at home (51% very well, 9% not well, 40% not at all).
3.6% of residents speak other Indo-European language at home (51% very well, 49% well).
0.7% of residents speak Asian or Pacific Island language at home (100% well).
1.5% of residents speak other language at home (100% well).
Foreign born population: 127 (6.2%) (52.3% of them are naturalized citizens)
This zip code:
6.2%
Whole state:
21.7%
32%Barbados
28%Grenada
17%Honduras
11%Japan
6%Sweden
6%United Kingdom, excluding England and Scotland
29%English
24%Irish
7%German
4%American
3%Haitian
3%Polish
1%Scottish
Year of entry for the foreign-born population
02010 or later
112000 to 2009
281990 to 1999
88Before 1990
Facilities with environmental interests located in this zip code:
MINI WAREHOUSE ( in WALDO, FL)
National Pollutant Discharge Elimination System NON-MAJOR (Tracking pollutant discharge elimination systems) - permit Organizations: RHONDA HICKSON (CONTACT/OWNER)
CSX TRANSPORTATION (HIGHWAY 301 AND RAILROAD in WALDO, FL)
Small Quantity Generators, between 100 kg and 1000 kg of hazardous waste/month (Resource Conservation and Recovery Act (tracking hazardous waste)) - notification Organizations: C E HICKS, DIR ENV OP (CONTACT/OWNER)
Housing units lacking complete plumbing facilities: 4.8% Housing units lacking complete kitchen facilities: 3.9%
98.2%Electricity
1.8%Bottled, tank, or LP gas
Population in 1990: 1,676. Population change in the 1990s: +265 (+15.8%).
Place of birth for U.S.-born residents:
This state: 1,182
Northeast: 115
Midwest: 276
South: 289
West: 24
62% of the 32694 zip code residents lived in the same house 5 years ago. Out of people who lived in different houses, 57% lived in this county. Out of people who lived in different counties, 50% lived in Florida.
87% of the 32694 zip code residents lived in the same house 1 year ago. Out of people who lived in different houses, 40% moved from this county. Out of people who lived in different houses, 26% moved from different county within same state. Out of people who lived in different houses, 33% moved from different state.
Private vs. public school enrollment:
Students in private schools in grades 1 to 8 (elementary and middle school): 36
Here:
21.2%
Florida:
15.8%
Students in private schools in grades 9 to 12 (high school):
Here:
0.0%
Florida:
12.9%
Students in private undergraduate colleges:
Here:
0.0%
Florida:
23.6%
Occupation by median earnings in the past 12 months ($)
96,061Material moving occupations
87,517Management occupations
63,373Building and grounds cleaning and maintenance occupations
61,324Computer and mathematical occupations
41,216Installation, maintenance, and repair occupations
34,671Sales and related occupations
Top industries in this zip code by the number of employees in 2005:
Real Estate and Rental and Leasing: Lessors of Nonresidential Buildings (except Miniwarehouses) (20-49 employees: 1 establishment)
Construction: All Other Specialty Trade Contractors (10-19: 1, 1-4: 1)
Accommodation and Food Services: Limited-Service Restaurants (10-19: 1)
Accommodation and Food Services: Full-Service Restaurants (10-19: 1)
Other Services (except Public Administration): Religious Organizations (5-9: 1, 1-4: 1)
Health Care and Social Assistance: Child Day Care Services (5-9: 1)
Construction: Framing Contractors (5-9: 1)
People in group quarters in 2010:
2 people in nursing facilities/skilled-nursing facilities
Fatal accident statistics in 2013:
Fatal accident count: 2
Vehicles involved in fatal accidents: 3
Fatal accidents caused by drunken drivers: 0
Fatalities: 3
Persons involved in fatal accidents: 7
Pedestrians involved in fatal accidents: 0
Home Mortgage Disclosure Act Aggregated Statistics For Year 2009 (Based on 2 partial tracts)
A) FHA, FSA/RHS & VA Home Purchase Loans
B) Conventional Home Purchase Loans
C) Refinancings
D) Home Improvement Loans
F) Non-occupant Loans on < 5 Family Dwellings (A B C & D)
G) Loans On Manufactured Home Dwelling (A B C & D)
Number
Average Value
Number
Average Value
Number
Average Value
Number
Average Value
Number
Average Value
Number
Average Value
LOANS ORIGINATED
12
$122,547
4
$110,762
29
$169,731
2
$102,885
1
$159,800
13
$94,127
APPLICATIONS APPROVED, NOT ACCEPTED
0
$0
0
$0
4
$175,120
1
$34,150
0
$0
2
$57,135
APPLICATIONS DENIED
5
$116,192
5
$87,472
16
$128,631
5
$64,620
1
$102,450
9
$75,350
APPLICATIONS WITHDRAWN
2
$89,310
2
$150,385
12
$134,806
0
$0
0
$0
6
$71,872
FILES CLOSED FOR INCOMPLETENESS
0
$0
0
$0
3
$107,117
0
$0
0
$0
1
$76,620
Aggregated Statistics For Year 2008 (Based on 2 partial tracts)
A) FHA, FSA/RHS & VA Home Purchase Loans
B) Conventional Home Purchase Loans
C) Refinancings
D) Home Improvement Loans
F) Non-occupant Loans on < 5 Family Dwellings (A B C & D)
G) Loans On Manufactured Home Dwelling (A B C & D)
Number
Average Value
Number
Average Value
Number
Average Value
Number
Average Value
Number
Average Value
Number
Average Value
LOANS ORIGINATED
9
$124,724
16
$161,302
32
$121,298
3
$110,617
3
$204,743
25
$90,397
APPLICATIONS APPROVED, NOT ACCEPTED
0
$0
5
$65,932
5
$88,610
1
$42,030
1
$96,320
7
$63,543
APPLICATIONS DENIED
3
$105,803
7
$96,879
26
$115,242
8
$43,890
0
$0
18
$69,853
APPLICATIONS WITHDRAWN
1
$138,340
2
$135,060
7
$143,536
0
$0
0
$0
4
$75,740
FILES CLOSED FOR INCOMPLETENESS
0
$0
0
$0
1
$97,630
0
$0
0
$0
0
$0
Aggregated Statistics For Year 2007 (Based on 2 partial tracts)
A) FHA, FSA/RHS & VA Home Purchase Loans
B) Conventional Home Purchase Loans
C) Refinancings
D) Home Improvement Loans
F) Non-occupant Loans on < 5 Family Dwellings (A B C & D)
G) Loans On Manufactured Home Dwelling (A B C & D)
Number
Average Value
Number
Average Value
Number
Average Value
Number
Average Value
Number
Average Value
Number
Average Value
LOANS ORIGINATED
5
$113,128
25
$194,891
49
$150,836
10
$69,785
7
$245,043
24
$91,500
APPLICATIONS APPROVED, NOT ACCEPTED
0
$0
5
$128,888
14
$117,612
2
$47,500
1
$62,610
6
$78,075
APPLICATIONS DENIED
2
$73,770
10
$124,773
48
$132,389
11
$65,750
3
$42,467
21
$83,057
APPLICATIONS WITHDRAWN
2
$176,215
0
$0
18
$148,317
3
$97,920
0
$0
5
$100,168
FILES CLOSED FOR INCOMPLETENESS
0
$0
1
$43,340
4
$114,595
2
$139,440
1
$59,980
1
$77,490
Aggregated Statistics For Year 2006 (Based on 2 partial tracts)
A) FHA, FSA/RHS & VA Home Purchase Loans
B) Conventional Home Purchase Loans
C) Refinancings
D) Home Improvement Loans
F) Non-occupant Loans on < 5 Family Dwellings (A B C & D)
G) Loans On Manufactured Home Dwelling (A B C & D)
Number
Average Value
Number
Average Value
Number
Average Value
Number
Average Value
Number
Average Value
Number
Average Value
LOANS ORIGINATED
10
$97,629
36
$122,256
43
$138,589
10
$66,983
9
$103,467
33
$80,568
APPLICATIONS APPROVED, NOT ACCEPTED
0
$0
7
$102,570
13
$99,919
2
$30,425
1
$115,140
6
$74,863
APPLICATIONS DENIED
2
$115,140
15
$103,496
45
$129,638
12
$72,456
3
$91,210
22
$75,620
APPLICATIONS WITHDRAWN
1
$121,270
7
$173,244
25
$117,190
5
$90,974
1
$86,250
7
$87,560
FILES CLOSED FOR INCOMPLETENESS
0
$0
2
$103,760
6
$132,800
0
$0
0
$0
1
$81,430
Aggregated Statistics For Year 2005 (Based on 2 partial tracts)
A) FHA, FSA/RHS & VA Home Purchase Loans
B) Conventional Home Purchase Loans
C) Refinancings
D) Home Improvement Loans
F) Non-occupant Loans on < 5 Family Dwellings (A B C & D)
G) Loans On Manufactured Home Dwelling (A B C & D)
Number
Average Value
Number
Average Value
Number
Average Value
Number
Average Value
Number
Average Value
Number
Average Value
LOANS ORIGINATED
10
$91,413
42
$140,972
48
$115,497
7
$85,371
8
$131,669
22
$80,316
APPLICATIONS APPROVED, NOT ACCEPTED
1
$55,160
8
$106,550
12
$93,726
1
$25,390
0
$0
8
$73,112
APPLICATIONS DENIED
2
$124,990
16
$86,575
62
$111,695
11
$54,526
2
$107,700
29
$77,053
APPLICATIONS WITHDRAWN
0
$0
10
$156,382
36
$129,917
4
$56,585
1
$78,370
7
$79,367
FILES CLOSED FOR INCOMPLETENESS
0
$0
1
$95,000
7
$146,100
1
$26,270
0
$0
3
$65,087
Aggregated Statistics For Year 2004 (Based on 2 partial tracts)
A) FHA, FSA/RHS & VA Home Purchase Loans
B) Conventional Home Purchase Loans
C) Refinancings
D) Home Improvement Loans
F) Non-occupant Loans on < 5 Family Dwellings (A B C & D)
G) Loans On Manufactured Home Dwelling (A B C & D)
Number
Average Value
Number
Average Value
Number
Average Value
Number
Average Value
Number
Average Value
Number
Average Value
LOANS ORIGINATED
11
$92,336
33
$106,704
47
$93,550
11
$46,925
7
$111,451
24
$64,284
APPLICATIONS APPROVED, NOT ACCEPTED
0
$0
9
$97,143
16
$92,622
2
$11,165
1
$127,400
10
$60,767
APPLICATIONS DENIED
2
$89,530
12
$91,062
58
$94,655
9
$39,791
4
$63,372
22
$66,645
APPLICATIONS WITHDRAWN
2
$79,240
34
$162,604
19
$105,694
3
$48,743
4
$111,420
6
$69,683
FILES CLOSED FOR INCOMPLETENESS
0
$0
0
$0
2
$47,940
1
$39,840
0
$0
0
$0
Aggregated Statistics For Year 2003 (Based on 2 partial tracts)
A) FHA, FSA/RHS & VA Home Purchase Loans
B) Conventional Home Purchase Loans
C) Refinancings
D) Home Improvement Loans
F) Non-occupant Loans on < 5 Family Dwellings (A B C & D)
Number
Average Value
Number
Average Value
Number
Average Value
Number
Average Value
Number
Average Value
LOANS ORIGINATED
4
$102,882
32
$96,220
86
$92,905
6
$40,350
7
$105,384
APPLICATIONS APPROVED, NOT ACCEPTED
0
$0
4
$63,700
14
$95,941
1
$19,700
0
$0
APPLICATIONS DENIED
2
$116,015
11
$85,411
49
$89,436
4
$16,745
1
$33,270
APPLICATIONS WITHDRAWN
3
$83,037
5
$94,478
26
$93,150
0
$0
1
$123,900
FILES CLOSED FOR INCOMPLETENESS
0
$0
2
$79,240
7
$99,881
0
$0
0
$0
Aggregated Statistics For Year 2002 (Based on 2 partial tracts)
A) FHA, FSA/RHS & VA Home Purchase Loans
B) Conventional Home Purchase Loans
C) Refinancings
D) Home Improvement Loans
F) Non-occupant Loans on < 5 Family Dwellings (A B C & D)
Number
Average Value
Number
Average Value
Number
Average Value
Number
Average Value
Number
Average Value
LOANS ORIGINATED
4
$90,735
22
$98,525
54
$77,953
3
$31,520
5
$80,994
APPLICATIONS APPROVED, NOT ACCEPTED
0
$0
9
$58,957
14
$66,671
0
$0
0
$0
APPLICATIONS DENIED
2
$87,340
18
$63,578
43
$74,518
5
$13,484
4
$78,585
APPLICATIONS WITHDRAWN
1
$63,040
3
$78,950
19
$70,094
0
$0
1
$56,040
FILES CLOSED FOR INCOMPLETENESS
0
$0
1
$172,930
6
$72,310
0
$0
0
$0
Aggregated Statistics For Year 2001 (Based on 2 partial tracts)
A) FHA, FSA/RHS & VA Home Purchase Loans
B) Conventional Home Purchase Loans
C) Refinancings
D) Home Improvement Loans
F) Non-occupant Loans on < 5 Family Dwellings (A B C & D)
Number
Average Value
Number
Average Value
Number
Average Value
Number
Average Value
Number
Average Value
LOANS ORIGINATED
7
$80,493
37
$68,060
41
$84,154
7
$31,021
4
$91,282
APPLICATIONS APPROVED, NOT ACCEPTED
1
$104,630
9
$49,861
9
$64,211
1
$35,460
0
$0
APPLICATIONS DENIED
2
$81,870
24
$51,113
50
$68,673
4
$13,900
1
$21,890
APPLICATIONS WITHDRAWN
1
$128,280
2
$60,635
20
$75,718
2
$19,265
1
$105,950
FILES CLOSED FOR INCOMPLETENESS
0
$0
0
$0
2
$77,490
0
$0
0
$0
Aggregated Statistics For Year 2000 (Based on 2 partial tracts)
A) FHA, FSA/RHS & VA Home Purchase Loans
B) Conventional Home Purchase Loans
C) Refinancings
D) Home Improvement Loans
F) Non-occupant Loans on < 5 Family Dwellings (A B C & D)
Number
Average Value
Number
Average Value
Number
Average Value
Number
Average Value
Number
Average Value
LOANS ORIGINATED
4
$62,935
47
$70,961
17
$64,588
4
$16,638
6
$65,160
APPLICATIONS APPROVED, NOT ACCEPTED
0
$0
14
$63,794
7
$70,736
5
$11,296
1
$21,890
APPLICATIONS DENIED
0
$0
35
$50,997
38
$50,301
5
$14,798
2
$15,980
APPLICATIONS WITHDRAWN
0
$0
6
$62,897
14
$61,949
1
$70,920
0
$0
FILES CLOSED FOR INCOMPLETENESS
0
$0
1
$77,490
7
$67,296
0
$0
0
$0
Aggregated Statistics For Year 1999 (Based on 1 partial tract)
A) FHA, FSA/RHS & VA Home Purchase Loans
B) Conventional Home Purchase Loans
C) Refinancings
D) Home Improvement Loans
F) Non-occupant Loans on < 5 Family Dwellings (A B C & D)
Detailed PMIC statistics for the following Tracts:0019.01
2002 - 2018 National Fire Incident Reporting System (NFIRS) incidents
Based on the data from the years 2002 - 2018 the average number of fire incidents per year is 25. The highest number of fires - 50 took place in 2011, and the least - 5 in 2009. The data has a declining trend.
When looking into fire subcategories, the most reports belonged to: Outside Fires (59.2%), and Structure Fires (18.4%).
Fire incident types reported to NFIRS in Zip Code 32694

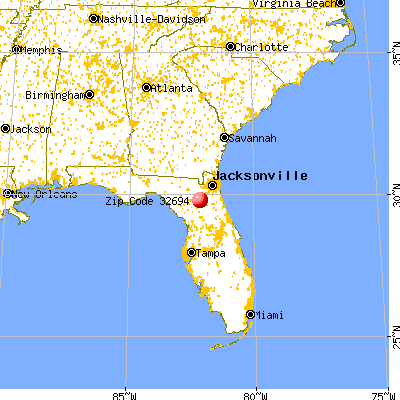


 Nearest zip codes: 32044, 32631, 32091, 32609, 32666, 32656.


 Based on the data from the years 2002 - 2018 the average number of fire incidents per year is 25. The highest number of fires - 50 took place in 2011, and the least - 5 in 2009. The data has a declining trend.
 When looking into fire subcategories, the most reports belonged to: Outside Fires (59.2%), and Structure Fires (18.4%).