Houses and condos: 2,029 Renter-occupied apartments: 404
% of renters here:
19%
State:
33%
March 2022 cost of living index in zip code 33194: 94.0 (less than average, U.S. average is 100)
Land area: 88.7 sq. mi. Water area: 2.6 sq. mi.
Population density: 100 people per square mile
(very low).
OSM Map
General Map
Google Map
MSN Map
OSM Map
General Map
Google Map
MSN Map
OSM Map
General Map
Google Map
MSN Map
OSM Map
General Map
Google Map
MSN Map
Please wait while loading the map...
Real estate property taxes paid for housing units in 2022:
This zip code:
1.1% ($5,601)
Florida:
0.7% ($2,529)
Median real estate property taxes paid for housing units with mortgages in 2022: $6,019 (1.1%) Median real estate property taxes paid for housing units with no mortgage in 2022: $4,910 (0.9%)
Estimated median house/condo value in 2022: $532,604
33194:
$532,604
Florida:
$354,100
According to our research of Florida and other state lists, there were 9 registered sex offenders living in 33194 zip code as of May 29, 2024. The ratio of all residents to sex offenders in zip code 33194 is 827 to 1. The ratio of registered sex offenders to all residents in this zip code is lower than the state average.
Median resident age:
This zip code:
43.4 years
Florida median age:
42.7 years
Average household size:
This zip code:
3.4 people
Florida:
2.5 people
Averages for the 2020 tax year for zip code 33194, filed in 2021:
Average Adjusted Gross Income (AGI) in 2020: $50,545 (Individual Income Tax Returns)
Here:
$50,545
State:
$82,200
Salary/wage: $58,916 (reported on 70.5% of returns)
Here:
$58,916
State:
$58,347
(% of AGI for various income ranges: 1084.9% for AGIs below $25k, 3749.3% for AGIs $25k-50k, 7350.0% for AGIs $50k-75k, 10221.1% for AGIs $75k-100k, 20035.0% for AGIs $100k-200k, 55958.0% for AGIs over 200k)
Taxable interest for individuals: $308 (reported on 26.9% of returns)
This zip code:
$308
Florida:
$4,272
(% of AGI for various income ranges: 4.2% for AGIs below $25k, 5.4% for AGIs $25k-50k, 8.6% for AGIs $50k-75k, 21.6% for AGIs $75k-100k, 31.2% for AGIs $100k-200k, 172.0% for AGIs over 200k)
Ordinary dividends: $1,260 (reported on 7.1% of returns)
Here:
$1,260
State:
$15,863
(% of AGI for various income ranges: 2.6% for AGIs below $25k, 2.8% for AGIs $25k-50k, 18.3% for AGIs $50k-75k, 8.9% for AGIs $75k-100k, 21.2% for AGIs $100k-200k, 312.0% for AGIs over 200k)
Net capital gain/loss in AGI: +$5,191 (reported on 9.6% of returns)
Here:
+$5,191
State:
+$62,983
(% of AGI for various income ranges: 5.2% for AGIs below $25k, 22.2% for AGIs $25k-50k, 33.1% for AGIs $50k-75k, 21.1% for AGIs $75k-100k, 235.8% for AGIs $100k-200k, 1794.0% for AGIs over 200k)
Profit/loss from business: +$6,099 (reported on 31.4% of returns)
Here:
+$6,099
State:
+$9,719
(% of AGI for various income ranges: 350.1% for AGIs below $25k, 255.7% for AGIs $25k-50k, 167.2% for AGIs $50k-75k, 389.5% for AGIs $75k-100k, 447.5% for AGIs $100k-200k)
Taxable individual retirement arrangement distribution: $17,280 (reported on 1.4% of returns)
33194:
$17,280
Florida:
$24,823
(% of AGI for various income ranges: 27.9% for AGIs below $25k, 256.7% for AGIs $100k-200k)
Total itemized deductions: $27,851 (reported on 9.9% of returns)
Here:
$27,851
State:
$45,393
(% of AGI for various income ranges: 54.9% for AGIs below $25k, 188.7% for AGIs $25k-50k, 657.6% for AGIs $50k-75k, 798.4% for AGIs $75k-100k, 1284.2% for AGIs $100k-200k, 3468.0% for AGIs over 200k)
Charity contributions: $5,307 (reported on 7.6% of returns)
Here:
$5,307
State:
$20,178
(% of AGI for various income ranges: 25.4% for AGIs $25k-50k, 99.0% for AGIs $50k-75k, 90.0% for AGIs $75k-100k, 177.1% for AGIs $100k-200k, 826.0% for AGIs over 200k)
Taxes paid: $7,897 (reported on 9.9% of returns)
33194:
$7,897
State:
$6,967
(% of AGI for various income ranges: 16.2% for AGIs below $25k, 58.0% for AGIs $25k-50k, 195.2% for AGIs $50k-75k, 223.7% for AGIs $75k-100k, 372.9% for AGIs $100k-200k, 842.0% for AGIs over 200k)
Earned income credit: $2,134 (reported on 19.3% of returns)
Here:
$2,134
State:
$2,306
(% of AGI for various income ranges: 114.0% for AGIs below $25k, 80.7% for AGIs $25k-50k)
Percentage of individuals using paid preparers for their 2020 taxes: 77.9%
Here:
78%
State:
92%
(% for various income ranges: 62.0% for AGIs below $25k, 92.6% for AGIs $25k-50k, 92.5% for AGIs $50k-75k, 88.5% for AGIs $75k-100k, 92.7% for AGIs $100k-200k, 91.7% for AGIs over 200k)
Averages for the 2012 tax year for zip code 33194, filed in 2013:
Average Adjusted Gross Income (AGI) in 2012: $48,036 (Individual Income Tax Returns)
Here:
$48,036
State:
$60,316
Salary/wage: $48,431 (reported on 82.1% of returns)
Here:
$48,431
State:
$45,277
(% of AGI for various income ranges: 70.6% for AGIs below $25k, 85.5% for AGIs $25k-50k, 89.4% for AGIs $50k-75k, 93.6% for AGIs $75k-100k, 85.6% for AGIs $100k-200k, 63.9% for AGIs over 200k)
Taxable interest for individuals: $576 (reported on 16.8% of returns)
This zip code:
$576
Florida:
$3,587
(% of AGI for various income ranges: 0.3% for AGIs below $25k, 0.2% for AGIs $25k-50k, 0.2% for AGIs $50k-75k, 0.1% for AGIs $75k-100k, 0.2% for AGIs $100k-200k, 0.3% for AGIs over 200k)
Ordinary dividends: $1,864 (reported on 5.1% of returns)
Here:
$1,864
State:
$12,831
(% of AGI for various income ranges: 0.5% for AGIs $25k-50k, 0.2% for AGIs $50k-75k, 0.3% for AGIs $100k-200k)
Net capital gain/loss in AGI: +$3,169 (reported on 4.8% of returns)
Here:
+$3,169
State:
+$33,493
(% of AGI for various income ranges: 1.3% for AGIs $100k-200k)
Profit/loss from business: +$8,411 (reported on 31.1% of returns)
Here:
+$8,411
State:
+$10,012
(% of AGI for various income ranges: 26.7% for AGIs below $25k, 6.5% for AGIs $25k-50k, 3.5% for AGIs $50k-75k, 2.6% for AGIs $100k-200k)
Taxable individual retirement arrangement distribution: $8,860 (reported on 1.8% of returns)
33194:
$8,860
Florida:
$21,544
Total itemized deductions: $21,395 (25% of AGI, reported on 34.4% of returns)
Here:
$21,395
State:
$25,533
Here:
24.7% of AGI
State:
18.0% of AGI
(% of AGI for various income ranges: 7.7% for AGIs below $25k, 17.7% for AGIs $25k-50k, 20.8% for AGIs $50k-75k, 16.8% for AGIs $75k-100k, 14.1% for AGIs $100k-200k, 13.4% for AGIs over 200k)
Charity contributions: $2,042 (reported on 26.0% of returns)
Here:
$2,042
State:
$5,698
(% of AGI for various income ranges: 0.2% for AGIs below $25k, 1.1% for AGIs $25k-50k, 1.7% for AGIs $50k-75k, 1.2% for AGIs $75k-100k, 1.1% for AGIs $100k-200k, 1.1% for AGIs over 200k)
Taxes paid: $4,699 (reported on 33.7% of returns)
33194:
$4,699
State:
$6,203
(% of AGI for various income ranges: 1.4% for AGIs below $25k, 3.6% for AGIs $25k-50k, 4.4% for AGIs $50k-75k, 3.8% for AGIs $75k-100k, 3.5% for AGIs $100k-200k, 2.4% for AGIs over 200k)
Earned income credit: $2,323 (reported on 27.5% of returns)
Here:
$2,323
State:
$2,372
(% of AGI for various income ranges: 9.9% for AGIs below $25k, 1.1% for AGIs $25k-50k)
Percentage of individuals using paid preparers for their 2012 taxes: 69.6%
Here:
70%
State:
54%
(% for various income ranges: 65.9% for AGIs below $25k, 70.0% for AGIs $25k-50k, 75.8% for AGIs $50k-75k, 69.6% for AGIs $75k-100k, 75.0% for AGIs $100k-200k, 83.3% for AGIs over 200k)
Averages for the 2004 tax year for zip code 33194, filed in 2005:
Average Adjusted Gross Income (AGI) in 2004: $43,943 (Individual Income Tax Returns)
Here:
$43,943
State:
$50,523
Salary/wage: $43,000 (reported on 85.7% of returns)
Here:
$43,000
State:
$39,563
(% of AGI for various income ranges: 73.6% for AGIs below $10k, 80.8% for AGIs $10k-25k, 90.7% for AGIs $25k-50k, 90.4% for AGIs $50k-75k, 89.5% for AGIs $75k-100k, 72.7% for AGIs over 100k)
Taxable interest for individuals: $679 (reported on 31.8% of returns)
This zip code:
$679
Florida:
$3,211
(% of AGI for various income ranges: 0.7% for AGIs below $10k, 0.3% for AGIs $10k-25k, 0.3% for AGIs $25k-50k, 0.4% for AGIs $50k-75k, 0.5% for AGIs $75k-100k, 0.7% for AGIs over 100k)
Taxable dividends: $391 (reported on 6.3% of returns)
Here:
$391
State:
$6,129
(% of AGI for various income ranges: 0.0% for AGIs $10k-25k, 0.0% for AGIs $25k-50k, 0.1% for AGIs $50k-75k, 0.1% for AGIs $75k-100k, 0.1% for AGIs over 100k)
Net capital gain/loss: +$15,525 (reported on 8.7% of returns)
Here:
+$15,525
State:
+$27,205
(% of AGI for various income ranges: 0.5% for AGIs $10k-25k, 0.7% for AGIs $25k-50k, 0.4% for AGIs $50k-75k, 2.4% for AGIs $75k-100k, 8.1% for AGIs over 100k)
Profit/loss from business: +$9,260 (reported on 26.6% of returns)
Here:
+$9,260
State:
+$10,634
(% of AGI for various income ranges: 42.9% for AGIs below $10k, 16.6% for AGIs $10k-25k, 4.5% for AGIs $25k-50k, 3.0% for AGIs $50k-75k, 2.5% for AGIs $75k-100k, 3.9% for AGIs over 100k)
IRA payment deduction: $2,706 (reported on 1.9% of returns)
33194:
$2,706
Florida:
$3,082
(% of AGI for various income ranges: 0.3% for AGIs $10k-25k, 0.2% for AGIs $50k-75k, 0.1% for AGIs over 100k)
Total itemized deductions: $20,042 (30% of AGI, reported on 47.9% of returns)
Here:
$20,042
State:
$20,370
Here:
30.4% of AGI
State:
20.7% of AGI
(% of AGI for various income ranges: 14.9% for AGIs below $10k, 19.0% for AGIs $10k-25k, 28.0% for AGIs $25k-50k, 24.4% for AGIs $50k-75k, 21.0% for AGIs $75k-100k, 17.8% for AGIs over 100k)
Charity contributions deductions: $1,717 (2% of AGI, reported on 38.1% of returns)
Here:
$1,717
State:
$4,064
Here:
2.5% of AGI
State:
3.8% of AGI
(% of AGI for various income ranges: 0.9% for AGIs $10k-25k, 1.6% for AGIs $25k-50k, 1.8% for AGIs $50k-75k, 1.7% for AGIs $75k-100k, 1.4% for AGIs over 100k)
Total tax: $5,449 (reported on 75.4% of returns)
33194:
$5,449
State:
$9,431
(% of AGI for various income ranges: 7.4% for AGIs below $10k, 4.5% for AGIs $10k-25k, 5.1% for AGIs $25k-50k, 7.0% for AGIs $50k-75k, 9.6% for AGIs $75k-100k, 15.6% for AGIs over 100k)
Earned income credit: $1,908 (reported on 22.1% of returns)
Here:
$1,908
State:
$1,808
Percentage of individuals using paid preparers for their 2004 taxes: 72.1%
Here:
72%
State:
60%
(% for various income ranges: 67.0% for AGIs below $10k, 75.8% for AGIs $10k-25k, 70.4% for AGIs $25k-50k, 71.8% for AGIs $50k-75k, 74.8% for AGIs $75k-100k, 73.7% for AGIs over 100k)
Household received Food Stamps/SNAP in the past 12 months: 226 Household did not receive Food Stamps/SNAP in the past 12 months: 1,848
Women who had a birth in the past 12 months: 80 (84 now married, 0 unmarried) Women who did not have a birth in the past 12 months: 1,577 (750 now married, 827 unmarried)
Housing units in zip code 33194 with a mortgage: 1,277 (112 second mortgage, 85 both second mortgage and home equity loan) Median monthly owner costs for units with a mortgage: $2,686 Median monthly owner costs for units without a mortgage: $777
Residents with income below the poverty level in 2022:
This zip code:
4.2%
Whole state:
12.7%
Residents with income below 50% of the poverty level in 2022:
This zip code:
0.2%
Whole state:
6.6%
Median number of rooms in houses and condos:
Here:
6.6
State:
5.9
Median number of rooms in apartments:
Here:
6.0
State:
4.2
Notable locations in this zip code not listed on our city pages
Notable locations in zip code 33194: William McKinley Osceola Seminole Village (A), Krome North Service Processing Center (B), Vizcaya Metrorail Station (C), Everglades Correctional Institution (D), Miccosukee Police Station (E), South Florida Evaluation and Treatment Center (F), Miami - Dade County Fire Rescue Station 61 (G). Display/hide their locations on the map
In group quarters: 1,770 (-1 institutionalized population)
Size of family households: 494 2-persons, 346 3-persons, 395 4-persons, 262 5-persons, 180 6-persons, 39 7-or-more-persons
Size of nonfamily households: 295 1-person, 57 2-persons
1,001 married couples with children.
181 single-parent households (181 women).
20.0% of residents of 33194 zip code speak English at home.
75.9% of residents speak Spanish at home (76% very well, 11% well, 9% not well, 4% not at all).
1.4% of residents speak other Indo-European language at home (97% very well, 3% well).
1.4% of residents speak Asian or Pacific Island language at home (48% very well, 52% well).
0.2% of residents speak other language at home (100% very well).
Foreign born population: 4,268 (48.2%) (69.4% of them are naturalized citizens)
Facilities with environmental interests located in this zip code:
USDJ INS KROME SERVICE PROCESSING (18201 SW 12TH ST in MIAMI, FL)
National Pollutant Discharge Elimination System NON-MAJOR (Tracking pollutant discharge elimination systems) - permit Small Quantity Generators, between 100 kg and 1000 kg of hazardous waste/month (Resource Conservation and Recovery Act (tracking hazardous waste)) - notification Organizations: US DEPT OF JUSTICE (CONTACT/OWNER)
, NICOLAS MARTIN (CONTACT/OWNER)
Alternative names: I.C.E. KROME S.P.C.
BICE KROME SERVICE AND PROCESS (18201 SW 12TH ST in MIAMI, FL)
National Pollutant Discharge Elimination System NON-MAJOR (Tracking pollutant discharge elimination systems) - permit Organizations: JOHN BREITHAUPT (CONTACT/OWNER)
90.2%Electricity
4.4%No fuel used
2.3%Utility gas
2.3%Fuel oil, kerosene, etc.
0.6%Solar energy
Place of birth for U.S.-born residents:
This state: 3,222
Northeast: 631
Midwest: 125
South: 312
West: 154
89% of the 33194 zip code residents lived in the same house 1 year ago. Out of people who lived in different houses, 26% moved from this county. Out of people who lived in different houses, 42% moved from different county within same state. Out of people who lived in different houses, 10% moved from different state. Out of people who lived in different houses, 31% moved from abroad.
Private vs. public school enrollment:
Students in private schools in grades 1 to 8 (elementary and middle school): 74
Here:
9.8%
Florida:
15.8%
Students in private schools in grades 9 to 12 (high school): 104
Here:
28.5%
Florida:
12.9%
Students in private undergraduate colleges: 38
Here:
9.9%
Florida:
23.6%
Occupation by median earnings in the past 12 months ($)
97,103Computer and mathematical occupations
88,953Health diagnosing and treating practitioners and other technical occupations
84,754Office and administrative support occupations
70,567Management occupations
67,337Legal occupations
61,587Business and financial operations occupations
Companies with federal contracts located in this zip code:
MICCOSUKEE TRIBE OF INDIANS OF (500 SW 177TH AVE in MIAMI, FL) : $29,137 in 7 contractsfrom 2005 to 2006
Contracts for Lodging - Hotel/Motel, Lease or Rental of Facilities -- Conference Space and Facilities, Food, Oils and Fats by Air Force, Indian Affairs (Assistant Secretary) Signed by year:2000: $0; 2001: $0; 2002: $0; 2003: $0; 2004: $0; 2005: $20,963; 2006: $8,174.
Biggest contracts:
$8,174 with Air Force for Lodging - Hotel/Motel. Signed on 2006-03-16. Completion date: 2006-03-19.
$7,000 with Indian Affairs (Assistant Secretary) for Lease or Rental of Facilities -- Conference Space and Facilities. Signed on 2005-04-22. Completion date: 2005-05-13.
$5,760 with Indian Affairs (Assistant Secretary) for Food, Oils and Fats. Signed on 2005-06-09. Completion date: 2005-06-09.
$4,271 with Indian Affairs (Assistant Secretary) for Lease or Rental of Facilities -- Conference Space and Facilities. Signed on 2005-03-16. Completion date: 2005-04-09.
Top industries in this zip code by the number of employees in 2005:
Arts, Entertainment, and Recreation: Other Gambling Industries (250-499 employees: 1 establishment)
Real Estate and Rental and Leasing: Lessors of Nonresidential Buildings (except Miniwarehouses) (20-49: 1)
Construction: Electrical Contractors (20-49: 1)
Accommodation and Food Services: Full-Service Restaurants (10-19: 1)
Health Care and Social Assistance: Offices of Physicians (except Mental Health Specialists) (1-4: 2)
Administrative and Support and Waste Management and Remediation Services: Janitorial Services (1-4: 2)
Construction: New Single-Family Housing Construction (except Operative Builders) (1-4: 2)
Fatal accident statistics in 2014:
Fatal accident count: 4
Vehicles involved in fatal accidents: 9
Fatal accidents caused by drunken drivers: 1
Fatalities: 6
Persons involved in fatal accidents: 10
Pedestrians involved in fatal accidents: 0
Fatal accident statistics in 2013:
Fatal accident count: 1
Vehicles involved in fatal accidents: 1
Fatal accidents caused by drunken drivers: 1
Fatalities: 1
Persons involved in fatal accidents: 1
Pedestrians involved in fatal accidents: 0
Home Mortgage Disclosure Act Aggregated Statistics For Year 2009 (Based on 2 partial tracts)
A) FHA, FSA/RHS & VA Home Purchase Loans
B) Conventional Home Purchase Loans
C) Refinancings
D) Home Improvement Loans
F) Non-occupant Loans on < 5 Family Dwellings (A B C & D)
G) Loans On Manufactured Home Dwelling (A B C & D)
Number
Average Value
Number
Average Value
Number
Average Value
Number
Average Value
Number
Average Value
Number
Average Value
LOANS ORIGINATED
70
$249,141
70
$210,752
138
$204,427
5
$147,602
12
$155,820
1
$19,840
APPLICATIONS APPROVED, NOT ACCEPTED
7
$226,016
11
$227,503
20
$199,462
0
$0
1
$232,010
0
$0
APPLICATIONS DENIED
37
$268,069
34
$252,327
111
$244,795
11
$58,073
6
$254,782
0
$0
APPLICATIONS WITHDRAWN
15
$234,150
13
$212,463
41
$221,123
2
$155,695
2
$234,300
0
$0
FILES CLOSED FOR INCOMPLETENESS
5
$298,870
8
$172,388
19
$247,959
1
$15,260
2
$142,335
0
$0
Aggregated Statistics For Year 2008 (Based on 2 partial tracts)
A) FHA, FSA/RHS & VA Home Purchase Loans
B) Conventional Home Purchase Loans
C) Refinancings
D) Home Improvement Loans
F) Non-occupant Loans on < 5 Family Dwellings (A B C & D)
G) Loans On Manufactured Home Dwelling (A B C & D)
Number
Average Value
Number
Average Value
Number
Average Value
Number
Average Value
Number
Average Value
Number
Average Value
LOANS ORIGINATED
21
$300,701
127
$308,122
214
$266,221
11
$172,899
11
$267,051
0
$0
APPLICATIONS APPROVED, NOT ACCEPTED
3
$302,227
39
$303,832
63
$283,583
5
$126,386
6
$181,005
2
$39,685
APPLICATIONS DENIED
15
$302,838
97
$375,069
227
$319,942
23
$119,225
15
$282,740
0
$0
APPLICATIONS WITHDRAWN
2
$154,165
31
$305,403
68
$291,183
4
$140,430
6
$242,570
0
$0
FILES CLOSED FOR INCOMPLETENESS
2
$316,345
22
$372,650
33
$305,372
2
$274,750
2
$350,310
0
$0
Aggregated Statistics For Year 2007 (Based on 2 partial tracts)
A) FHA, FSA/RHS & VA Home Purchase Loans
B) Conventional Home Purchase Loans
C) Refinancings
D) Home Improvement Loans
E) Loans on Dwellings For 5+ Families
F) Non-occupant Loans on < 5 Family Dwellings (A B C & D)
G) Loans On Manufactured Home Dwelling (A B C & D)
Number
Average Value
Number
Average Value
Number
Average Value
Number
Average Value
Number
Average Value
Number
Average Value
Number
Average Value
LOANS ORIGINATED
2
$403,735
368
$318,767
565
$285,941
47
$149,701
0
$0
31
$259,439
0
$0
APPLICATIONS APPROVED, NOT ACCEPTED
0
$0
92
$321,589
120
$309,147
15
$91,381
0
$0
7
$226,780
2
$91,200
APPLICATIONS DENIED
1
$246,510
290
$374,397
409
$326,806
56
$115,679
0
$0
33
$325,933
1
$45,790
APPLICATIONS WITHDRAWN
0
$0
85
$345,694
137
$291,821
21
$193,053
1
$149,590
6
$307,823
0
$0
FILES CLOSED FOR INCOMPLETENESS
0
$0
30
$361,706
69
$321,119
5
$199,654
0
$0
1
$218,280
0
$0
Aggregated Statistics For Year 2006 (Based on 2 partial tracts)
A) FHA, FSA/RHS & VA Home Purchase Loans
B) Conventional Home Purchase Loans
C) Refinancings
D) Home Improvement Loans
F) Non-occupant Loans on < 5 Family Dwellings (A B C & D)
G) Loans On Manufactured Home Dwelling (A B C & D)
Number
Average Value
Number
Average Value
Number
Average Value
Number
Average Value
Number
Average Value
Number
Average Value
LOANS ORIGINATED
1
$204,540
819
$268,328
724
$278,214
73
$148,803
80
$257,962
2
$44,265
APPLICATIONS APPROVED, NOT ACCEPTED
0
$0
111
$283,367
109
$252,297
17
$117,937
5
$219,648
0
$0
APPLICATIONS DENIED
2
$241,555
391
$273,667
368
$292,810
69
$168,944
36
$286,115
2
$252,240
APPLICATIONS WITHDRAWN
0
$0
128
$281,979
227
$273,552
16
$186,650
16
$239,359
0
$0
FILES CLOSED FOR INCOMPLETENESS
0
$0
45
$243,274
74
$305,930
5
$63,346
6
$236,973
0
$0
Aggregated Statistics For Year 2005 (Based on 2 partial tracts)
B) Conventional Home Purchase Loans
C) Refinancings
D) Home Improvement Loans
F) Non-occupant Loans on < 5 Family Dwellings (A B C & D)
G) Loans On Manufactured Home Dwelling (A B C & D)
Number
Average Value
Number
Average Value
Number
Average Value
Number
Average Value
Number
Average Value
LOANS ORIGINATED
1,259
$237,983
652
$234,089
60
$155,260
136
$233,017
0
$0
APPLICATIONS APPROVED, NOT ACCEPTED
154
$217,259
93
$204,603
8
$115,911
14
$249,185
2
$40,070
APPLICATIONS DENIED
346
$242,757
287
$235,802
56
$125,696
53
$227,462
1
$152,640
APPLICATIONS WITHDRAWN
205
$246,056
198
$230,116
14
$207,154
27
$272,039
1
$237,360
FILES CLOSED FOR INCOMPLETENESS
50
$242,911
92
$238,724
5
$228,502
5
$218,428
0
$0
Aggregated Statistics For Year 2004 (Based on 2 partial tracts)
A) FHA, FSA/RHS & VA Home Purchase Loans
B) Conventional Home Purchase Loans
C) Refinancings
D) Home Improvement Loans
F) Non-occupant Loans on < 5 Family Dwellings (A B C & D)
G) Loans On Manufactured Home Dwelling (A B C & D)
Number
Average Value
Number
Average Value
Number
Average Value
Number
Average Value
Number
Average Value
Number
Average Value
LOANS ORIGINATED
5
$184,694
1,326
$200,918
518
$186,769
42
$104,213
213
$171,709
0
$0
APPLICATIONS APPROVED, NOT ACCEPTED
0
$0
137
$213,189
107
$179,131
5
$59,988
15
$146,178
0
$0
APPLICATIONS DENIED
1
$144,240
231
$206,233
249
$184,596
71
$89,079
55
$200,541
2
$18,315
APPLICATIONS WITHDRAWN
2
$149,970
185
$191,196
140
$187,496
16
$117,438
38
$170,957
0
$0
FILES CLOSED FOR INCOMPLETENESS
1
$181,640
26
$250,565
97
$205,623
5
$72,198
4
$191,755
0
$0
Aggregated Statistics For Year 2003 (Based on 2 partial tracts)
A) FHA, FSA/RHS & VA Home Purchase Loans
B) Conventional Home Purchase Loans
C) Refinancings
D) Home Improvement Loans
F) Non-occupant Loans on < 5 Family Dwellings (A B C & D)
Detailed PMIC statistics for the following Tracts:0101.46
2008 - 2018 National Fire Incident Reporting System (NFIRS) incidents
Based on the data from the years 2008 - 2018 the average number of fires per year is 20. The highest number of fire incidents - 32 took place in 2011, and the least - 5 in 2016. The data has a decreasing trend.
When looking into fire subcategories, the most incidents belonged to: Outside Fires (57.7%), and Mobile Property/Vehicle Fires (29.1%).
Fire incident types reported to NFIRS in Zip Code 33194
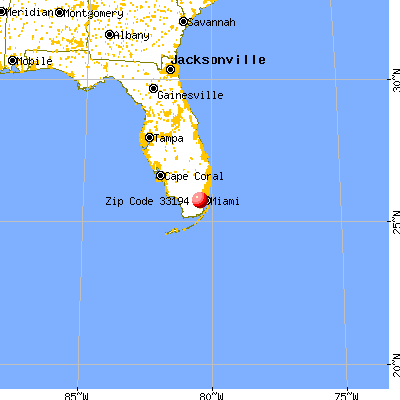


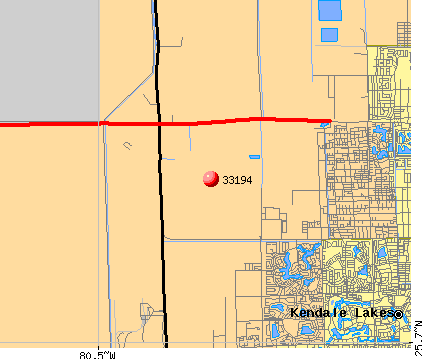 Nearest zip codes: 33196, 33193, 33185, 33187, 33182, 33175.


 Based on the data from the years 2008 - 2018 the average number of fires per year is 20. The highest number of fire incidents - 32 took place in 2011, and the least - 5 in 2016. The data has a decreasing trend.
 When looking into fire subcategories, the most incidents belonged to: Outside Fires (57.7%), and Mobile Property/Vehicle Fires (29.1%).