Estimated zip code population in 2022: 5,177 Zip code population in 2010: 4,926 Zip code population in 2000: 3,895
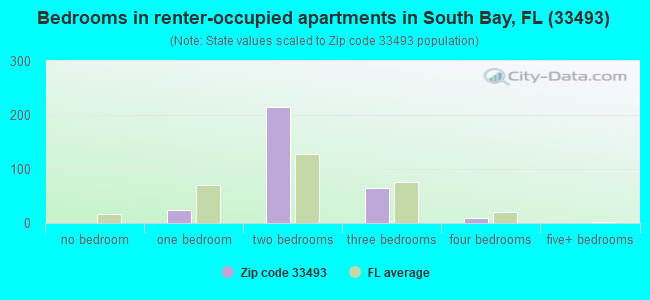
Houses and condos: 856 Renter-occupied apartments: 317
% of renters here:
41%
State:
33%
March 2022 cost of living index in zip code 33493: 96.6 (near average, U.S. average is 100)
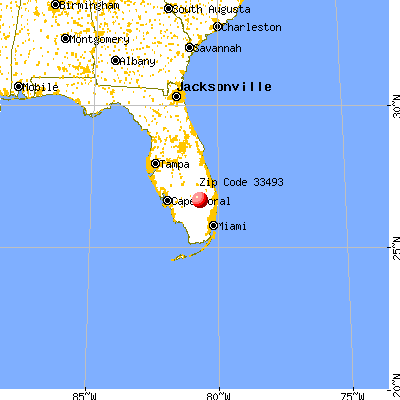
Land area: 62.1 sq. mi. Water area: 0.1 sq. mi.
Population density: 83 people per square mile
(very low).
OSM Map
General Map
Google Map
MSN Map
OSM Map
General Map
Google Map
MSN Map
OSM Map
General Map
Google Map
MSN Map
OSM Map
General Map
Google Map
MSN Map
Please wait while loading the map...
Real estate property taxes paid for housing units in 2022:
This zip code:
0.9% ($1,211)
Florida:
0.7% ($2,529)
Median real estate property taxes paid for housing units with mortgages in 2022: $1,450 (0.8%) Median real estate property taxes paid for housing units with no mortgage in 2022: $1,059 (0.8%)
Business Search- 14 Million verified businesses
Males: 3,897
(75.3%)
Females: 1,281
(24.7%)
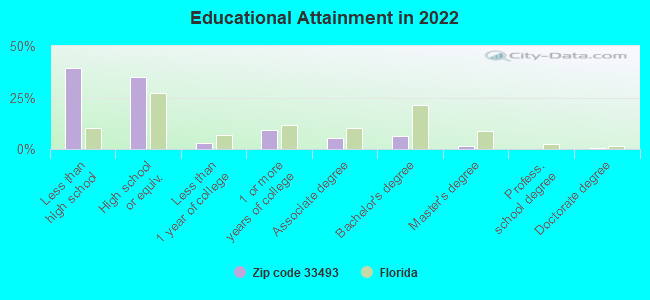
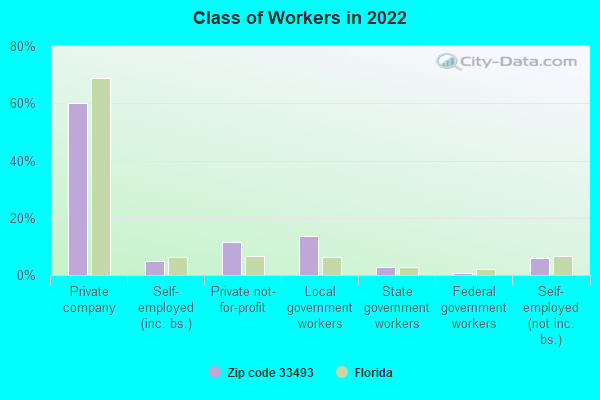
For population 25 years and over in 33493:
High school or higher: 58.0%
Bachelor's degree or higher: 7.7%
Graduate or professional degree: 1.7%
Unemployed: 7.6%
Mean travel time to work (commute): 32.5 minutes
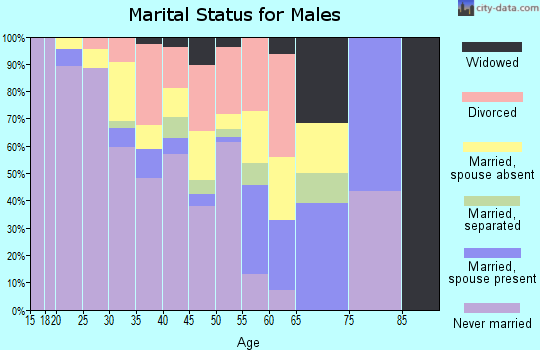
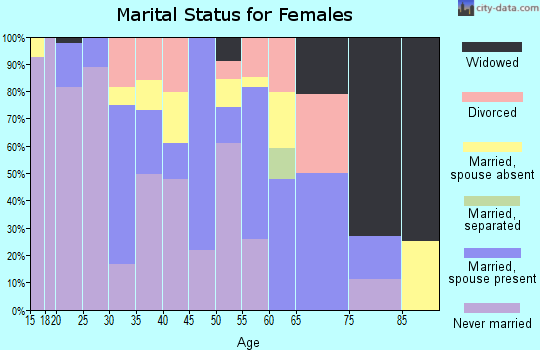
For population 15 years and over in 33493:
Never married: 50.9%
Now married: 28.9%
Separated: 4.3%
Widowed: 2.7%
Divorced: 13.2%
Zip code 33493 compared to state average:
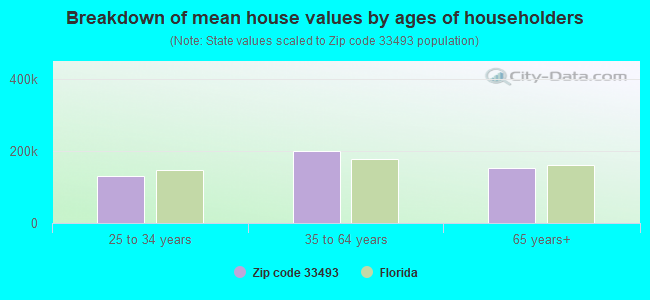
Median house value significantly below state average.
Unemployed percentage above state average.
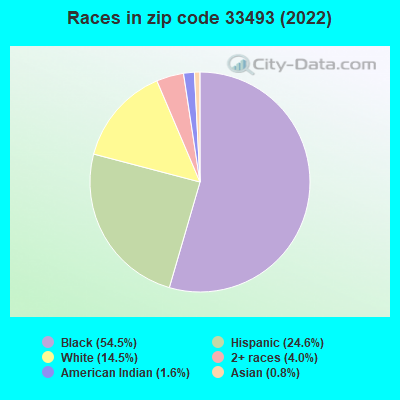
Black race population percentage significantly above state average.
Length of stay since moving in significantly above state average.
Percentage of population with a bachelor's degree or higher significantly below state average.
Estimated median house/condo value in 2022: $142,149
33493:
$142,149
Florida:
$354,100
According to our research of Florida and other state lists, there were 7 registered sex offenders living in 33493 zip code as of May 28, 2024. The ratio of all residents to sex offenders in zip code 33493 is 782 to 1. The ratio of registered sex offenders to all residents in this zip code is lower than the state average.
Median resident age:
This zip code:
41.2 years
Florida median age:
42.7 years
Average household size:
This zip code:
3.0 people
Florida:
2.5 people
Averages for the 2020 tax year for zip code 33493, filed in 2021:
Average Adjusted Gross Income (AGI) in 2020: $22,935 (Individual Income Tax Returns)
Here:
$22,935
State:
$82,200
Salary/wage: $31,251 (reported on 67.0% of returns)
Here:
$31,251
State:
$58,347
(% of AGI for various income ranges: 1551.9% for AGIs below $25k, 4160.0% for AGIs $25k-50k, 7440.9% for AGIs $50k-75k, 6546.0% for AGIs $75k-100k)
Taxable interest for individuals: $39 (reported on 27.1% of returns)
This zip code:
$39
Florida:
$4,272
(% of AGI for various income ranges: 1.0% for AGIs below $25k, 2.3% for AGIs $25k-50k, 4.5% for AGIs $50k-75k)
Ordinary dividends: $150 (reported on 1.1% of returns)
Here:
$150
State:
$15,863
(% of AGI for various income ranges: 0.5% for AGIs below $25k)
Taxable individual retirement arrangement distribution: $10,200 (reported on 2.1% of returns)
33493:
$10,200
Florida:
$24,823
(% of AGI for various income ranges: 8.9% for AGIs below $25k, 90.3% for AGIs $25k-50k)
Total itemized deductions: $29,000 (reported on 1.6% of returns)
Here:
$29,000
State:
$45,393
(% of AGI for various income ranges: 223.1% for AGIs $25k-50k)
Charity contributions: $7,700 (reported on 1.6% of returns)
Here:
$7,700
State:
$20,178
(% of AGI for various income ranges: 59.2% for AGIs $25k-50k)
Taxes paid: $4,233 (reported on 1.6% of returns)
33493:
$4,233
State:
$6,967
(% of AGI for various income ranges: 32.6% for AGIs $25k-50k)
Earned income credit: $3,071 (reported on 34.6% of returns)
Here:
$3,071
State:
$2,306
(% of AGI for various income ranges: 236.7% for AGIs below $25k, 129.5% for AGIs $25k-50k)
Percentage of individuals using paid preparers for their 2020 taxes: 66.0%
Here:
66%
State:
92%
(% for various income ranges: 54.2% for AGIs below $25k, 85.4% for AGIs $25k-50k, 92.9% for AGIs $50k-75k, 80.0% for AGIs $75k-100k, 66.7% for AGIs $100k-200k)
Averages for the 2012 tax year for zip code 33493, filed in 2013:
Average Adjusted Gross Income (AGI) in 2012: $24,082 (Individual Income Tax Returns)
Here:
$24,082
State:
$60,316
Salary/wage: $24,666 (reported on 84.5% of returns)
Here:
$24,666
State:
$45,277
(% of AGI for various income ranges: 88.0% for AGIs below $25k, 92.7% for AGIs $25k-50k, 88.8% for AGIs $50k-75k, 164.7% for AGIs $75k-100k)
Taxable interest for individuals: $4,665 (reported on 12.0% of returns)
This zip code:
$4,665
Florida:
$3,587
(% of AGI for various income ranges: 6.7% for AGIs below $25k, 0.1% for AGIs $25k-50k, 0.1% for AGIs $50k-75k)
Ordinary dividends: $2,233 (reported on 6.3% of returns)
Here:
$2,233
State:
$12,831
(% of AGI for various income ranges: 1.1% for AGIs below $25k, 0.5% for AGIs $25k-50k, 0.3% for AGIs $50k-75k)
Taxable individual retirement arrangement distribution: $9,300 (reported on 2.1% of returns)
33493:
$9,300
Florida:
$21,544
Total itemized deductions: $20,035 (42% of AGI, reported on 14.1% of returns)
Here:
$20,035
State:
$25,533
Here:
42.1% of AGI
State:
18.0% of AGI
(% of AGI for various income ranges: 3.8% for AGIs below $25k, 13.7% for AGIs $25k-50k, 19.1% for AGIs $50k-75k, 42.6% for AGIs $75k-100k)
Charity contributions: $5,853 (reported on 10.6% of returns)
Here:
$5,853
State:
$5,698
(% of AGI for various income ranges: 0.8% for AGIs below $25k, 2.8% for AGIs $25k-50k, 3.8% for AGIs $50k-75k, 11.9% for AGIs $75k-100k)
Taxes paid: $2,117 (reported on 12.7% of returns)
33493:
$2,117
State:
$6,203
(% of AGI for various income ranges: 0.4% for AGIs below $25k, 1.3% for AGIs $25k-50k, 1.6% for AGIs $50k-75k, 4.7% for AGIs $75k-100k)
Earned income credit: $2,753 (reported on 42.3% of returns)
Here:
$2,753
State:
$2,372
(% of AGI for various income ranges: 12.1% for AGIs below $25k, 2.2% for AGIs $25k-50k)
Percentage of individuals using paid preparers for their 2012 taxes: 43.7%
Here:
44%
State:
54%
(% for various income ranges: 44.7% for AGIs below $25k, 38.2% for AGIs $25k-50k, 40.0% for AGIs $50k-75k, 150.0% for AGIs $75k-100k)
Averages for the 2004 tax year for zip code 33493, filed in 2005:
Average Adjusted Gross Income (AGI) in 2004: $27,478 (Individual Income Tax Returns)
Here:
$27,478
State:
$50,523
Salary/wage: $25,451 (reported on 94.0% of returns)
Here:
$25,451
State:
$39,563
(% of AGI for various income ranges: 88.3% for AGIs below $10k, 90.6% for AGIs $10k-25k, 92.9% for AGIs $25k-50k, 92.7% for AGIs $50k-75k, 86.2% for AGIs $75k-100k, 54.8% for AGIs over 100k)
Taxable interest for individuals: $952 (reported on 13.3% of returns)
This zip code:
$952
Florida:
$3,211
(% of AGI for various income ranges: 0.2% for AGIs $10k-25k, 0.2% for AGIs $25k-50k, 0.3% for AGIs $50k-75k, 0.2% for AGIs $75k-100k, 2.3% for AGIs over 100k)
Taxable dividends: $895 (reported on 9.9% of returns)
Here:
$895
State:
$6,129
(% of AGI for various income ranges: 0.1% for AGIs $10k-25k, 0.4% for AGIs $25k-50k, 0.3% for AGIs $50k-75k, 2.0% for AGIs $75k-100k)
Net capital gain/loss: +$3,429 (reported on 1.7% of returns)
Here:
+$3,429
State:
+$27,205
Profit/loss from business: +$2,681 (reported on 7.3% of returns)
Here:
+$2,681
State:
+$10,634
IRA payment deduction: $2,812 (reported on 2.6% of returns)
33493:
$2,812
Florida:
$3,082
Total itemized deductions: $17,532 (36% of AGI, reported on 17.6% of returns)
Here:
$17,532
State:
$20,370
Here:
35.8% of AGI
State:
20.7% of AGI
(% of AGI for various income ranges: 7.8% for AGIs $10k-25k, 12.7% for AGIs $25k-50k, 15.6% for AGIs $50k-75k, 16.3% for AGIs $75k-100k, 9.2% for AGIs over 100k)
Charity contributions deductions: $4,799 (9% of AGI, reported on 15.9% of returns)
Here:
$4,799
State:
$4,064
Here:
9.4% of AGI
State:
3.8% of AGI
(% of AGI for various income ranges: 1.6% for AGIs $10k-25k, 3.3% for AGIs $25k-50k, 4.2% for AGIs $50k-75k, 2.9% for AGIs $75k-100k, 2.4% for AGIs over 100k)
Total tax: $3,449 (reported on 50.7% of returns)
33493:
$3,449
State:
$9,431
(% of AGI for various income ranges: 1.8% for AGIs below $10k, 1.7% for AGIs $10k-25k, 4.1% for AGIs $25k-50k, 7.7% for AGIs $50k-75k, 10.6% for AGIs $75k-100k, 20.7% for AGIs over 100k)
Earned income credit: $2,119 (reported on 49.0% of returns)
Here:
$2,119
State:
$1,808
Percentage of individuals using paid preparers for their 2004 taxes: 56.6%
Here:
57%
State:
60%
(% for various income ranges: 56.6% for AGIs below $10k, 61.0% for AGIs $10k-25k, 50.4% for AGIs $25k-50k, 57.1% for AGIs $50k-75k, 52.4% for AGIs $75k-100k, 72.7% for AGIs over 100k)
Household received Food Stamps/SNAP in the past 12 months: 320 Household did not receive Food Stamps/SNAP in the past 12 months: 438
Women who had a birth in the past 12 months: 9 (4 now married, 4 unmarried) Women who did not have a birth in the past 12 months: 524 (223 now married, 300 unmarried)
Housing units in zip code 33493 with a mortgage: 157 (13 second mortgage) Houses without a mortgage: 10
Median monthly owner costs for units with a mortgage: $1,198 Median monthly owner costs for units without a mortgage: $381
Residents with income below the poverty level in 2022:
This zip code:
30.3%
Whole state:
12.7%
Residents with income below 50% of the poverty level in 2022:
This zip code:
25.0%
Whole state:
6.6%
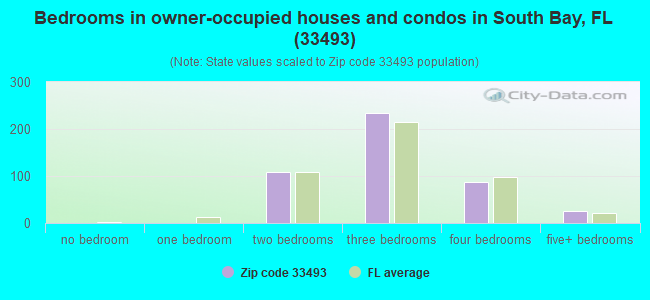
Median number of rooms in houses and condos:
Here:
5.6
State:
5.9
Median number of rooms in apartments:
Here:
3.7
State:
4.2
Notable locations in this zip code not listed on our city pages
Notable locations in zip code 33493: South Bay Recreational Vehicle Campground (A), South Shore Station (B), South Bay Mini Plaza (C), Palm Beach County Library System Clarence E Anthony Branch Library (D), South Bay Correctional Facility (E), Palm Beach County Fire and Rescue Station 74 (F), South Bay Public Safety Department (G). Display/hide their locations on the map
In group quarters: 2,790 (-1 institutionalized population)
Size of family households: 211 2-persons, 122 3-persons, 89 4-persons, 144 5-persons, 17 6-persons
Size of nonfamily households: 139 1-person, 45 2-persons
252 married couples with children.
301 single-parent households (84 men, 217 women).
71.2% of residents of 33493 zip code speak English at home.
21.9% of residents speak Spanish at home (48% very well, 23% well, 17% not well, 11% not at all).
6.2% of residents speak other Indo-European language at home (56% very well, 20% well, 8% not well, 16% not at all).
0.1% of residents speak Asian or Pacific Island language at home (100% very well).
0.3% of residents speak other language at home (35% very well, 65% not well).
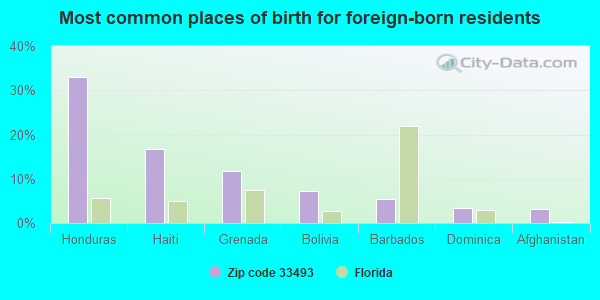
Foreign born population: 1,151 (22.2%) (30.8% of them are naturalized citizens)
This zip code:
22.2%
Whole state:
21.7%
33%Honduras
17%Haiti
12%Grenada
7%Bolivia
5%Barbados
3%Dominica
3%Afghanistan
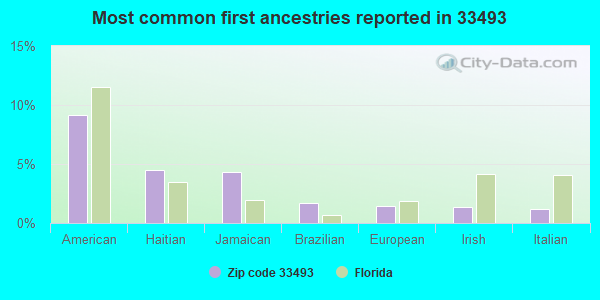
9%American
5%Haitian
4%Jamaican
2%Brazilian
1%European
1%Irish
1%Italian
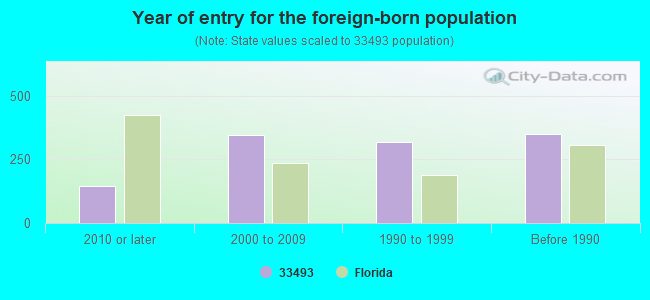
Year of entry for the foreign-born population
1462010 or later
3442000 to 2009
3171990 to 1999
348Before 1990
Major facilities with environmental interests located in this zip code:
OKEELANTA CORPORATION (21250 HIGHWAY 27 in SOUTH BAY, FL)
AIR MAJOR (AIRS/AFS) CRITERIA AND HAZARDOUS AIR POLLUTANT INVENTORY (Inventory of air pollution sources) AIR MAJOR ("Best Available" air pollution technologies tracking) HAZARDOUS WASTE BIENNIAL REPORTER (Resource Conservation and Recovery Act (tracking hazardous waste)) Small Quantity Generators, between 100 kg and 1000 kg of hazardous waste/month (Resource Conservation and Recovery Act (tracking hazardous waste)) TRI REPORTER (Tracking of toxic chemicals releasing facilities) Business SIC classification: SUGARCANE AND SUGAR BEETS; CANE SUGAR, EXCEPT REFINING; CANE SUGAR REFINING; ELECTRIC SERVICES Business NAICS classification: SUGARCANE MILLS.; SUGARCANE MILLS. Alternative names: OKEELANTA CORPORATION SUGAR MILL, OKEELANTA CORPORATION SUGAR MILL
ROSENWALD ELEMENTARY SCHOOL (1321 MARTIN L. KING BLVD in SOUTH BAY, FL)
(National Center for Education Statistics) - STATE ID-1321 Organizations: PALM BEACH COUNTY SCHOOL DISTRICT (SCHOOL DISTRICT)
NEW HOPE POWER PARTNERSHIP (8001 HIGHWAY 27 SOUTH in SOUTH BAY, FL)
AIR MAJOR (AIRS/AFS) CRITERIA AND HAZARDOUS AIR POLLUTANT INVENTORY (Inventory of air pollution sources) AIR MAJOR ("Best Available" air pollution technologies tracking) (Resource Conservation and Recovery Act (tracking hazardous waste)) Business SIC classification: ELECTRIC SERVICES Organizations: JAMES MERIWETHER ENV SFTY REP (CONTACT/OWNER)
Alternative names: OKEELANTA COGENERATION, OKEELANTA COGENERATION PLANT, OKEELANTA POWER L.P.
SOUTH BAY CITY OF (335 SOUTHWEST 2ND AVE in SOUTH BAY, FL)
(Integrated Compliance Information System) - ICIS-04-1990-0175, FORMAL ENFORCEMENT ACTION
544 BED CLOSE CUSTODY ADDITION (600 SOUTH US HIGHWAY 27 in SOUTH BAY, FL)
National Pollutant Discharge Elimination System NON-MAJOR (Tracking pollutant discharge elimination systems) - permit Organizations: JASON HARALSON (CONTACT/OWNER)
MACE SOD SERVICE INC (275 SW 3RD AVE in SOUTH BAY, FL)
(Resource Conservation and Recovery Act (tracking hazardous waste)) Organizations: RICHARD BURNS, MGR (CONTACT/OWNER)
MULTI TURF INC (US HWY 27 S 12 MI in SOUTH BAY, FL)
(Resource Conservation and Recovery Act (tracking hazardous waste)) Organizations: RAY CARUTHERS, PRES (CONTACT/OWNER)
MULTI TURF INC FARM #1 (US HWY 27 S 23 MI in SOUTH BAY, FL)
(Resource Conservation and Recovery Act (tracking hazardous waste)) Organizations: RAYMOND CARUTHERS PRES (CONTACT/OWNER)
SOUTH BAY SUBSTATION (400 S US 27 in SOUTH BAY, FL)
MULTI TURF INC (US HWY 27 S 18 MI in SOUTH BAY, FL)
Small Quantity Generators, between 100 kg and 1000 kg of hazardous waste/month (Resource Conservation and Recovery Act (tracking hazardous waste)) - notification Organizations: RAY CARUTHERS, PRES (CONTACT/OWNER)
NEW HOPE SOUTH INC (15500 S US HWY 27 in SOUTH BAY, FL)
Small Quantity Generators, between 100 kg and 1000 kg of hazardous waste/month (Resource Conservation and Recovery Act (tracking hazardous waste)) - notification Organizations: ROBERT KIRSTEIN, FARM MGR (CONTACT/OWNER)
PALM BEACH CO ROSENWALD ELEM (1321 PALM BEACH ROAD WEST in SOUTH BAY, FL)
Small Quantity Generators, between 100 kg and 1000 kg of hazardous waste/month (Resource Conservation and Recovery Act (tracking hazardous waste)) - notification Organizations: SNYDER MICHAEL ENV (CONTACT/OWNER)
PRIDE SOUTH BAY (700 US HWY 27 in SOUTH BAY, FL)
Small Quantity Generators, between 100 kg and 1000 kg of hazardous waste/month (Resource Conservation and Recovery Act (tracking hazardous waste)) Organizations: WACKENHUT CORRECTIONS (CONTACT/OWNER)
Housing units lacking complete plumbing facilities: 3.6% Housing units lacking complete kitchen facilities: 5.1%
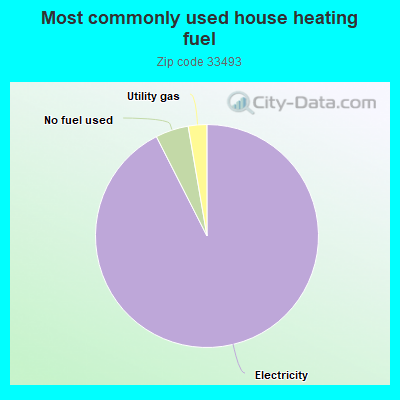
92.7%Electricity
4.8%No fuel used
2.7%Utility gas
Population in 1990: 3,723. Population change in the 1990s: +172 (+4.6%).
Place of birth for U.S.-born residents:
This state: 2,631
Northeast: 381
Midwest: 300
South: 572
West: 37
47% of the 33493 zip code residents lived in the same house 5 years ago. Out of people who lived in different houses, 83% lived in this county. Out of people who lived in different counties, 50% lived in Florida.
84% of the 33493 zip code residents lived in the same house 1 year ago. Out of people who lived in different houses, 6% moved from this county. Out of people who lived in different houses, 92% moved from different county within same state. Out of people who lived in different houses, 2% moved from different state. Out of people who lived in different houses, 3% moved from abroad.
Private vs. public school enrollment:
Students in private schools in grades 1 to 8 (elementary and middle school): 65
Here:
15.1%
Florida:
15.8%
Students in private schools in grades 9 to 12 (high school): 369
Here:
62.8%
Florida:
12.9%
Students in private undergraduate colleges: 147
Here:
66.6%
Florida:
23.6%
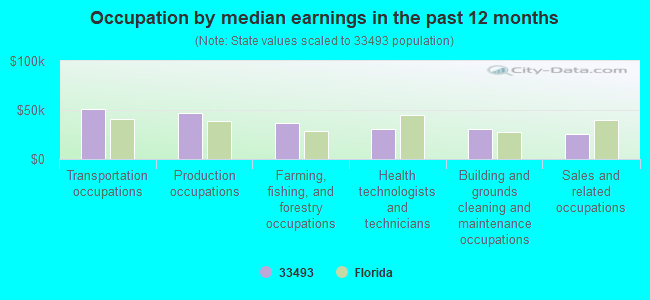
Occupation by median earnings in the past 12 months ($)
51,276Transportation occupations
46,749Production occupations
36,926Farming, fishing, and forestry occupations
30,581Health technologists and technicians
30,285Building and grounds cleaning and maintenance occupations
25,076Sales and related occupations
Top industries in this zip code by the number of employees in 2005:
Administrative and Support and Waste Management and Remediation Services: Security Guards and Patrol Services (250-499 employees: 1 establishment)
Management of Companies and Enterprises: Corporate, Subsidiary, and Regional Managing Offices (20-49: 1)
Health Care and Social Assistance: Child Day Care Services (20-49: 1)
Information: Cable and Other Program Distribution (10-19: 1)
Administrative and Support and Waste Management and Remediation Services: Septic Tank and Related Services (10-19: 1)
People in group quarters in 2010:
1,865 people in state prisons
6 people in residential treatment centers for adults
People in group quarters in 2000:
1,122 people in state prisons
7 people in other noninstitutional group quarters
Fatal accident statistics in 2014:
Fatal accident count: 1
Vehicles involved in fatal accidents: 1
Fatal accidents caused by drunken drivers: 1
Fatalities: 1
Persons involved in fatal accidents: 1
Pedestrians involved in fatal accidents: 0
Fatal accident statistics in 2013:
Fatal accident count: 1
Vehicles involved in fatal accidents: 1
Fatal accidents caused by drunken drivers: 0
Fatalities: 1
Persons involved in fatal accidents: 1
Pedestrians involved in fatal accidents: 0
Home Mortgage Disclosure Act Aggregated Statistics For Year 2009 (Based on 2 partial tracts)
A) FHA, FSA/RHS & VA Home Purchase Loans
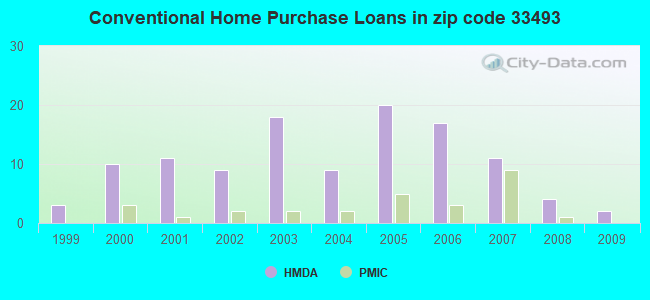
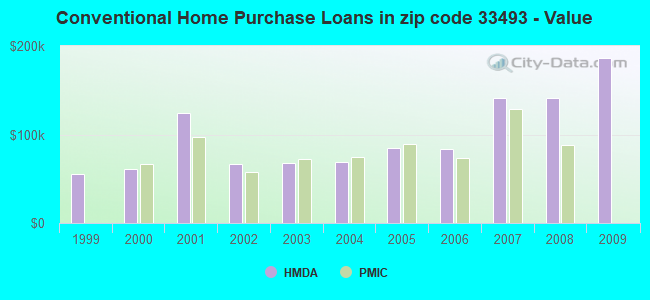
B) Conventional Home Purchase Loans
C) Refinancings
D) Home Improvement Loans
F) Non-occupant Loans on < 5 Family Dwellings (A B C & D)
Number
Average Value
Number
Average Value
Number
Average Value
Number
Average Value
Number
Average Value
LOANS ORIGINATED
0
$0
2
$185,910
4
$137,728
3
$3,410
2
$104,895
APPLICATIONS APPROVED, NOT ACCEPTED
0
$0
1
$25,580
3
$67,940
0
$0
1
$25,580
APPLICATIONS DENIED
2
$64,385
0
$0
7
$113,300
3
$25,300
2
$35,820
APPLICATIONS WITHDRAWN
0
$0
1
$40,080
4
$184,845
0
$0
0
$0
FILES CLOSED FOR INCOMPLETENESS
0
$0
0
$0
1
$175,680
0
$0
0
$0
Aggregated Statistics For Year 2008 (Based on 2 partial tracts)
A) FHA, FSA/RHS & VA Home Purchase Loans
B) Conventional Home Purchase Loans
C) Refinancings
D) Home Improvement Loans
F) Non-occupant Loans on < 5 Family Dwellings (A B C & D)
G) Loans On Manufactured Home Dwelling (A B C & D)
Number
Average Value
Number
Average Value
Number
Average Value
Number
Average Value
Number
Average Value
Number
Average Value
LOANS ORIGINATED
1
$49,460
4
$141,352
19
$95,648
2
$118,540
4
$112,358
0
$0
APPLICATIONS APPROVED, NOT ACCEPTED
0
$0
2
$43,495
5
$195,974
3
$60,550
2
$43,495
0
$0
APPLICATIONS DENIED
1
$115,980
4
$128,560
26
$85,608
3
$9,950
4
$94,235
2
$53,725
APPLICATIONS WITHDRAWN
1
$88,690
0
$0
4
$82,722
0
$0
1
$101,480
0
$0
FILES CLOSED FOR INCOMPLETENESS
1
$115,980
0
$0
3
$100,630
0
$0
0
$0
0
$0
Aggregated Statistics For Year 2007 (Based on 2 partial tracts)
B) Conventional Home Purchase Loans
C) Refinancings
D) Home Improvement Loans
F) Non-occupant Loans on < 5 Family Dwellings (A B C & D)
G) Loans On Manufactured Home Dwelling (A B C & D)
Number
Average Value
Number
Average Value
Number
Average Value
Number
Average Value
Number
Average Value
LOANS ORIGINATED
11
$141,332
24
$116,976
4
$50,742
2
$84,000
0
$0
APPLICATIONS APPROVED, NOT ACCEPTED
3
$84,143
9
$119,392
1
$75,900
2
$122,375
0
$0
APPLICATIONS DENIED
14
$105,443
32
$114,462
10
$58,843
9
$102,716
3
$38,093
APPLICATIONS WITHDRAWN
3
$136,733
24
$98,250
0
$0
1
$102,340
0
$0
FILES CLOSED FOR INCOMPLETENESS
2
$103,190
3
$120,530
0
$0
0
$0
0
$0
Aggregated Statistics For Year 2006 (Based on 2 partial tracts)
A) FHA, FSA/RHS & VA Home Purchase Loans
B) Conventional Home Purchase Loans
C) Refinancings
D) Home Improvement Loans
F) Non-occupant Loans on < 5 Family Dwellings (A B C & D)
G) Loans On Manufactured Home Dwelling (A B C & D)
Number
Average Value
Number
Average Value
Number
Average Value
Number
Average Value
Number
Average Value
Number
Average Value
LOANS ORIGINATED
1
$208,940
17
$83,123
34
$91,124
4
$37,310
14
$91,432
0
$0
APPLICATIONS APPROVED, NOT ACCEPTED
0
$0
7
$97,829
7
$85,889
3
$61,117
2
$80,590
1
$30,700
APPLICATIONS DENIED
0
$0
14
$77,970
38
$107,004
15
$44,971
5
$78,116
3
$29,847
APPLICATIONS WITHDRAWN
0
$0
4
$147,320
21
$100,915
2
$39,655
1
$66,520
0
$0
FILES CLOSED FOR INCOMPLETENESS
0
$0
1
$127,920
5
$105,236
0
$0
0
$0
0
$0
Aggregated Statistics For Year 2005 (Based on 2 partial tracts)
A) FHA, FSA/RHS & VA Home Purchase Loans
B) Conventional Home Purchase Loans
C) Refinancings
D) Home Improvement Loans
F) Non-occupant Loans on < 5 Family Dwellings (A B C & D)
G) Loans On Manufactured Home Dwelling (A B C & D)
Number
Average Value
Number
Average Value
Number
Average Value
Number
Average Value
Number
Average Value
Number
Average Value
LOANS ORIGINATED
1
$75,900
20
$85,152
28
$77,148
4
$57,778
11
$75,666
1
$13,640
APPLICATIONS APPROVED, NOT ACCEPTED
0
$0
4
$99,565
11
$72,798
1
$4,260
3
$92,103
0
$0
APPLICATIONS DENIED
0
$0
13
$77,080
43
$80,282
10
$58,161
7
$58,721
1
$23,880
APPLICATIONS WITHDRAWN
0
$0
1
$106,600
44
$93,401
5
$108,818
1
$64,810
1
$68,220
FILES CLOSED FOR INCOMPLETENESS
0
$0
2
$65,665
8
$75,152
3
$68,223
1
$93,810
0
$0
Aggregated Statistics For Year 2004 (Based on 2 partial tracts)
A) FHA, FSA/RHS & VA Home Purchase Loans
B) Conventional Home Purchase Loans
C) Refinancings
D) Home Improvement Loans
F) Non-occupant Loans on < 5 Family Dwellings (A B C & D)
G) Loans On Manufactured Home Dwelling (A B C & D)
Number
Average Value
Number
Average Value
Number
Average Value
Number
Average Value
Number
Average Value
Number
Average Value
LOANS ORIGINATED
2
$91,250
9
$69,456
25
$74,774
7
$36,914
6
$56,427
0
$0
APPLICATIONS APPROVED, NOT ACCEPTED
0
$0
2
$49,460
8
$57,244
2
$42,640
3
$66,520
0
$0
APPLICATIONS DENIED
0
$0
9
$69,646
41
$74,152
15
$40,479
8
$62,894
2
$23,450
APPLICATIONS WITHDRAWN
0
$0
1
$284,840
24
$81,655
2
$12,790
0
$0
0
$0
FILES CLOSED FOR INCOMPLETENESS
0
$0
4
$74,192
12
$81,372
1
$14,500
1
$57,990
0
$0
Aggregated Statistics For Year 2003 (Based on 2 partial tracts)
A) FHA, FSA/RHS & VA Home Purchase Loans
B) Conventional Home Purchase Loans
C) Refinancings
D) Home Improvement Loans
E) Loans on Dwellings For 5+ Families
F) Non-occupant Loans on < 5 Family Dwellings (A B C & D)
Number
Average Value
Number
Average Value
Number
Average Value
Number
Average Value
Number
Average Value
Number
Average Value
LOANS ORIGINATED
1
$77,600
18
$67,798
21
$63,391
3
$16,203
1
$562,850
9
$43,967
APPLICATIONS APPROVED, NOT ACCEPTED
0
$0
3
$61,400
4
$71,210
0
$0
1
$255,840
0
$0
APPLICATIONS DENIED
0
$0
3
$50,030
33
$61,040
7
$12,427
0
$0
1
$38,380
APPLICATIONS WITHDRAWN
4
$81,870
0
$0
13
$68,158
0
$0
0
$0
2
$50,740
FILES CLOSED FOR INCOMPLETENESS
0
$0
0
$0
3
$59,980
0
$0
0
$0
1
$71,640
Aggregated Statistics For Year 2002 (Based on 2 partial tracts)
A) FHA, FSA/RHS & VA Home Purchase Loans
B) Conventional Home Purchase Loans
C) Refinancings
D) Home Improvement Loans
F) Non-occupant Loans on < 5 Family Dwellings (A B C & D)
Number
Average Value
Number
Average Value
Number
Average Value
Number
Average Value
Number
Average Value
LOANS ORIGINATED
2
$61,400
9
$66,423
17
$68,776
4
$5,118
2
$58,415
APPLICATIONS APPROVED, NOT ACCEPTED
1
$61,400
2
$69,930
7
$59,696
1
$4,260
2
$87,410
APPLICATIONS DENIED
0
$0
6
$34,538
39
$59,412
14
$8,833
2
$25,160
APPLICATIONS WITHDRAWN
0
$0
1
$57,990
25
$58,638
1
$34,110
2
$59,695
FILES CLOSED FOR INCOMPLETENESS
0
$0
0
$0
10
$61,828
0
$0
0
$0
Aggregated Statistics For Year 2001 (Based on 2 partial tracts)
A) FHA, FSA/RHS & VA Home Purchase Loans
B) Conventional Home Purchase Loans
C) Refinancings
D) Home Improvement Loans
F) Non-occupant Loans on < 5 Family Dwellings (A B C & D)
Number
Average Value
Number
Average Value
Number
Average Value
Number
Average Value
Number
Average Value
LOANS ORIGINATED
2
$51,595
11
$124,664
7
$53,239
7
$8,893
1
$42,640
APPLICATIONS APPROVED, NOT ACCEPTED
0
$0
3
$65,097
4
$69,502
1
$2,560
0
$0
APPLICATIONS DENIED
0
$0
9
$44,914
32
$57,191
11
$11,862
2
$41,360
APPLICATIONS WITHDRAWN
0
$0
1
$57,990
15
$54,750
1
$63,110
0
$0
FILES CLOSED FOR INCOMPLETENESS
0
$0
3
$75,900
3
$76,183
1
$8,530
0
$0
Aggregated Statistics For Year 2000 (Based on 2 partial tracts)
A) FHA, FSA/RHS & VA Home Purchase Loans
B) Conventional Home Purchase Loans
C) Refinancings
D) Home Improvement Loans
F) Non-occupant Loans on < 5 Family Dwellings (A B C & D)
Number
Average Value
Number
Average Value
Number
Average Value
Number
Average Value
Number
Average Value
LOANS ORIGINATED
2
$46,480
10
$61,146
15
$55,034
4
$9,168
4
$49,675
APPLICATIONS APPROVED, NOT ACCEPTED
0
$0
3
$61,400
3
$46,903
1
$50,320
0
$0
APPLICATIONS DENIED
0
$0
9
$39,987
21
$63,310
6
$12,508
0
$0
APPLICATIONS WITHDRAWN
0
$0
1
$79,310
9
$55,527
0
$0
2
$58,845
FILES CLOSED FOR INCOMPLETENESS
0
$0
2
$67,370
12
$85,707
0
$0
1
$366,700
Aggregated Statistics For Year 1999 (Based on 1 partial tract)
B) Conventional Home Purchase Loans
C) Refinancings
D) Home Improvement Loans
F) Non-occupant Loans on < 5 Family Dwellings (A B C & D)
Detailed PMIC statistics for the following Tracts:0083.02
2002 - 2018 National Fire Incident Reporting System (NFIRS) incidents
According to the data from the years 2002 - 2018 the average number of fire incidents per year is 26. The highest number of fire incidents - 53 took place in 2006, and the least - 11 in 2010. The data has a declining trend.
When looking into fire subcategories, the most reports belonged to: Outside Fires (50.4%), and Mobile Property/Vehicle Fires (23.1%).
Fire incident types reported to NFIRS in Zip Code 33493


 Nearest zip codes: 33430, 33476, 33440, 33438, 33470, 33414.


 According to the data from the years 2002 - 2018 the average number of fire incidents per year is 26. The highest number of fire incidents - 53 took place in 2006, and the least - 11 in 2010. The data has a declining trend.
 When looking into fire subcategories, the most reports belonged to: Outside Fires (50.4%), and Mobile Property/Vehicle Fires (23.1%).