Estimated zip code population in 2022: 1,623 Zip code population in 2010: 1,669 Zip code population in 2000: 1,601
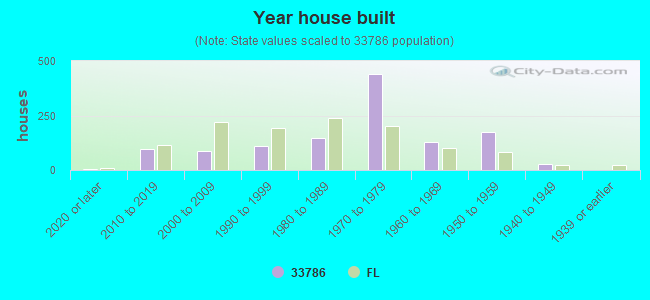
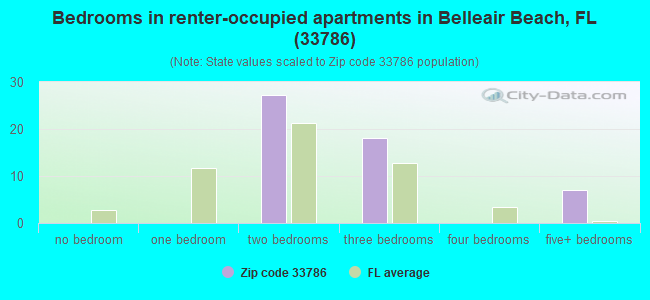
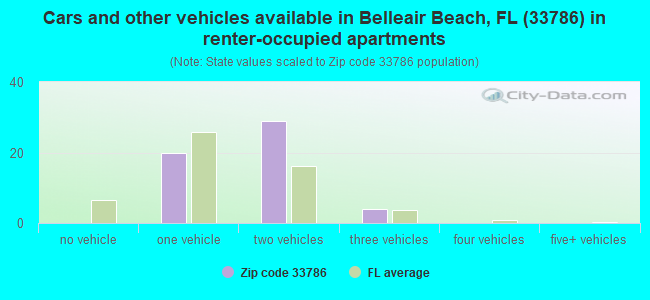
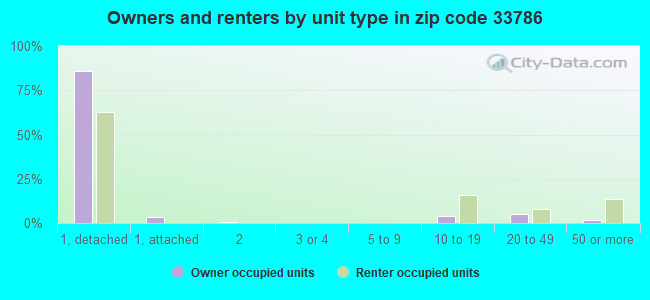
Houses and condos: 1,252 Renter-occupied apartments: 53
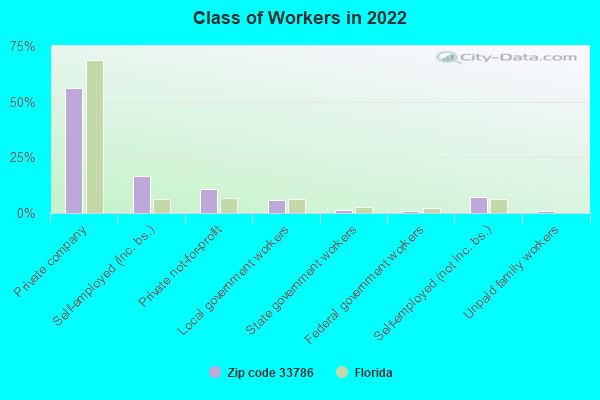
% of renters here:
7%
State:
33%
March 2022 cost of living index in zip code 33786: 107.5 (more than average, U.S. average is 100)
Land area: 0.5 sq. mi. Water area: 1.7 sq. mi.
Population density: 3,018 people per square mile
(average).
OSM Map
General Map
Google Map
MSN Map
OSM Map
General Map
Google Map
MSN Map
OSM Map
General Map
Google Map
MSN Map
OSM Map
General Map
Google Map
MSN Map
Please wait while loading the map...
Real estate property taxes paid for housing units in 2022:
This zip code:
0.7% ($7,780)
Florida:
0.7% ($2,529)
Median real estate property taxes paid for housing units with mortgages in 2022: $10,570 (0.7%) Median real estate property taxes paid for housing units with no mortgage in 2022: $6,905 (0.6%)
Business Search- 14 Million verified businesses
Males: 812
(50.1%)
Females: 810
(49.9%)
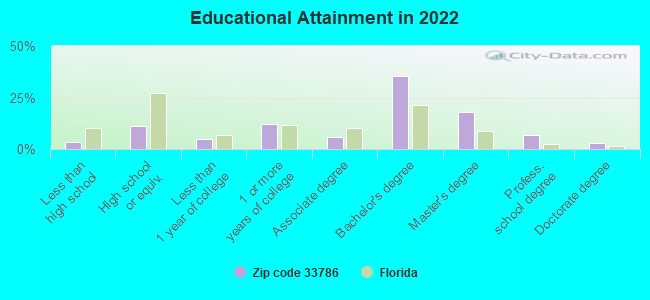
For population 25 years and over in 33786:
High school or higher: 98.7%
Bachelor's degree or higher: 63.9%
Graduate or professional degree: 27.9%
Unemployed: 2.3%
Mean travel time to work (commute): 29.6 minutes
For population 15 years and over in 33786:
Never married: 13.9%
Now married: 69.2%
Separated: 0.8%
Widowed: 4.7%
Divorced: 11.4%
Zip code 33786 compared to state average:
Median household income above state average.
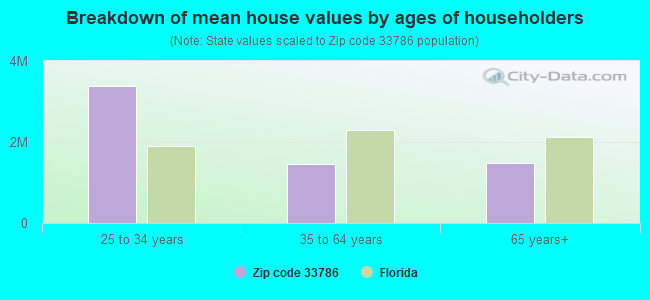
Median house value significantly above state average.
Unemployed percentage below state average.
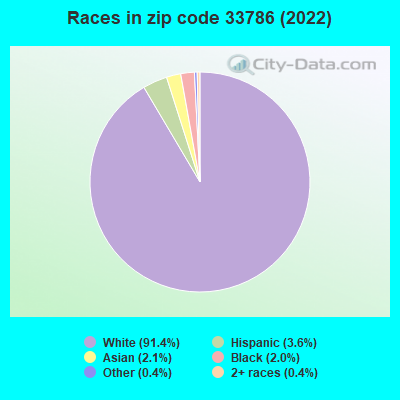
Black race population percentage significantly below state average.
Hispanic race population percentage significantly below state average.
Median age significantly above state average.
Foreign-born population percentage below state average.
Renting percentage significantly below state average.
Length of stay since moving in significantly above state average.
Number of rooms per house above state average.
Number of college students below state average.
Percentage of population with a bachelor's degree or higher significantly above state average.
Estimated median house/condo value in 2022: $1,196,087
33786:
$1,196,087
Florida:
$354,100
Median resident age:
This zip code:
60.4 years
Florida median age:
42.7 years
Average household size:
This zip code:
2.2 people
Florida:
2.5 people
Averages for the 2020 tax year for zip code 33786, filed in 2021:
Average Adjusted Gross Income (AGI) in 2020: $328,613 (Individual Income Tax Returns)
Here:
$328,613
State:
$82,200
Salary/wage: $203,247 (reported on 61.6% of returns)
Here:
$203,247
State:
$58,347
(% of AGI for various income ranges: 1080.0% for AGIs below $25k, 3824.0% for AGIs $25k-50k, 4552.5% for AGIs $50k-75k, 6423.3% for AGIs $75k-100k, 15372.5% for AGIs $100k-200k, 126998.6% for AGIs over 200k)
Taxable interest for individuals: $10,305 (reported on 64.0% of returns)
This zip code:
$10,305
Florida:
$4,272
(% of AGI for various income ranges: 83.8% for AGIs below $25k, 188.0% for AGIs $25k-50k, 465.0% for AGIs $50k-75k, 313.3% for AGIs $75k-100k, 838.7% for AGIs $100k-200k, 6508.6% for AGIs over 200k)
Ordinary dividends: $32,579 (reported on 55.8% of returns)
Here:
$32,579
State:
$15,863
(% of AGI for various income ranges: 133.8% for AGIs below $25k, 482.0% for AGIs $25k-50k, 892.5% for AGIs $50k-75k, 1486.7% for AGIs $75k-100k, 1547.5% for AGIs $100k-200k, 18927.1% for AGIs over 200k)
Net capital gain/loss in AGI: +$168,950 (reported on 53.5% of returns)
Here:
+$168,950
State:
+$62,983
(% of AGI for various income ranges: 88.8% for AGIs below $25k, 92.0% for AGIs $25k-50k, 792.5% for AGIs $50k-75k, 730.0% for AGIs $75k-100k, 2155.0% for AGIs $100k-200k, 107628.6% for AGIs over 200k)
Profit/loss from business: +$28,594 (reported on 19.8% of returns)
Here:
+$28,594
State:
+$9,719
(% of AGI for various income ranges: 213.8% for AGIs below $25k, 322.0% for AGIs $25k-50k, 860.0% for AGIs $50k-75k, 928.8% for AGIs $100k-200k, 4917.1% for AGIs over 200k)
Taxable individual retirement arrangement distribution: $38,417 (reported on 20.9% of returns)
33786:
$38,417
Florida:
$24,823
(% of AGI for various income ranges: 313.8% for AGIs below $25k, 2090.0% for AGIs $50k-75k, 3312.5% for AGIs $100k-200k, 4540.0% for AGIs over 200k)
Total itemized deductions: $76,868 (reported on 29.1% of returns)
Here:
$76,868
State:
$45,393
(% of AGI for various income ranges: 3965.0% for AGIs $50k-75k, 2488.8% for AGIs $100k-200k, 22342.9% for AGIs over 200k)
Charity contributions: $38,138 (reported on 24.4% of returns)
Here:
$38,138
State:
$20,178
(% of AGI for various income ranges: 550.0% for AGIs $50k-75k, 583.8% for AGIs $100k-200k, 10460.0% for AGIs over 200k)
Taxes paid: $8,848 (reported on 29.1% of returns)
33786:
$8,848
State:
$6,967
(% of AGI for various income ranges: 837.5% for AGIs $50k-75k, 628.8% for AGIs $100k-200k, 1962.9% for AGIs over 200k)
Earned income credit: $1,700 (reported on 4.7% of returns)
Here:
$1,700
State:
$2,306
(% of AGI for various income ranges: 85.0% for AGIs below $25k)
Percentage of individuals using paid preparers for their 2020 taxes: 93.0%
Here:
93%
State:
92%
(% for various income ranges: 94.4% for AGIs below $25k, 100.0% for AGIs $25k-50k, 87.5% for AGIs $50k-75k, 83.3% for AGIs $75k-100k, 94.7% for AGIs $100k-200k, 92.3% for AGIs over 200k)
Averages for the 2012 tax year for zip code 33786, filed in 2013:
Average Adjusted Gross Income (AGI) in 2012: $199,594 (Individual Income Tax Returns)
Here:
$199,594
State:
$60,316
Salary/wage: $120,137 (reported on 64.6% of returns)
Here:
$120,137
State:
$45,277
(% of AGI for various income ranges: 60.4% for AGIs below $25k, 53.7% for AGIs $25k-50k, 53.2% for AGIs $50k-75k, 36.4% for AGIs $75k-100k, 48.6% for AGIs $100k-200k, 35.4% for AGIs over 200k)
Taxable interest for individuals: $8,665 (reported on 60.8% of returns)
This zip code:
$8,665
Florida:
$3,587
(% of AGI for various income ranges: 4.2% for AGIs below $25k, 2.0% for AGIs $25k-50k, 1.3% for AGIs $50k-75k, 2.1% for AGIs $75k-100k, 2.2% for AGIs $100k-200k, 2.8% for AGIs over 200k)
Ordinary dividends: $25,345 (reported on 48.1% of returns)
Here:
$25,345
State:
$12,831
(% of AGI for various income ranges: 8.0% for AGIs below $25k, 6.2% for AGIs $25k-50k, 6.1% for AGIs $50k-75k, 7.5% for AGIs $75k-100k, 6.6% for AGIs $100k-200k, 5.9% for AGIs over 200k)
Net capital gain/loss in AGI: +$65,082 (reported on 48.1% of returns)
Here:
+$65,082
State:
+$33,493
(% of AGI for various income ranges: 3.5% for AGIs $100k-200k, 20.5% for AGIs over 200k)
Profit/loss from business: +$21,443 (reported on 17.7% of returns)
Here:
+$21,443
State:
+$10,012
(% of AGI for various income ranges: 7.6% for AGIs below $25k, 6.3% for AGIs $25k-50k, 4.0% for AGIs $50k-75k, 3.2% for AGIs $100k-200k, 1.4% for AGIs over 200k)
Taxable individual retirement arrangement distribution: $47,481 (reported on 20.3% of returns)
33786:
$47,481
Florida:
$21,544
(% of AGI for various income ranges: 22.0% for AGIs below $25k, 14.8% for AGIs $50k-75k, 8.4% for AGIs $100k-200k, 3.6% for AGIs over 200k)
Total itemized deductions: $48,721 (15% of AGI, reported on 54.4% of returns)
Here:
$48,721
State:
$25,533
Here:
15.2% of AGI
State:
18.0% of AGI
(% of AGI for various income ranges: 30.4% for AGIs below $25k, 19.4% for AGIs $25k-50k, 18.4% for AGIs $50k-75k, 13.8% for AGIs $75k-100k, 17.7% for AGIs $100k-200k, 11.6% for AGIs over 200k)
Charity contributions: $15,530 (reported on 46.8% of returns)
Here:
$15,530
State:
$5,698
(% of AGI for various income ranges: 0.9% for AGIs below $25k, 1.6% for AGIs $25k-50k, 2.2% for AGIs $50k-75k, 1.5% for AGIs $75k-100k, 2.6% for AGIs $100k-200k, 4.1% for AGIs over 200k)
Taxes paid: $16,223 (reported on 54.4% of returns)
33786:
$16,223
State:
$6,203
(% of AGI for various income ranges: 8.3% for AGIs below $25k, 5.8% for AGIs $25k-50k, 5.3% for AGIs $50k-75k, 5.1% for AGIs $75k-100k, 5.6% for AGIs $100k-200k, 4.0% for AGIs over 200k)
Earned income credit: $1,150 (reported on 5.1% of returns)
Here:
$1,150
State:
$2,372
(% of AGI for various income ranges: 1.9% for AGIs below $25k)
Percentage of individuals using paid preparers for their 2012 taxes: 65.8%
Here:
66%
State:
54%
(% for various income ranges: 61.9% for AGIs below $25k, 50.0% for AGIs $25k-50k, 63.6% for AGIs $50k-75k, 66.7% for AGIs $75k-100k, 68.8% for AGIs $100k-200k, 80.0% for AGIs over 200k)
Averages for the 2004 tax year for zip code 33786, filed in 2005:
Average Adjusted Gross Income (AGI) in 2004: $225,033 (Individual Income Tax Returns)
Here:
$225,033
State:
$50,523
Salary/wage: $102,865 (reported on 63.3% of returns)
Here:
$102,865
State:
$39,563
(% of AGI for various income ranges: 50.3% for AGIs $10k-25k, 54.8% for AGIs $25k-50k, 45.8% for AGIs $50k-75k, 53.2% for AGIs $75k-100k, 25.6% for AGIs over 100k)
Taxable interest for individuals: $7,039 (reported on 73.4% of returns)
This zip code:
$7,039
Florida:
$3,211
(% of AGI for various income ranges: 8.9% for AGIs $10k-25k, 4.0% for AGIs $25k-50k, 4.4% for AGIs $50k-75k, 2.7% for AGIs $75k-100k, 1.9% for AGIs over 100k)
Taxable dividends: $13,597 (reported on 56.9% of returns)
Here:
$13,597
State:
$6,129
(% of AGI for various income ranges: 6.0% for AGIs $10k-25k, 7.4% for AGIs $25k-50k, 6.3% for AGIs $50k-75k, 6.4% for AGIs $75k-100k, 2.9% for AGIs over 100k)
Net capital gain/loss: +$88,860 (reported on 56.0% of returns)
Here:
+$88,860
State:
+$27,205
(% of AGI for various income ranges: 0.0% for AGIs $10k-25k, -0.2% for AGIs $25k-50k, 4.5% for AGIs $50k-75k, 6.3% for AGIs $75k-100k, 23.9% for AGIs over 100k)
Profit/loss from business: +$13,033 (reported on 18.9% of returns)
Here:
+$13,033
State:
+$10,634
(% of AGI for various income ranges: 3.4% for AGIs $10k-25k, 5.7% for AGIs $25k-50k, 8.8% for AGIs $50k-75k, 0.8% for AGIs over 100k)
IRA payment deduction: $4,148 (reported on 3.3% of returns)
33786:
$4,148
Florida:
$3,082
Self-employed pension: $9,533 (reported on 1.9% of returns)
Here:
$9,533
Florida:
$15,857
Total itemized deductions: $37,510 (11% of AGI, reported on 56.9% of returns)
Here:
$37,510
State:
$20,370
Here:
10.7% of AGI
State:
20.7% of AGI
(% of AGI for various income ranges: 32.4% for AGIs $10k-25k, 26.9% for AGIs $25k-50k, 21.7% for AGIs $50k-75k, 19.6% for AGIs $75k-100k, 7.6% for AGIs over 100k)
Charity contributions deductions: $8,780 (2% of AGI, reported on 49.6% of returns)
Here:
$8,780
State:
$4,064
Here:
2.3% of AGI
State:
3.8% of AGI
(% of AGI for various income ranges: 3.8% for AGIs $10k-25k, 2.7% for AGIs $25k-50k, 2.7% for AGIs $50k-75k, 1.9% for AGIs $75k-100k, 1.8% for AGIs over 100k)
Total tax: $61,927 (reported on 79.8% of returns)
33786:
$61,927
State:
$9,431
(% of AGI for various income ranges: 3.6% for AGIs $10k-25k, 7.4% for AGIs $25k-50k, 9.5% for AGIs $50k-75k, 10.9% for AGIs $75k-100k, 23.0% for AGIs over 100k)
Earned income credit: $943 (reported on 4.3% of returns)
Here:
$943
State:
$1,808
Percentage of individuals using paid preparers for their 2004 taxes: 70.1%
Here:
70%
State:
60%
(% for various income ranges: 70.8% for AGIs below $10k, 60.9% for AGIs $10k-25k, 61.9% for AGIs $25k-50k, 62.4% for AGIs $50k-75k, 72.9% for AGIs $75k-100k, 79.5% for AGIs over 100k)
Parks in zip code 33786 include: Belle Isle Park and Strip (1), Morgan Street Beach Access (2), 25th Street Park (3), 19th Beach Access and Park (4), 20th Street Park (5), 16th Street Park (6), 12th Street Beach Access Park (7), Crossman Park (8), Bayside Park (9). Display/hide their locations on the map
Size of family households: 380 2-persons, 93 3-persons, 65 4-persons, 8 5-persons
Size of nonfamily households: 163 1-person, 23 2-persons, 10 3-persons
125 married couples with children.
38 single-parent households (12 men, 26 women).
87.9% of residents of 33786 zip code speak English at home.
3.4% of residents speak Spanish at home (56% very well, 44% well).
7.4% of residents speak other Indo-European language at home (72% very well, 18% well, 11% not well).
0.3% of residents speak Asian or Pacific Island language at home (60% very well, 40% well).
1.0% of residents speak other language at home (82% very well, 18% not well).
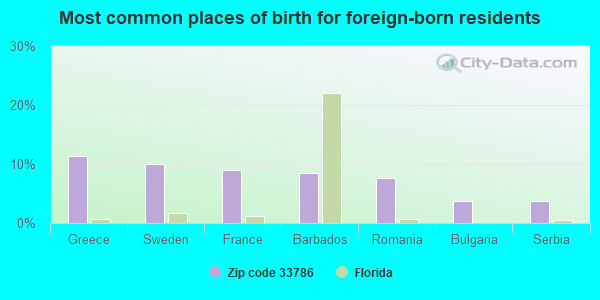
Foreign born population: 210 (13.0%) (79.2% of them are naturalized citizens)
This zip code:
13.0%
Whole state:
21.7%
11%Greece
10%Sweden
9%France
9%Barbados
8%Romania
4%Bulgaria
4%Serbia
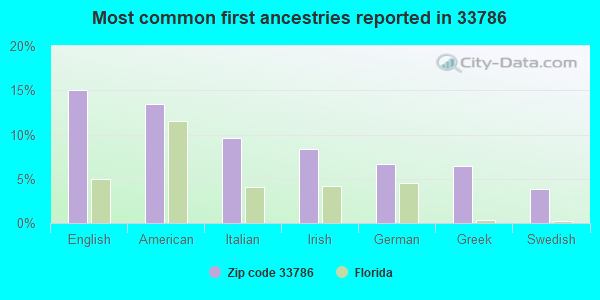
15%English
13%American
10%Italian
8%Irish
7%German
6%Greek
4%Swedish
Year of entry for the foreign-born population
342010 or later
162000 to 2009
261990 to 1999
129Before 1990
Housing units lacking complete plumbing facilities: 0.5% Housing units lacking complete kitchen facilities: 0.7%
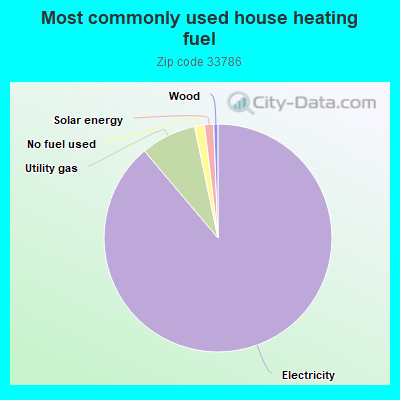
89.1%Electricity
7.9%Utility gas
1.4%No fuel used
1.3%Solar energy
0.6%Wood
Place of birth for U.S.-born residents:
This state: 235
Northeast: 440
Midwest: 334
South: 312
West: 85
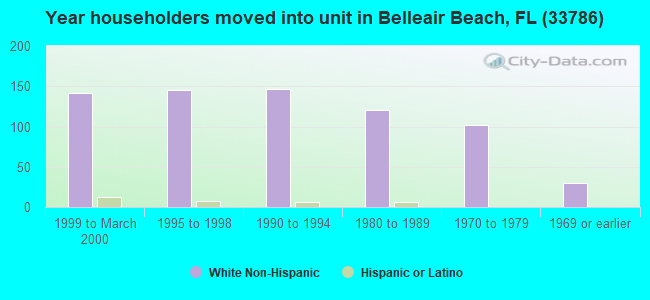
71% of the 33786 zip code residents lived in the same house 5 years ago. Out of people who lived in different houses, 37% lived in this county. Out of people who lived in different counties, 50% lived in Florida.
93% of the 33786 zip code residents lived in the same house 1 year ago. Out of people who lived in different houses, 20% moved from this county. Out of people who lived in different houses, 41% moved from different county within same state. Out of people who lived in different houses, 39% moved from different state. Out of people who lived in different houses, 8% moved from abroad.
Private vs. public school enrollment:
Students in private schools in grades 1 to 8 (elementary and middle school): 70
Here:
73.0%
Florida:
15.8%
Students in private schools in grades 9 to 12 (high school): 18
Here:
30.6%
Florida:
12.9%
Students in private undergraduate colleges: 6
Here:
24.5%
Florida:
23.6%
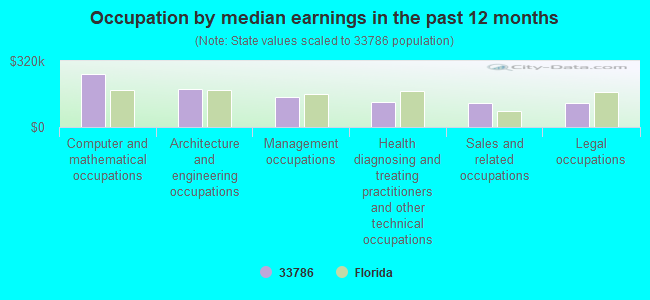
Occupation by median earnings in the past 12 months ($)
255,296Computer and mathematical occupations
183,519Architecture and engineering occupations
146,839Management occupations
123,066Health diagnosing and treating practitioners and other technical occupations
118,078Sales and related occupations
116,323Legal occupations
Top industries in this zip code by the number of employees in 2005:
Other Services (except Public Administration): Other Similar Organizations (except Business, Professional, Labor, and Political Organizations) (1-4 employees: 5 establishments)
Accommodation and Food Services: Hotels (except Casino Hotels) and Motels (5-9: 1)
Professional, Scientific, and Technical Services: Administrative Management and General Management Consulting Services (1-4: 2)
Real Estate and Rental and Leasing: Offices of Real Estate Agents and Brokers (1-4: 2)
Professional, Scientific, and Technical Services: Computer Systems Design Services (1-4: 2)
Professional, Scientific, and Technical Services: Other Accounting Services (1-4: 1)
Wholesale Trade: Computer and Computer Peripheral Equipment and Software Merchant Wholesalers (1-4: 1)
Other Services (except Public Administration): Beauty Salons (1-4: 1)
Finance and Insurance: Other Activities Related to Credit Intermediation (1-4: 1)
Home Mortgage Disclosure Act Aggregated Statistics For Year 2009 (Based on 2 partial tracts)
A) FHA, FSA/RHS & VA Home Purchase Loans
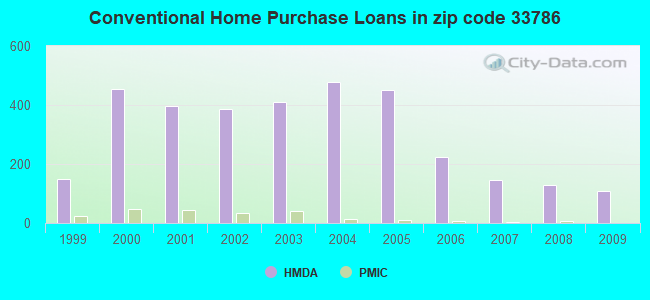
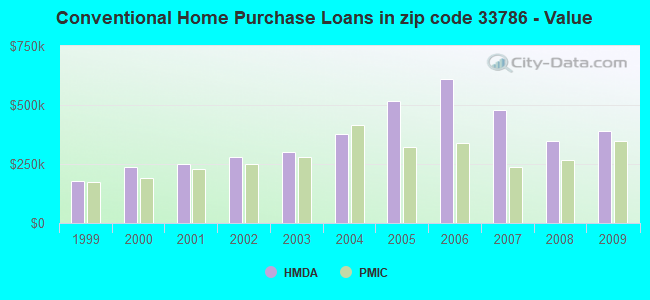
B) Conventional Home Purchase Loans
C) Refinancings
D) Home Improvement Loans
E) Loans on Dwellings For 5+ Families
F) Non-occupant Loans on < 5 Family Dwellings (A B C & D)
Number
Average Value
Number
Average Value
Number
Average Value
Number
Average Value
Number
Average Value
Number
Average Value
LOANS ORIGINATED
4
$334,112
109
$390,676
165
$269,408
6
$197,718
0
$0
156
$273,706
APPLICATIONS APPROVED, NOT ACCEPTED
0
$0
6
$316,893
16
$207,009
1
$23,790
1
$275,020
13
$224,820
APPLICATIONS DENIED
1
$327,050
24
$546,450
109
$371,268
4
$408,815
0
$0
65
$394,223
APPLICATIONS WITHDRAWN
0
$0
15
$319,322
54
$321,656
3
$413,273
0
$0
45
$311,856
FILES CLOSED FOR INCOMPLETENESS
0
$0
3
$464,810
12
$273,162
0
$0
0
$0
3
$246,280
Aggregated Statistics For Year 2008 (Based on 2 partial tracts)
A) FHA, FSA/RHS & VA Home Purchase Loans
B) Conventional Home Purchase Loans
C) Refinancings
D) Home Improvement Loans
E) Loans on Dwellings For 5+ Families
F) Non-occupant Loans on < 5 Family Dwellings (A B C & D)
Number
Average Value
Number
Average Value
Number
Average Value
Number
Average Value
Number
Average Value
Number
Average Value
LOANS ORIGINATED
3
$281,463
128
$348,735
97
$370,976
6
$562,678
0
$0
132
$322,694
APPLICATIONS APPROVED, NOT ACCEPTED
0
$0
15
$528,239
31
$258,573
3
$415,257
1
$222,990
25
$278,708
APPLICATIONS DENIED
0
$0
24
$446,166
83
$384,904
1
$499,500
0
$0
46
$344,374
APPLICATIONS WITHDRAWN
0
$0
18
$497,185
24
$465,925
0
$0
0
$0
21
$347,794
FILES CLOSED FOR INCOMPLETENESS
0
$0
6
$889,978
7
$341,281
0
$0
0
$0
6
$405,593
Aggregated Statistics For Year 2007 (Based on 2 partial tracts)
B) Conventional Home Purchase Loans
C) Refinancings
D) Home Improvement Loans
F) Non-occupant Loans on < 5 Family Dwellings (A B C & D)
Number
Average Value
Number
Average Value
Number
Average Value
Number
Average Value
LOANS ORIGINATED
146
$480,661
192
$435,914
13
$138,254
181
$409,595
APPLICATIONS APPROVED, NOT ACCEPTED
21
$295,550
46
$484,955
3
$88,203
24
$457,563
APPLICATIONS DENIED
34
$419,309
98
$502,107
18
$244,463
43
$422,540
APPLICATIONS WITHDRAWN
9
$464,314
40
$672,538
9
$275,021
10
$622,737
FILES CLOSED FOR INCOMPLETENESS
1
$1,278,480
16
$621,120
0
$0
0
$0
Aggregated Statistics For Year 2006 (Based on 2 partial tracts)
B) Conventional Home Purchase Loans
C) Refinancings
D) Home Improvement Loans
E) Loans on Dwellings For 5+ Families
F) Non-occupant Loans on < 5 Family Dwellings (A B C & D)
Number
Average Value
Number
Average Value
Number
Average Value
Number
Average Value
Number
Average Value
LOANS ORIGINATED
223
$611,213
288
$511,287
21
$231,768
3
$504,453
260
$525,079
APPLICATIONS APPROVED, NOT ACCEPTED
36
$506,352
43
$357,441
6
$375,118
0
$0
27
$370,494
APPLICATIONS DENIED
67
$620,800
89
$559,697
9
$229,101
0
$0
45
$756,283
APPLICATIONS WITHDRAWN
27
$370,384
82
$440,668
3
$130,327
0
$0
27
$399,896
FILES CLOSED FOR INCOMPLETENESS
7
$782,589
13
$344,434
0
$0
0
$0
3
$380,570
Aggregated Statistics For Year 2005 (Based on 2 partial tracts)
B) Conventional Home Purchase Loans
C) Refinancings
D) Home Improvement Loans
F) Non-occupant Loans on < 5 Family Dwellings (A B C & D)
G) Loans On Manufactured Home Dwelling (A B C & D)
Number
Average Value
Number
Average Value
Number
Average Value
Number
Average Value
Number
Average Value
LOANS ORIGINATED
450
$516,511
265
$374,169
22
$267,994
389
$445,128
1
$83,250
APPLICATIONS APPROVED, NOT ACCEPTED
42
$562,289
39
$324,879
0
$0
28
$431,645
0
$0
APPLICATIONS DENIED
106
$509,048
67
$375,710
16
$225,591
67
$481,747
0
$0
APPLICATIONS WITHDRAWN
51
$601,752
59
$456,638
4
$199,948
49
$496,100
0
$0
FILES CLOSED FOR INCOMPLETENESS
15
$854,002
37
$397,766
1
$1,062,920
19
$835,078
0
$0
Aggregated Statistics For Year 2004 (Based on 2 partial tracts)
B) Conventional Home Purchase Loans
C) Refinancings
D) Home Improvement Loans
F) Non-occupant Loans on < 5 Family Dwellings (A B C & D)
Number
Average Value
Number
Average Value
Number
Average Value
Number
Average Value
LOANS ORIGINATED
479
$376,429
287
$267,241
7
$142,714
418
$320,081
APPLICATIONS APPROVED, NOT ACCEPTED
39
$397,265
37
$240,387
10
$270,859
40
$359,832
APPLICATIONS DENIED
46
$358,400
88
$257,131
7
$147,173
59
$295,077
APPLICATIONS WITHDRAWN
34
$519,479
49
$277,873
6
$66,650
34
$397,447
FILES CLOSED FOR INCOMPLETENESS
6
$520,062
36
$311,649
1
$327,050
15
$329,529
Aggregated Statistics For Year 2003 (Based on 2 partial tracts)
A) FHA, FSA/RHS & VA Home Purchase Loans
B) Conventional Home Purchase Loans
C) Refinancings
D) Home Improvement Loans
F) Non-occupant Loans on < 5 Family Dwellings (A B C & D)
Number
Average Value
Number
Average Value
Number
Average Value
Number
Average Value
Number
Average Value
LOANS ORIGINATED
0
$0
410
$302,316
754
$240,873
16
$133,236
505
$251,047
APPLICATIONS APPROVED, NOT ACCEPTED
0
$0
30
$360,550
94
$168,081
9
$111,494
27
$224,862
APPLICATIONS DENIED
1
$475,710
39
$322,745
134
$289,920
13
$119,728
49
$300,718
APPLICATIONS WITHDRAWN
0
$0
31
$257,757
82
$209,266
0
$0
34
$220,366
FILES CLOSED FOR INCOMPLETENESS
0
$0
7
$271,410
31
$265,286
1
$356,780
15
$220,413
Aggregated Statistics For Year 2002 (Based on 2 partial tracts)
A) FHA, FSA/RHS & VA Home Purchase Loans
B) Conventional Home Purchase Loans
C) Refinancings
D) Home Improvement Loans
F) Non-occupant Loans on < 5 Family Dwellings (A B C & D)
Number
Average Value
Number
Average Value
Number
Average Value
Number
Average Value
Number
Average Value
LOANS ORIGINATED
1
$118,930
388
$281,393
517
$235,697
18
$88,205
346
$233,323
APPLICATIONS APPROVED, NOT ACCEPTED
0
$0
37
$353,369
61
$223,867
3
$22,300
34
$308,688
APPLICATIONS DENIED
0
$0
30
$321,254
128
$245,533
15
$266,399
36
$222,040
APPLICATIONS WITHDRAWN
0
$0
19
$304,988
49
$221,868
3
$54,510
15
$218,233
FILES CLOSED FOR INCOMPLETENESS
0
$0
9
$274,691
30
$228,490
0
$0
6
$175,418
Aggregated Statistics For Year 2001 (Based on 2 partial tracts)
B) Conventional Home Purchase Loans
C) Refinancings
D) Home Improvement Loans
F) Non-occupant Loans on < 5 Family Dwellings (A B C & D)
Number
Average Value
Number
Average Value
Number
Average Value
Number
Average Value
LOANS ORIGINATED
395
$249,482
446
$206,791
13
$59,007
333
$211,186
APPLICATIONS APPROVED, NOT ACCEPTED
28
$273,853
48
$144,417
7
$43,536
24
$256,872
APPLICATIONS DENIED
22
$260,358
80
$201,583
15
$89,691
28
$214,336
APPLICATIONS WITHDRAWN
31
$250,995
55
$190,852
6
$47,075
18
$236,452
FILES CLOSED FOR INCOMPLETENESS
6
$277,003
16
$259,876
1
$127,850
3
$250,740
Aggregated Statistics For Year 2000 (Based on 2 partial tracts)
A) FHA, FSA/RHS & VA Home Purchase Loans
B) Conventional Home Purchase Loans
C) Refinancings
D) Home Improvement Loans
E) Loans on Dwellings For 5+ Families
F) Non-occupant Loans on < 5 Family Dwellings (A B C & D)
Number
Average Value
Number
Average Value
Number
Average Value
Number
Average Value
Number
Average Value
Number
Average Value
LOANS ORIGINATED
4
$169,472
455
$237,673
83
$171,013
16
$113,168
0
$0
202
$206,115
APPLICATIONS APPROVED, NOT ACCEPTED
0
$0
37
$274,981
18
$204,490
10
$79,236
0
$0
15
$217,737
APPLICATIONS DENIED
0
$0
43
$252,065
71
$187,228
10
$104,062
1
$325,570
13
$204,007
APPLICATIONS WITHDRAWN
0
$0
40
$261,976
22
$95,075
7
$77,303
0
$0
16
$270,654
FILES CLOSED FOR INCOMPLETENESS
0
$0
13
$173,018
6
$121,902
0
$0
0
$0
6
$209,858
Aggregated Statistics For Year 1999 (Based on 1 partial tract)
A) FHA, FSA/RHS & VA Home Purchase Loans
B) Conventional Home Purchase Loans
C) Refinancings
D) Home Improvement Loans
F) Non-occupant Loans on < 5 Family Dwellings (A B C & D)


 Nearest zip codes: 33770, 33785, 33756, 33774, 33767, 33778.