Estimated zip code population in 2022: 6,550 Zip code population in 2010: 7,448 Zip code population in 2000: 7,274
Houses and condos: 2,130 Renter-occupied apartments: 570
% of renters here:
35%
State:
33%
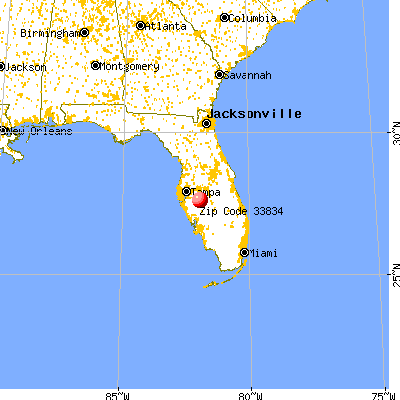
March 2022 cost of living index in zip code 33834: 71.8 (low, U.S. average is 100)
Land area: 180.1 sq. mi. Water area: 9.1 sq. mi.
Population density: 36 people per square mile
(very low).
OSM Map
General Map
Google Map
MSN Map
OSM Map
General Map
Google Map
MSN Map
OSM Map
General Map
Google Map
MSN Map
OSM Map
General Map
Google Map
MSN Map
Please wait while loading the map...
Real estate property taxes paid for housing units in 2022:
This zip code:
1.0% ($1,262)
Florida:
0.7% ($2,529)
Median real estate property taxes paid for housing units with mortgages in 2022: $1,836 (1.3%) Median real estate property taxes paid for housing units with no mortgage in 2022: $978 (1.0%)
Business Search- 14 Million verified businesses
Males: 4,084
(62.3%)
Females: 2,467
(37.7%)
For population 25 years and over in 33834:
High school or higher: 77.6%
Bachelor's degree or higher: 10.3%
Graduate or professional degree: 4.7%
Unemployed: 5.8%
Mean travel time to work (commute): 28.8 minutes
For population 15 years and over in 33834:
Never married: 41.7%
Now married: 39.8%
Separated: 1.6%
Widowed: 4.1%
Divorced: 12.9%
Zip code 33834 compared to state average:
Median house value significantly below state average.
Median age below state average.
Foreign-born population percentage significantly below state average.
Length of stay since moving in significantly above state average.
Percentage of population with a bachelor's degree or higher significantly below state average.
Estimated median house/condo value in 2022: $126,274
33834:
$126,274
Florida:
$354,100
According to our research of Florida and other state lists, there were 11 registered sex offenders living in 33834 zip code as of May 28, 2024. The ratio of all residents to sex offenders in zip code 33834 is 736 to 1. The ratio of registered sex offenders to all residents in this zip code is near the state average.
Median resident age:
This zip code:
35.3 years
Florida median age:
42.7 years
Average household size:
This zip code:
3.1 people
Florida:
2.5 people
Averages for the 2020 tax year for zip code 33834, filed in 2021:
Average Adjusted Gross Income (AGI) in 2020: $34,502 (Individual Income Tax Returns)
Here:
$34,502
State:
$82,200
Salary/wage: $35,877 (reported on 75.0% of returns)
Here:
$35,877
State:
$58,347
(% of AGI for various income ranges: 1428.9% for AGIs below $25k, 3914.2% for AGIs $25k-50k, 6743.2% for AGIs $50k-75k, 9285.0% for AGIs $75k-100k, 14510.0% for AGIs $100k-200k)
Taxable interest for individuals: $397 (reported on 24.2% of returns)
This zip code:
$397
Florida:
$4,272
(% of AGI for various income ranges: 6.5% for AGIs below $25k, 10.0% for AGIs $25k-50k, 19.5% for AGIs $50k-75k, 29.0% for AGIs $75k-100k, 77.8% for AGIs $100k-200k)
Ordinary dividends: $2,936 (reported on 4.5% of returns)
Here:
$2,936
State:
$15,863
(% of AGI for various income ranges: 10.1% for AGIs below $25k, 39.5% for AGIs $50k-75k, 195.6% for AGIs $100k-200k)
Net capital gain/loss in AGI: +$11,227 (reported on 4.5% of returns)
Here:
+$11,227
State:
+$62,983
(% of AGI for various income ranges: 16.8% for AGIs below $25k, 52.6% for AGIs $50k-75k, 1128.9% for AGIs $100k-200k)
Profit/loss from business: +$4,854 (reported on 10.7% of returns)
Here:
+$4,854
State:
+$9,719
(% of AGI for various income ranges: 105.6% for AGIs below $25k, 75.0% for AGIs $25k-50k, 57.4% for AGIs $50k-75k, 13.0% for AGIs $75k-100k)
Taxable individual retirement arrangement distribution: $15,509 (reported on 4.5% of returns)
33834:
$15,509
Florida:
$24,823
(% of AGI for various income ranges: 37.5% for AGIs below $25k, 46.7% for AGIs $25k-50k, 248.4% for AGIs $50k-75k, 805.6% for AGIs $100k-200k)
Total itemized deductions: $30,300 (reported on 2.0% of returns)
Here:
$30,300
State:
$45,393
(% of AGI for various income ranges: 797.4% for AGIs $50k-75k)
Charity contributions: $5,850 (reported on 1.6% of returns)
Here:
$5,850
State:
$20,178
(% of AGI for various income ranges: 123.2% for AGIs $50k-75k)
Taxes paid: $4,350 (reported on 1.6% of returns)
33834:
$4,350
State:
$6,967
(% of AGI for various income ranges: 91.6% for AGIs $50k-75k)
Earned income credit: $2,762 (reported on 26.2% of returns)
Here:
$2,762
State:
$2,306
(% of AGI for various income ranges: 166.6% for AGIs below $25k, 112.5% for AGIs $25k-50k)
Percentage of individuals using paid preparers for their 2020 taxes: 77.5%
Here:
77%
State:
92%
(% for various income ranges: 66.1% for AGIs below $25k, 89.2% for AGIs $25k-50k, 84.0% for AGIs $50k-75k, 100.0% for AGIs $75k-100k, 91.7% for AGIs $100k-200k, 100.0% for AGIs over 200k)
Averages for the 2012 tax year for zip code 33834, filed in 2013:
Average Adjusted Gross Income (AGI) in 2012: $34,384 (Individual Income Tax Returns)
Here:
$34,384
State:
$60,316
Salary/wage: $29,910 (reported on 89.2% of returns)
Here:
$29,910
State:
$45,277
(% of AGI for various income ranges: 87.9% for AGIs below $25k, 87.0% for AGIs $25k-50k, 84.5% for AGIs $50k-75k, 76.9% for AGIs $75k-100k, 51.4% for AGIs $100k-200k)
Taxable interest for individuals: $1,490 (reported on 14.8% of returns)
This zip code:
$1,490
Florida:
$3,587
(% of AGI for various income ranges: 0.6% for AGIs below $25k, 0.3% for AGIs $25k-50k, 1.1% for AGIs $50k-75k, 0.3% for AGIs $75k-100k, 1.0% for AGIs $100k-200k)
Ordinary dividends: $3,250 (reported on 5.9% of returns)
Here:
$3,250
State:
$12,831
(% of AGI for various income ranges: 0.6% for AGIs below $25k, 1.1% for AGIs $25k-50k, 0.5% for AGIs $75k-100k, 0.3% for AGIs $100k-200k)
Net capital gain/loss in AGI: +$8,583 (reported on 3.0% of returns)
Here:
+$8,583
State:
+$33,493
Profit/loss from business: +$5,570 (reported on 11.3% of returns)
Here:
+$5,570
State:
+$10,012
(% of AGI for various income ranges: 5.1% for AGIs below $25k, 1.6% for AGIs $25k-50k, 1.8% for AGIs $75k-100k)
Taxable individual retirement arrangement distribution: $13,764 (reported on 5.4% of returns)
33834:
$13,764
Florida:
$21,544
(% of AGI for various income ranges: 0.9% for AGIs below $25k, 3.5% for AGIs $25k-50k, 7.5% for AGIs $75k-100k)
Total itemized deductions: $18,833 (23% of AGI, reported on 8.9% of returns)
Here:
$18,833
State:
$25,533
Here:
23.4% of AGI
State:
18.0% of AGI
(% of AGI for various income ranges: 5.9% for AGIs $25k-50k, 4.7% for AGIs $50k-75k, 8.0% for AGIs $75k-100k, 6.8% for AGIs $100k-200k)
Charity contributions: $5,658 (reported on 5.9% of returns)
Here:
$5,658
State:
$5,698
(% of AGI for various income ranges: 0.6% for AGIs $25k-50k, 0.5% for AGIs $50k-75k, 2.0% for AGIs $75k-100k, 2.1% for AGIs $100k-200k)
Taxes paid: $3,612 (reported on 8.4% of returns)
33834:
$3,612
State:
$6,203
(% of AGI for various income ranges: 0.7% for AGIs $25k-50k, 1.4% for AGIs $50k-75k, 1.2% for AGIs $75k-100k, 1.4% for AGIs $100k-200k)
Earned income credit: $2,806 (reported on 32.5% of returns)
Here:
$2,806
State:
$2,372
(% of AGI for various income ranges: 9.4% for AGIs below $25k, 1.9% for AGIs $25k-50k)
Percentage of individuals using paid preparers for their 2012 taxes: 53.2%
Here:
53%
State:
54%
(% for various income ranges: 50.0% for AGIs below $25k, 53.1% for AGIs $25k-50k, 55.6% for AGIs $50k-75k, 66.7% for AGIs $75k-100k, 70.0% for AGIs $100k-200k)
Averages for the 2004 tax year for zip code 33834, filed in 2005:
Average Adjusted Gross Income (AGI) in 2004: $32,200 (Individual Income Tax Returns)
Here:
$32,200
State:
$50,523
Salary/wage: $29,568 (reported on 89.6% of returns)
Here:
$29,568
State:
$39,563
(% of AGI for various income ranges: 94.0% for AGIs below $10k, 83.8% for AGIs $10k-25k, 90.5% for AGIs $25k-50k, 84.3% for AGIs $50k-75k, 79.1% for AGIs $75k-100k, 42.6% for AGIs over 100k)
Taxable interest for individuals: $1,630 (reported on 24.9% of returns)
This zip code:
$1,630
Florida:
$3,211
(% of AGI for various income ranges: 5.1% for AGIs below $10k, 1.1% for AGIs $10k-25k, 1.0% for AGIs $25k-50k, 1.4% for AGIs $50k-75k, 0.4% for AGIs $75k-100k, 2.5% for AGIs over 100k)
Taxable dividends: $1,203 (reported on 7.9% of returns)
Here:
$1,203
State:
$6,129
(% of AGI for various income ranges: 0.3% for AGIs $10k-25k, 0.3% for AGIs $25k-50k, 0.3% for AGIs $50k-75k, 0.1% for AGIs $75k-100k, 0.4% for AGIs over 100k)
Net capital gain/loss: +$8,434 (reported on 7.0% of returns)
Here:
+$8,434
State:
+$27,205
(% of AGI for various income ranges: -0.3% for AGIs $10k-25k, 0.6% for AGIs $25k-50k, 1.6% for AGIs $50k-75k, 2.5% for AGIs $75k-100k, 11.6% for AGIs over 100k)
Profit/loss from business: +$7,531 (reported on 11.0% of returns)
Here:
+$7,531
State:
+$10,634
(% of AGI for various income ranges: 4.1% for AGIs below $10k, 6.2% for AGIs $10k-25k, 2.2% for AGIs $25k-50k, 0.4% for AGIs $50k-75k, 4.4% for AGIs $75k-100k)
IRA payment deduction: $1,933 (reported on 0.9% of returns)
33834:
$1,933
Florida:
$3,082
Total itemized deductions: $17,459 (30% of AGI, reported on 11.1% of returns)
Here:
$17,459
State:
$20,370
Here:
30.1% of AGI
State:
20.7% of AGI
(% of AGI for various income ranges: 4.2% for AGIs $10k-25k, 6.0% for AGIs $25k-50k, 6.3% for AGIs $50k-75k, 7.4% for AGIs $75k-100k, 8.5% for AGIs over 100k)
Charity contributions deductions: $4,957 (8% of AGI, reported on 7.9% of returns)
Here:
$4,957
State:
$4,064
Here:
8.1% of AGI
State:
3.8% of AGI
(% of AGI for various income ranges: 0.4% for AGIs $10k-25k, 0.8% for AGIs $25k-50k, 1.1% for AGIs $50k-75k, 2.6% for AGIs $75k-100k, 3.2% for AGIs over 100k)
Total tax: $3,817 (reported on 60.4% of returns)
33834:
$3,817
State:
$9,431
(% of AGI for various income ranges: 2.0% for AGIs below $10k, 2.9% for AGIs $10k-25k, 5.3% for AGIs $25k-50k, 7.9% for AGIs $50k-75k, 11.5% for AGIs $75k-100k, 17.1% for AGIs over 100k)
Earned income credit: $2,079 (reported on 31.3% of returns)
Here:
$2,079
State:
$1,808
Percentage of individuals using paid preparers for their 2004 taxes: 68.2%
Here:
68%
State:
60%
(% for various income ranges: 60.2% for AGIs below $10k, 74.6% for AGIs $10k-25k, 65.3% for AGIs $25k-50k, 67.5% for AGIs $50k-75k, 60.6% for AGIs $75k-100k, 76.5% for AGIs over 100k)
Household received Food Stamps/SNAP in the past 12 months: 477 Household did not receive Food Stamps/SNAP in the past 12 months: 1,135
Women who had a birth in the past 12 months: 134 (6 now married, 117 unmarried) Women who did not have a birth in the past 12 months: 918 (378 now married, 540 unmarried)
Housing units in zip code 33834 with a mortgage: 353 (7 second mortgage, 8 both second mortgage and home equity loan) Houses without a mortgage: 5
Median monthly owner costs for units with a mortgage: $913 Median monthly owner costs for units without a mortgage: $438
Residents with income below the poverty level in 2022:
This zip code:
26.7%
Whole state:
12.7%
Residents with income below 50% of the poverty level in 2022:
This zip code:
13.0%
Whole state:
6.6%
Median number of rooms in houses and condos:
Here:
5.4
State:
5.9
Median number of rooms in apartments:
Here:
4.6
State:
4.2
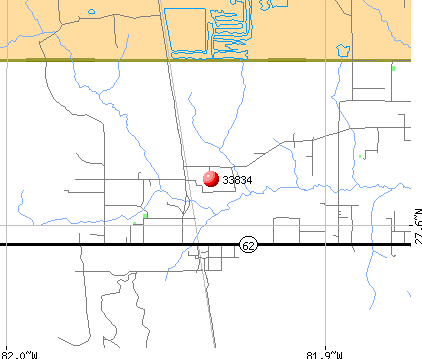
Notable locations in this zip code not listed on our city pages
Notable locations in zip code 33834: Boca Pointe Country Club (A), Garwood Railroad Station (B), Gardner Mine Railroad Station (C), Hardee County Fire Rescue Department Station 3 (D), Bowling Green Police Department (E), Hardee Correctional Institution Library (F), Hardee Correctional Institution (G). Display/hide their locations on the map
Churches in zip code 33834 include: Church of the Living God (A), Immanuel Baptist Church (B), Christian Bible Fellowship Church (C), Bowling Green Church of God (D), Payne Creek Church (E). Display/hide their locations on the map
Streams, rivers, and creeks: Little Payne Creek (A), Plunder Branch (B), Doe Branch (C), Coons Bay Branch (D), Olive Branch (E), Shirttail Branch (F), Hog Branch (G), Hickey Branch (H), Gum Swamp Branch (I). Display/hide their locations on the map
In group quarters: 1,522 (-1 institutionalized population)
Size of family households: 480 2-persons, 238 3-persons, 143 4-persons, 220 5-persons, 72 6-persons, 138 7-or-more-persons
Size of nonfamily households: 272 1-person, 44 2-persons, 43 6-persons
598 married couples with children.
491 single-parent households (26 men, 465 women).
69.2% of residents of 33834 zip code speak English at home.
26.9% of residents speak Spanish at home (63% very well, 17% well, 15% not well, 4% not at all).
2.4% of residents speak other Indo-European language at home (81% very well, 19% well).
0.5% of residents speak Asian or Pacific Island language at home (52% very well, 24% well, 24% not at all).
0.4% of residents speak other language at home (12% very well, 88% not at all).
Foreign born population: 580 (8.9%) (19.2% of them are naturalized citizens)
This zip code:
8.9%
Whole state:
21.7%
58%Honduras
8%Barbados
5%Guyana
4%Belize
3%Malaysia
3%Grenada
2%Chile
11%American
9%English
7%Irish
3%African
3%German
1%Haitian
1%Italian
Year of entry for the foreign-born population
3592010 or later
1032000 to 2009
1391990 to 1999
203Before 1990
Facilities with environmental interests located in this zip code:
HARDEE POWER STATION (6695 COUNTY ROAD 663 in BOWLING GREEN, FL)
AIR MAJOR (AIRS/AFS) AIR PROGRAM (Clean Air Markets Division Business System) CRITERIA AND HAZARDOUS AIR POLLUTANT INVENTORY (Inventory of air pollution sources) National Pollutant Discharge Elimination System MAJOR (Tracking pollutant discharge elimination systems) - permit National Pollutant Discharge Elimination System MAJOR (Tracking pollutant discharge elimination systems) - permit AIR MAJOR ("Best Available" air pollution technologies tracking) Small Quantity Generators, between 100 kg and 1000 kg of hazardous waste/month (Resource Conservation and Recovery Act (tracking hazardous waste)) - notification TRI REPORTER (Tracking of toxic chemicals releasing facilities) Business SIC classification: ELECTRIC SERVICES Organizations: JOHN DUFF (CONTACT/OWNER)
, GORDON GILLETTE, DIR (CONTACT/OWNER)
, HARDEE POWER PARTNERS (OWNER/OPERATOR)
Alternative names: HARDEE COUNTY GENERATION FACILITY, HARDEE POWER PARTNERS LTD., HARDEE POWER STA-TECO PWR STA, SEMINOLE ELECTRIC COOP., INC., SEMINOLE ELECTRIC HARDEE UNIT, SEMINOLE ELEC.- HARDEE UNIT 3, SEMINOLE HARDEE UNIT 3, TECO/HARDEE POWER SERVICES - HARDEE POWER STATION, TECO POWER SERVICES CORP., TECO/HARDEE POWER SERVICES - HARDEE POWER STATION
PAYNE CREEK GENERATING STATION (6697 COUNTY ROAD 663 in BOWLING GREEN, FL)
AIR PROGRAM (Clean Air Markets Division Business System) OIL CONTROL (Facility Response Plan for oil discharge) AIR MAJOR ("Best Available" air pollution technologies tracking) Small Quantity Generators, between 100 kg and 1000 kg of hazardous waste/month (Resource Conservation and Recovery Act (tracking hazardous waste)) - notification TRI REPORTER (Tracking of toxic chemicals releasing facilities) Business SIC classification: ELECTRIC SERVICES Organizations: SEMINOLE ELECTRIC COOPERATIVE, (CONTACT/GENERAL)
, SEMINOLE ELECTRIC COOP INC (CONTACT/OWNER)
, SEMINOLE ELECTRIC COOPERATIVE, INC. (OWNER/OPERATOR)
Alternative names: SECI PAYNE CREEK, SEMINOLE ELECTRIC COOP PAYNE CREEK GENERATING STAT, SEMINOLE ELECTRIC COOP PAYNE CREEK GENERATING STAT
GRAND RENTAL STATION (2693 US HWY 17 N in BOWLING GREEN, FL)
National Pollutant Discharge Elimination System NON-MAJOR (Tracking pollutant discharge elimination systems) - permit Organizations: STEVE SLOAN (CONTACT/OWNER)
MOODY CONSTRUCTION SERVICE INC (12450 SR 39 in DUETTE, FL)
(Resource Conservation and Recovery Act (tracking hazardous waste)) Organizations: MATTHEW MOODY OWNER (CONTACT/OWNER)
PAYNE CREEK PEAKING PROJECT (6697 CR 663 in BOWLING GREEN, FL)
National Pollutant Discharge Elimination System NON-MAJOR (Tracking pollutant discharge elimination systems) - permit Organizations: MIKE RODDY (CONTACT/OWNER)
PRESCO FOOD STORE #62 (4129 US HIGHWAY 17 NORTH in BOWLING GREEN, FL)
National Pollutant Discharge Elimination System NON-MAJOR (Tracking pollutant discharge elimination systems) - permit Organizations: DANE TERRELL (CONTACT/OWNER)
SPRUCE STREET SINGLE FAMILY HO ( in BOWLING GREEN, FL)
National Pollutant Discharge Elimination System NON-MAJOR (Tracking pollutant discharge elimination systems) - permit Organizations: GEORGE PAGE (CONTACT/OWNER)
CIRCLE K #7006 (US HWY 17 BETWEEN JONES in BOWLING GREEN, FL)
(Resource Conservation and Recovery Act (tracking hazardous waste)) Organizations: STEVE BELIN, COMPLIANCE MGR (CONTACT/OWNER)
CIRCLE K #7203 (US HWY 17 in BOWLING GREEN, FL)
(Resource Conservation and Recovery Act (tracking hazardous waste)) Organizations: STEVE BELIN, COMPLIANCE MGR (CONTACT/OWNER)
CLINTS AUTO REPAIR & RD SER (4413 CHESTER AVE S in BOWLING GREEN, FL)
(Resource Conservation and Recovery Act (tracking hazardous waste)) Business NAICS classification: GENERAL AUTOMOTIVE REPAIR. Organizations: CLIFFORD WALKER, OWNER (CONTACT/OWNER)
SEMINOLE ELECTRIC COOPERATIVE, INC. (6695 COUNTY ROAD 663 in BOWLING GREEN, FL)
AIR MAJOR (AIRS/AFS) CRITERIA AND HAZARDOUS AIR POLLUTANT INVENTORY (Inventory of air pollution sources) Business SIC classification: ELECTRIC SERVICES Alternative names: SEMINOLE ELECTRIC COOPERATIVE INC.
Housing units lacking complete plumbing facilities: 0.8% Housing units lacking complete kitchen facilities: 0.7%
90.1%Electricity
4.2%No fuel used
3.8%Bottled, tank, or LP gas
2.1%Utility gas
Population in 1990: 3,700. Population change in the 1990s: +3,574 (+96.6%).
Place of birth for U.S.-born residents:
This state: 4,108
Northeast: 401
Midwest: 508
South: 556
West: 131
54% of the 33834 zip code residents lived in the same house 5 years ago. Out of people who lived in different houses, 41% lived in this county. Out of people who lived in different counties, 50% lived in Florida.
83% of the 33834 zip code residents lived in the same house 1 year ago. Out of people who lived in different houses, 25% moved from this county. Out of people who lived in different houses, 63% moved from different county within same state. Out of people who lived in different houses, 9% moved from different state. Out of people who lived in different houses, 3% moved from abroad.
Private vs. public school enrollment:
Students in private schools in grades 1 to 8 (elementary and middle school): 63
Here:
9.2%
Florida:
15.8%
Students in private schools in grades 9 to 12 (high school): 7
Here:
2.3%
Florida:
12.9%
Students in private undergraduate colleges: 57
Here:
14.2%
Florida:
23.6%
Occupation by median earnings in the past 12 months ($)
68,658Health diagnosing and treating practitioners and other technical occupations
61,890Education, training, and library occupations
46,615Construction and extraction occupations
46,525Law enforcement workers including supervisors
44,185Installation, maintenance, and repair occupations
42,897Management occupations
Top industries in this zip code by the number of employees in 2005:
Mining: Phosphate Rock Mining (100-249 employees: 1 establishment)
Health Care and Social Assistance: Child Day Care Services (20-49: 1, 10-19: 1, 5-9: 1)
Utilities: Fossil Fuel Electric Power Generation (20-49: 1)
Wholesale Trade: Fresh Fruit and Vegetable Merchant Wholesalers (10-19: 1, 5-9: 1, 1-4: 1)
Other Services (except Public Administration): Religious Organizations (5-9: 1, 1-4: 6)
Accommodation and Food Services: Food Service Contractors (10-19: 1)
People in group quarters in 2010:
1,616 people in state prisons
28 people in nursing facilities/skilled-nursing facilities
11 people in group homes intended for adults
10 people in residential treatment centers for adults
People in group quarters in 2000:
1,255 people in state prisons
29 people in homes or halfway houses for drug/alcohol abuse
28 people in agriculture workers' dormitories on farms
21 people in other nonhousehold living situations
6 people in homes for the mentally ill
6 people in homes for the mentally retarded
Fatal accident statistics in 2014:
Fatal accident count: 1
Vehicles involved in fatal accidents: 1
Fatal accidents caused by drunken drivers: 0
Fatalities: 1
Persons involved in fatal accidents: 1
Pedestrians involved in fatal accidents: 0
Fatal accident statistics in 2013:
Fatal accident count: 1
Vehicles involved in fatal accidents: 1
Fatal accidents caused by drunken drivers: 1
Fatalities: 2
Persons involved in fatal accidents: 3
Pedestrians involved in fatal accidents: 0
Home Mortgage Disclosure Act Aggregated Statistics For Year 2009 (Based on 4 partial tracts)
A) FHA, FSA/RHS & VA Home Purchase Loans
B) Conventional Home Purchase Loans
C) Refinancings
D) Home Improvement Loans
F) Non-occupant Loans on < 5 Family Dwellings (A B C & D)
G) Loans On Manufactured Home Dwelling (A B C & D)
Number
Average Value
Number
Average Value
Number
Average Value
Number
Average Value
Number
Average Value
Number
Average Value
LOANS ORIGINATED
111
$183,917
79
$178,178
107
$204,311
3
$87,340
18
$142,027
10
$121,622
APPLICATIONS APPROVED, NOT ACCEPTED
4
$167,732
5
$225,962
17
$221,796
2
$21,575
1
$118,000
2
$96,605
APPLICATIONS DENIED
28
$177,328
12
$192,692
64
$219,587
8
$82,894
12
$190,783
4
$81,708
APPLICATIONS WITHDRAWN
7
$150,919
16
$194,011
43
$207,771
3
$168,120
5
$211,580
2
$95,195
FILES CLOSED FOR INCOMPLETENESS
4
$265,720
1
$161,740
8
$232,370
0
$0
0
$0
0
$0
Aggregated Statistics For Year 2008 (Based on 4 partial tracts)
A) FHA, FSA/RHS & VA Home Purchase Loans
B) Conventional Home Purchase Loans
C) Refinancings
D) Home Improvement Loans
F) Non-occupant Loans on < 5 Family Dwellings (A B C & D)
G) Loans On Manufactured Home Dwelling (A B C & D)
Number
Average Value
Number
Average Value
Number
Average Value
Number
Average Value
Number
Average Value
Number
Average Value
LOANS ORIGINATED
107
$206,483
124
$211,428
82
$207,780
10
$130,933
26
$178,268
10
$93,699
APPLICATIONS APPROVED, NOT ACCEPTED
2
$185,005
17
$253,115
22
$212,767
0
$0
2
$181,795
5
$119,654
APPLICATIONS DENIED
19
$170,135
26
$181,033
100
$247,372
15
$129,494
9
$184,926
17
$115,803
APPLICATIONS WITHDRAWN
8
$190,210
17
$369,621
39
$239,383
3
$46,327
2
$186,245
3
$106,663
FILES CLOSED FOR INCOMPLETENESS
2
$198,135
2
$257,055
20
$258,709
3
$193,440
1
$136,490
0
$0
Aggregated Statistics For Year 2007 (Based on 4 partial tracts)
A) FHA, FSA/RHS & VA Home Purchase Loans
B) Conventional Home Purchase Loans
C) Refinancings
D) Home Improvement Loans
F) Non-occupant Loans on < 5 Family Dwellings (A B C & D)
G) Loans On Manufactured Home Dwelling (A B C & D)
Number
Average Value
Number
Average Value
Number
Average Value
Number
Average Value
Number
Average Value
Number
Average Value
LOANS ORIGINATED
26
$253,172
266
$247,990
175
$231,416
27
$122,013
48
$254,584
21
$159,848
APPLICATIONS APPROVED, NOT ACCEPTED
2
$212,030
32
$290,936
53
$258,450
5
$42,256
11
$424,284
4
$117,880
APPLICATIONS DENIED
5
$211,110
56
$244,672
138
$275,618
21
$150,764
17
$221,911
21
$116,760
APPLICATIONS WITHDRAWN
0
$0
35
$236,105
55
$261,188
9
$169,471
7
$291,471
4
$163,600
FILES CLOSED FOR INCOMPLETENESS
0
$0
7
$201,874
26
$269,794
2
$83,215
7
$251,030
1
$44,030
Aggregated Statistics For Year 2006 (Based on 4 partial tracts)
A) FHA, FSA/RHS & VA Home Purchase Loans
B) Conventional Home Purchase Loans
C) Refinancings
D) Home Improvement Loans
F) Non-occupant Loans on < 5 Family Dwellings (A B C & D)
G) Loans On Manufactured Home Dwelling (A B C & D)
Number
Average Value
Number
Average Value
Number
Average Value
Number
Average Value
Number
Average Value
Number
Average Value
LOANS ORIGINATED
7
$245,306
347
$239,114
231
$259,897
27
$126,966
58
$260,550
21
$122,597
APPLICATIONS APPROVED, NOT ACCEPTED
0
$0
56
$207,530
56
$246,951
6
$96,598
14
$266,381
6
$122,422
APPLICATIONS DENIED
1
$236,880
75
$210,337
118
$259,269
25
$156,354
11
$273,135
20
$122,904
APPLICATIONS WITHDRAWN
0
$0
55
$233,451
82
$229,976
15
$98,773
12
$309,196
4
$94,715
FILES CLOSED FOR INCOMPLETENESS
0
$0
19
$242,025
26
$224,647
1
$74,850
2
$250,345
2
$141,775
Aggregated Statistics For Year 2005 (Based on 4 partial tracts)
A) FHA, FSA/RHS & VA Home Purchase Loans
B) Conventional Home Purchase Loans
C) Refinancings
D) Home Improvement Loans
F) Non-occupant Loans on < 5 Family Dwellings (A B C & D)
G) Loans On Manufactured Home Dwelling (A B C & D)
Number
Average Value
Number
Average Value
Number
Average Value
Number
Average Value
Number
Average Value
Number
Average Value
LOANS ORIGINATED
4
$168,265
465
$224,166
202
$218,788
27
$121,133
125
$217,969
26
$112,198
APPLICATIONS APPROVED, NOT ACCEPTED
2
$159,390
65
$239,173
38
$196,976
7
$74,576
11
$207,045
6
$151,250
APPLICATIONS DENIED
2
$138,650
77
$232,918
113
$214,079
33
$106,010
22
$209,900
15
$127,825
APPLICATIONS WITHDRAWN
1
$216,980
49
$226,232
73
$225,660
10
$159,825
10
$202,291
9
$102,592
FILES CLOSED FOR INCOMPLETENESS
0
$0
19
$190,945
38
$202,139
1
$176,310
5
$214,554
3
$105,737
Aggregated Statistics For Year 2004 (Based on 4 partial tracts)
A) FHA, FSA/RHS & VA Home Purchase Loans
B) Conventional Home Purchase Loans
C) Refinancings
D) Home Improvement Loans
F) Non-occupant Loans on < 5 Family Dwellings (A B C & D)
G) Loans On Manufactured Home Dwelling (A B C & D)
Number
Average Value
Number
Average Value
Number
Average Value
Number
Average Value
Number
Average Value
Number
Average Value
LOANS ORIGINATED
17
$166,368
399
$182,756
149
$165,541
19
$64,504
63
$196,460
23
$109,525
APPLICATIONS APPROVED, NOT ACCEPTED
0
$0
52
$181,501
33
$156,423
4
$28,358
8
$195,022
5
$89,278
APPLICATIONS DENIED
2
$123,005
64
$177,324
83
$179,000
15
$53,217
10
$138,078
15
$119,539
APPLICATIONS WITHDRAWN
2
$159,790
34
$208,112
51
$166,178
6
$82,725
4
$173,918
4
$89,878
FILES CLOSED FOR INCOMPLETENESS
0
$0
18
$211,005
30
$170,804
0
$0
4
$168,415
5
$104,944
Aggregated Statistics For Year 2003 (Based on 4 partial tracts)
A) FHA, FSA/RHS & VA Home Purchase Loans
B) Conventional Home Purchase Loans
C) Refinancings
D) Home Improvement Loans
F) Non-occupant Loans on < 5 Family Dwellings (A B C & D)
Number
Average Value
Number
Average Value
Number
Average Value
Number
Average Value
Number
Average Value
LOANS ORIGINATED
19
$136,656
194
$162,455
250
$139,354
13
$61,677
18
$189,071
APPLICATIONS APPROVED, NOT ACCEPTED
1
$95,270
31
$161,856
32
$130,572
4
$22,530
5
$170,654
APPLICATIONS DENIED
1
$28,280
20
$151,585
113
$129,720
15
$25,180
4
$106,285
APPLICATIONS WITHDRAWN
3
$125,513
12
$100,955
42
$142,092
2
$16,730
2
$77,935
FILES CLOSED FOR INCOMPLETENESS
0
$0
7
$201,944
7
$186,420
2
$30,820
3
$161,737
Aggregated Statistics For Year 2002 (Based on 2 partial tracts)
C) Refinancings
Number
Average Value
LOANS ORIGINATED
1
$72,230
APPLICATIONS APPROVED, NOT ACCEPTED
0
$0
APPLICATIONS DENIED
0
$0
APPLICATIONS WITHDRAWN
0
$0
FILES CLOSED FOR INCOMPLETENESS
0
$0
Aggregated Statistics For Year 2001 (Based on 2 partial tracts)
B) Conventional Home Purchase Loans
C) Refinancings
Number
Average Value
Number
Average Value
LOANS ORIGINATED
1
$97,380
1
$64,450
APPLICATIONS APPROVED, NOT ACCEPTED
0
$0
0
$0
APPLICATIONS DENIED
0
$0
0
$0
APPLICATIONS WITHDRAWN
0
$0
0
$0
FILES CLOSED FOR INCOMPLETENESS
0
$0
0
$0
Aggregated Statistics For Year 2000 (Based on 2 partial tracts)
B) Conventional Home Purchase Loans
Number
Average Value
LOANS ORIGINATED
1
$101,480
APPLICATIONS APPROVED, NOT ACCEPTED
0
$0
APPLICATIONS DENIED
0
$0
APPLICATIONS WITHDRAWN
0
$0
FILES CLOSED FOR INCOMPLETENESS
0
$0
Aggregated Statistics For Year 1999 (Based on 2 partial tracts)
A) FHA, FSA/RHS & VA Home Purchase Loans
B) Conventional Home Purchase Loans
C) Refinancings
D) Home Improvement Loans
F) Non-occupant Loans on < 5 Family Dwellings (A B C & D)
Detailed PMIC statistics for the following Tracts:0019.05
, 0139.03
2003 - 2018 National Fire Incident Reporting System (NFIRS) incidents
According to the data from the years 2003 - 2018 the average number of fires per year is 30. The highest number of reported fires - 60 took place in 2009, and the least - 2 in 2015. The data has a rising trend.
When looking into fire subcategories, the most reports belonged to: Outside Fires (73.3%), and Structure Fires (14.4%).
Fire incident types reported to NFIRS in Zip Code 33834


 Nearest zip codes: 33860, 33865, 33547, 33873, 33847, 33841.


 According to the data from the years 2003 - 2018 the average number of fires per year is 30. The highest number of reported fires - 60 took place in 2009, and the least - 2 in 2015. The data has a rising trend.
 When looking into fire subcategories, the most reports belonged to: Outside Fires (73.3%), and Structure Fires (14.4%).