Estimated zip code population in 2022: 31,434
Zip code population in 2010: 20,628
Zip code population in 2000: 4,117
Houses and condos: 12,100
Renter-occupied apartments: 1,675
% of renters here:
15%State:
33%
March 2022 cost of living index in zip code 33993: 92.6
(less than average, U.S. average is 100)
Land area: 61.1
sq. mi.
Water area: 14.4
sq. mi.
Population density: 515 people per square mile (low).
OSM Map
General Map
Google Map
MSN Map
OSM Map
General Map
Google Map
MSN Map
OSM Map
General Map
Google Map
MSN Map
OSM Map
General Map
Google Map
MSN Map
Please wait while loading the map...
Real estate property taxes paid for housing units in 2022:
This zip code:
0.8% ($2,833)Florida:
0.7% ($2,529)
Median real estate property taxes paid for housing units with mortgages in 2022: $2,838 (0.8%)
Median real estate property taxes paid for housing units with no mortgage in 2022: $2,804 (0.8%)
Profiles of local businesses
Business Search - 14 Million verified businesses
Males: 15,776 Females: 15,658
For population 25 years and over in 33993:
High school or higher: 89.1%Bachelor's degree or higher: 22.9%Graduate or professional degree: 8.6%Unemployed: 3.3%Mean travel time to work (commute): 32.1 minutes
For population 15 years and over in 33993:
Never married: 25.8%Now married: 55.0%Separated: 1.6%Widowed: 5.4%Divorced: 12.2%
Zip code 33993 compared to state average:
Black race population percentage below state average. Renting percentage below state average. Length of stay since moving in significantly below state average. House age significantly below state average. Percentage of population with a bachelor's degree or higher below state average. 19,371 61.6% White 8,434 26.8% Hispanic or Latino 1,692 5.4% Black 776 2.5% Asian 681 2.2% Two or more races 452 1.4% Some other race 14 0.04% Native Hawaiian and Other 11 0.03% American Indian
Data:
Median household income ($)
Median household income (% change since 2000)
Household income diversity
Ratio of average income to average house value (%)
Ratio of average income to average rent
Median household income ($) - White
Median household income ($) - Black or African American
Median household income ($) - Asian
Median household income ($) - Hispanic or Latino
Median household income ($) - American Indian and Alaska Native
Median household income ($) - Multirace
Median household income ($) - Other Race
Median household income for houses/condos with a mortgage ($)
Median household income for apartments without a mortgage ($)
Races - White alone (%)
Races - White alone (% change since 2000)
Races - Black alone (%)
Races - Black alone (% change since 2000)
Races - American Indian alone (%)
Races - American Indian alone (% change since 2000)
Races - Asian alone (%)
Races - Asian alone (% change since 2000)
Races - Hispanic (%)
Races - Hispanic (% change since 2000)
Races - Native Hawaiian and Other Pacific Islander alone (%)
Races - Native Hawaiian and Other Pacific Islander alone (% change since 2000)
Races - Two or more races (%)
Races - Two or more races (% change since 2000)
Races - Other race alone (%)
Races - Other race alone (% change since 2000)
Racial diversity
Unemployment (%)
Unemployment (% change since 2000)
Unemployment (%) - White
Unemployment (%) - Black or African American
Unemployment (%) - Asian
Unemployment (%) - Hispanic or Latino
Unemployment (%) - American Indian and Alaska Native
Unemployment (%) - Multirace
Unemployment (%) - Other Race
Population density (people per square mile)
Population - Males (%)
Population - Females (%)
Population - Males (%) - White
Population - Males (%) - Black or African American
Population - Males (%) - Asian
Population - Males (%) - Hispanic or Latino
Population - Males (%) - American Indian and Alaska Native
Population - Males (%) - Multirace
Population - Males (%) - Other Race
Population - Females (%) - White
Population - Females (%) - Black or African American
Population - Females (%) - Asian
Population - Females (%) - Hispanic or Latino
Population - Females (%) - American Indian and Alaska Native
Population - Females (%) - Multirace
Population - Females (%) - Other Race
Coronavirus confirmed cases (May 28, 2024)
Deaths caused by coronavirus (May 28, 2024)
Coronavirus confirmed cases (per 100k population) (May 28, 2024)
Deaths caused by coronavirus (per 100k population) (May 28, 2024)
Daily increase in number of cases (May 28, 2024)
Weekly increase in number of cases (May 28, 2024)
Cases doubled (in days) (May 28, 2024)
Hospitalized patients (Apr 18, 2022)
Negative test results (Apr 18, 2022)
Total test results (Apr 18, 2022)
COVID Vaccine doses distributed (per 100k population) (Sep 19, 2023)
COVID Vaccine doses administered (per 100k population) (Sep 19, 2023)
COVID Vaccine doses distributed (Sep 19, 2023)
COVID Vaccine doses administered (Sep 19, 2023)
Likely homosexual households (%)
Likely homosexual households (% change since 2000)
Likely homosexual households - Lesbian couples (%)
Likely homosexual households - Lesbian couples (% change since 2000)
Likely homosexual households - Gay men (%)
Likely homosexual households - Gay men (% change since 2000)
Cost of living index
Median gross rent ($)
Median contract rent ($)
Median monthly housing costs ($)
Median house or condo value ($)
Median house or condo value ($ change since 2000)
Mean house or condo value by units in structure - 1, detached ($)
Mean house or condo value by units in structure - 1, attached ($)
Mean house or condo value by units in structure - 2 ($)
Mean house or condo value by units in structure by units in structure - 3 or 4 ($)
Mean house or condo value by units in structure - 5 or more ($)
Mean house or condo value by units in structure - Boat, RV, van, etc. ($)
Mean house or condo value by units in structure - Mobile home ($)
Median house or condo value ($) - White
Median house or condo value ($) - Black or African American
Median house or condo value ($) - Asian
Median house or condo value ($) - Hispanic or Latino
Median house or condo value ($) - American Indian and Alaska Native
Median house or condo value ($) - Multirace
Median house or condo value ($) - Other Race
Median resident age
Resident age diversity
Median resident age - Males
Median resident age - Females
Median resident age - White
Median resident age - Black or African American
Median resident age - Asian
Median resident age - Hispanic or Latino
Median resident age - American Indian and Alaska Native
Median resident age - Multirace
Median resident age - Other Race
Median resident age - Males - White
Median resident age - Males - Black or African American
Median resident age - Males - Asian
Median resident age - Males - Hispanic or Latino
Median resident age - Males - American Indian and Alaska Native
Median resident age - Males - Multirace
Median resident age - Males - Other Race
Median resident age - Females - White
Median resident age - Females - Black or African American
Median resident age - Females - Asian
Median resident age - Females - Hispanic or Latino
Median resident age - Females - American Indian and Alaska Native
Median resident age - Females - Multirace
Median resident age - Females - Other Race
Commute - mean travel time to work (minutes)
Travel time to work - Less than 5 minutes (%)
Travel time to work - Less than 5 minutes (% change since 2000)
Travel time to work - 5 to 9 minutes (%)
Travel time to work - 5 to 9 minutes (% change since 2000)
Travel time to work - 10 to 19 minutes (%)
Travel time to work - 10 to 19 minutes (% change since 2000)
Travel time to work - 20 to 29 minutes (%)
Travel time to work - 20 to 29 minutes (% change since 2000)
Travel time to work - 30 to 39 minutes (%)
Travel time to work - 30 to 39 minutes (% change since 2000)
Travel time to work - 40 to 59 minutes (%)
Travel time to work - 40 to 59 minutes (% change since 2000)
Travel time to work - 60 to 89 minutes (%)
Travel time to work - 60 to 89 minutes (% change since 2000)
Travel time to work - 90 or more minutes (%)
Travel time to work - 90 or more minutes (% change since 2000)
Marital status - Never married (%)
Marital status - Now married (%)
Marital status - Separated (%)
Marital status - Widowed (%)
Marital status - Divorced (%)
Median family income ($)
Median family income (% change since 2000)
Median non-family income ($)
Median non-family income (% change since 2000)
Median per capita income ($)
Median per capita income (% change since 2000)
Median family income ($) - White
Median family income ($) - Black or African American
Median family income ($) - Asian
Median family income ($) - Hispanic or Latino
Median family income ($) - American Indian and Alaska Native
Median family income ($) - Multirace
Median family income ($) - Other Race
Median year house/condo built
Median year apartment built
Year house built - Built 2005 or later (%)
Year house built - Built 2000 to 2004 (%)
Year house built - Built 1990 to 1999 (%)
Year house built - Built 1980 to 1989 (%)
Year house built - Built 1970 to 1979 (%)
Year house built - Built 1960 to 1969 (%)
Year house built - Built 1950 to 1959 (%)
Year house built - Built 1940 to 1949 (%)
Year house built - Built 1939 or earlier (%)
Average household size
Household density (households per square mile)
Average household size - White
Average household size - Black or African American
Average household size - Asian
Average household size - Hispanic or Latino
Average household size - American Indian and Alaska Native
Average household size - Multirace
Average household size - Other Race
Occupied housing units (%)
Vacant housing units (%)
Owner occupied housing units (%)
Renter occupied housing units (%)
Vacancy status - For rent (%)
Vacancy status - For sale only (%)
Vacancy status - Rented or sold, not occupied (%)
Vacancy status - For seasonal, recreational, or occasional use (%)
Vacancy status - For migrant workers (%)
Vacancy status - Other vacant (%)
Residents with income below the poverty level (%)
Residents with income below 50% of the poverty level (%)
Children below poverty level (%)
Poor families by family type - Married-couple family (%)
Poor families by family type - Male, no wife present (%)
Poor families by family type - Female, no husband present (%)
Poverty status for native-born residents (%)
Poverty status for foreign-born residents (%)
Poverty among high school graduates not in families (%)
Poverty among people who did not graduate high school not in families (%)
Residents with income below the poverty level (%) - White
Residents with income below the poverty level (%) - Black or African American
Residents with income below the poverty level (%) - Asian
Residents with income below the poverty level (%) - Hispanic or Latino
Residents with income below the poverty level (%) - American Indian and Alaska Native
Residents with income below the poverty level (%) - Multirace
Residents with income below the poverty level (%) - Other Race
Air pollution - Air Quality Index (AQI)
Air pollution - CO
Air pollution - NO2
Air pollution - SO2
Air pollution - Ozone
Air pollution - PM10
Air pollution - PM25
Air pollution - Pb
Crime - Murders per 100,000 population
Crime - Rapes per 100,000 population
Crime - Robberies per 100,000 population
Crime - Assaults per 100,000 population
Crime - Burglaries per 100,000 population
Crime - Thefts per 100,000 population
Crime - Auto thefts per 100,000 population
Crime - Arson per 100,000 population
Crime - City-data.com crime index
Crime - Violent crime index
Crime - Property crime index
Crime - Murders per 100,000 population (5 year average)
Crime - Rapes per 100,000 population (5 year average)
Crime - Robberies per 100,000 population (5 year average)
Crime - Assaults per 100,000 population (5 year average)
Crime - Burglaries per 100,000 population (5 year average)
Crime - Thefts per 100,000 population (5 year average)
Crime - Auto thefts per 100,000 population (5 year average)
Crime - Arson per 100,000 population (5 year average)
Crime - City-data.com crime index (5 year average)
Crime - Violent crime index (5 year average)
Crime - Property crime index (5 year average)
1996 Presidential Elections Results (%) - Democratic Party (Clinton)
1996 Presidential Elections Results (%) - Republican Party (Dole)
1996 Presidential Elections Results (%) - Other
2000 Presidential Elections Results (%) - Democratic Party (Gore)
2000 Presidential Elections Results (%) - Republican Party (Bush)
2000 Presidential Elections Results (%) - Other
2004 Presidential Elections Results (%) - Democratic Party (Kerry)
2004 Presidential Elections Results (%) - Republican Party (Bush)
2004 Presidential Elections Results (%) - Other
2008 Presidential Elections Results (%) - Democratic Party (Obama)
2008 Presidential Elections Results (%) - Republican Party (McCain)
2008 Presidential Elections Results (%) - Other
2012 Presidential Elections Results (%) - Democratic Party (Obama)
2012 Presidential Elections Results (%) - Republican Party (Romney)
2012 Presidential Elections Results (%) - Other
2016 Presidential Elections Results (%) - Democratic Party (Clinton)
2016 Presidential Elections Results (%) - Republican Party (Trump)
2016 Presidential Elections Results (%) - Other
2020 Presidential Elections Results (%) - Democratic Party (Biden)
2020 Presidential Elections Results (%) - Republican Party (Trump)
2020 Presidential Elections Results (%) - Other
Ancestries Reported - Arab (%)
Ancestries Reported - Czech (%)
Ancestries Reported - Danish (%)
Ancestries Reported - Dutch (%)
Ancestries Reported - English (%)
Ancestries Reported - French (%)
Ancestries Reported - French Canadian (%)
Ancestries Reported - German (%)
Ancestries Reported - Greek (%)
Ancestries Reported - Hungarian (%)
Ancestries Reported - Irish (%)
Ancestries Reported - Italian (%)
Ancestries Reported - Lithuanian (%)
Ancestries Reported - Norwegian (%)
Ancestries Reported - Polish (%)
Ancestries Reported - Portuguese (%)
Ancestries Reported - Russian (%)
Ancestries Reported - Scotch-Irish (%)
Ancestries Reported - Scottish (%)
Ancestries Reported - Slovak (%)
Ancestries Reported - Subsaharan African (%)
Ancestries Reported - Swedish (%)
Ancestries Reported - Swiss (%)
Ancestries Reported - Ukrainian (%)
Ancestries Reported - United States (%)
Ancestries Reported - Welsh (%)
Ancestries Reported - West Indian (%)
Ancestries Reported - Other (%)
Educational Attainment - No schooling completed (%)
Educational Attainment - Less than high school (%)
Educational Attainment - High school or equivalent (%)
Educational Attainment - Less than 1 year of college (%)
Educational Attainment - 1 or more years of college (%)
Educational Attainment - Associate degree (%)
Educational Attainment - Bachelor's degree (%)
Educational Attainment - Master's degree (%)
Educational Attainment - Professional school degree (%)
Educational Attainment - Doctorate degree (%)
School Enrollment - Nursery, preschool (%)
School Enrollment - Kindergarten (%)
School Enrollment - Grade 1 to 4 (%)
School Enrollment - Grade 5 to 8 (%)
School Enrollment - Grade 9 to 12 (%)
School Enrollment - College undergrad (%)
School Enrollment - Graduate or professional (%)
School Enrollment - Not enrolled in school (%)
School enrollment - Public schools (%)
School enrollment - Private schools (%)
School enrollment - Not enrolled (%)
Median number of rooms in houses and condos
Median number of rooms in apartments
Housing units lacking complete plumbing facilities (%)
Housing units lacking complete kitchen facilities (%)
Density of houses
Urban houses (%)
Rural houses (%)
Households with people 60 years and over (%)
Households with people 65 years and over (%)
Households with people 75 years and over (%)
Households with one or more nonrelatives (%)
Households with no nonrelatives (%)
Population in households (%)
Family households (%)
Nonfamily households (%)
Population in families (%)
Family households with own children (%)
Median number of bedrooms in owner occupied houses
Mean number of bedrooms in owner occupied houses
Median number of bedrooms in renter occupied houses
Mean number of bedrooms in renter occupied houses
Median number of vehichles in owner occupied houses
Mean number of vehichles in owner occupied houses
Median number of vehichles in renter occupied houses
Mean number of vehichles in renter occupied houses
Mortgage status - with mortgage (%)
Mortgage status - with second mortgage (%)
Mortgage status - with home equity loan (%)
Mortgage status - with both second mortgage and home equity loan (%)
Mortgage status - without a mortgage (%)
Average family size
Average family size - White
Average family size - Black or African American
Average family size - Asian
Average family size - Hispanic or Latino
Average family size - American Indian and Alaska Native
Average family size - Multirace
Average family size - Other Race
Geographical mobility - Same house 1 year ago (%)
Geographical mobility - Moved within same county (%)
Geographical mobility - Moved from different county within same state (%)
Geographical mobility - Moved from different state (%)
Geographical mobility - Moved from abroad (%)
Place of birth - Born in state of residence (%)
Place of birth - Born in other state (%)
Place of birth - Native, outside of US (%)
Place of birth - Foreign born (%)
Housing units in structures - 1, detached (%)
Housing units in structures - 1, attached (%)
Housing units in structures - 2 (%)
Housing units in structures - 3 or 4 (%)
Housing units in structures - 5 to 9 (%)
Housing units in structures - 10 to 19 (%)
Housing units in structures - 20 to 49 (%)
Housing units in structures - 50 or more (%)
Housing units in structures - Mobile home (%)
Housing units in structures - Boat, RV, van, etc. (%)
House/condo owner moved in on average (years ago)
Renter moved in on average (years ago)
Year householder moved into unit - Moved in 1999 to March 2000 (%)
Year householder moved into unit - Moved in 1995 to 1998 (%)
Year householder moved into unit - Moved in 1990 to 1994 (%)
Year householder moved into unit - Moved in 1980 to 1989 (%)
Year householder moved into unit - Moved in 1970 to 1979 (%)
Year householder moved into unit - Moved in 1969 or earlier (%)
Means of transportation to work - Drove car alone (%)
Means of transportation to work - Carpooled (%)
Means of transportation to work - Public transportation (%)
Means of transportation to work - Bus or trolley bus (%)
Means of transportation to work - Streetcar or trolley car (%)
Means of transportation to work - Subway or elevated (%)
Means of transportation to work - Railroad (%)
Means of transportation to work - Ferryboat (%)
Means of transportation to work - Taxicab (%)
Means of transportation to work - Motorcycle (%)
Means of transportation to work - Bicycle (%)
Means of transportation to work - Walked (%)
Means of transportation to work - Other means (%)
Working at home (%)
Industry diversity
Most Common Industries - Agriculture, forestry, fishing and hunting, and mining (%)
Most Common Industries - Agriculture, forestry, fishing and hunting (%)
Most Common Industries - Mining, quarrying, and oil and gas extraction (%)
Most Common Industries - Construction (%)
Most Common Industries - Manufacturing (%)
Most Common Industries - Wholesale trade (%)
Most Common Industries - Retail trade (%)
Most Common Industries - Transportation and warehousing, and utilities (%)
Most Common Industries - Transportation and warehousing (%)
Most Common Industries - Utilities (%)
Most Common Industries - Information (%)
Most Common Industries - Finance and insurance, and real estate and rental and leasing (%)
Most Common Industries - Finance and insurance (%)
Most Common Industries - Real estate and rental and leasing (%)
Most Common Industries - Professional, scientific, and management, and administrative and waste management services (%)
Most Common Industries - Professional, scientific, and technical services (%)
Most Common Industries - Management of companies and enterprises (%)
Most Common Industries - Administrative and support and waste management services (%)
Most Common Industries - Educational services, and health care and social assistance (%)
Most Common Industries - Educational services (%)
Most Common Industries - Health care and social assistance (%)
Most Common Industries - Arts, entertainment, and recreation, and accommodation and food services (%)
Most Common Industries - Arts, entertainment, and recreation (%)
Most Common Industries - Accommodation and food services (%)
Most Common Industries - Other services, except public administration (%)
Most Common Industries - Public administration (%)
Occupation diversity
Most Common Occupations - Management, business, science, and arts occupations (%)
Most Common Occupations - Management, business, and financial occupations (%)
Most Common Occupations - Management occupations (%)
Most Common Occupations - Business and financial operations occupations (%)
Most Common Occupations - Computer, engineering, and science occupations (%)
Most Common Occupations - Computer and mathematical occupations (%)
Most Common Occupations - Architecture and engineering occupations (%)
Most Common Occupations - Life, physical, and social science occupations (%)
Most Common Occupations - Education, legal, community service, arts, and media occupations (%)
Most Common Occupations - Community and social service occupations (%)
Most Common Occupations - Legal occupations (%)
Most Common Occupations - Education, training, and library occupations (%)
Most Common Occupations - Arts, design, entertainment, sports, and media occupations (%)
Most Common Occupations - Healthcare practitioners and technical occupations (%)
Most Common Occupations - Health diagnosing and treating practitioners and other technical occupations (%)
Most Common Occupations - Health technologists and technicians (%)
Most Common Occupations - Service occupations (%)
Most Common Occupations - Healthcare support occupations (%)
Most Common Occupations - Protective service occupations (%)
Most Common Occupations - Fire fighting and prevention, and other protective service workers including supervisors (%)
Most Common Occupations - Law enforcement workers including supervisors (%)
Most Common Occupations - Food preparation and serving related occupations (%)
Most Common Occupations - Building and grounds cleaning and maintenance occupations (%)
Most Common Occupations - Personal care and service occupations (%)
Most Common Occupations - Sales and office occupations (%)
Most Common Occupations - Sales and related occupations (%)
Most Common Occupations - Office and administrative support occupations (%)
Most Common Occupations - Natural resources, construction, and maintenance occupations (%)
Most Common Occupations - Farming, fishing, and forestry occupations (%)
Most Common Occupations - Construction and extraction occupations (%)
Most Common Occupations - Installation, maintenance, and repair occupations (%)
Most Common Occupations - Production, transportation, and material moving occupations (%)
Most Common Occupations - Production occupations (%)
Most Common Occupations - Transportation occupations (%)
Most Common Occupations - Material moving occupations (%)
People in Group quarters - Institutionalized population (%)
People in Group quarters - Correctional institutions (%)
People in Group quarters - Federal prisons and detention centers (%)
People in Group quarters - Halfway houses (%)
People in Group quarters - Local jails and other confinement facilities (including police lockups) (%)
People in Group quarters - Military disciplinary barracks (%)
People in Group quarters - State prisons (%)
People in Group quarters - Other types of correctional institutions (%)
People in Group quarters - Nursing homes (%)
People in Group quarters - Hospitals/wards, hospices, and schools for the handicapped (%)
People in Group quarters - Hospitals/wards and hospices for chronically ill (%)
People in Group quarters - Hospices or homes for chronically ill (%)
People in Group quarters - Military hospitals or wards for chronically ill (%)
People in Group quarters - Other hospitals or wards for chronically ill (%)
People in Group quarters - Hospitals or wards for drug/alcohol abuse (%)
People in Group quarters - Mental (Psychiatric) hospitals or wards (%)
People in Group quarters - Schools, hospitals, or wards for the mentally retarded (%)
People in Group quarters - Schools, hospitals, or wards for the physically handicapped (%)
People in Group quarters - Institutions for the deaf (%)
People in Group quarters - Institutions for the blind (%)
People in Group quarters - Orthopedic wards and institutions for the physically handicapped (%)
People in Group quarters - Wards in general hospitals for patients who have no usual home elsewhere (%)
People in Group quarters - Wards in military hospitals for patients who have no usual home elsewhere (%)
People in Group quarters - Juvenile institutions (%)
People in Group quarters - Long-term care (%)
People in Group quarters - Homes for abused, dependent, and neglected children (%)
People in Group quarters - Residential treatment centers for emotionally disturbed children (%)
People in Group quarters - Training schools for juvenile delinquents (%)
People in Group quarters - Short-term care, detention or diagnostic centers for delinquent children (%)
People in Group quarters - Type of juvenile institution unknown (%)
People in Group quarters - Noninstitutionalized population (%)
People in Group quarters - College dormitories (includes college quarters off campus) (%)
People in Group quarters - Military quarters (%)
People in Group quarters - On base (%)
People in Group quarters - Barracks, unaccompanied personnel housing (UPH), (Enlisted/Officer), ;and similar group living quarters for military personnel (%)
People in Group quarters - Transient quarters for temporary residents (%)
People in Group quarters - Military ships (%)
People in Group quarters - Group homes (%)
People in Group quarters - Homes or halfway houses for drug/alcohol abuse (%)
People in Group quarters - Homes for the mentally ill (%)
People in Group quarters - Homes for the mentally retarded (%)
People in Group quarters - Homes for the physically handicapped (%)
People in Group quarters - Other group homes (%)
People in Group quarters - Religious group quarters (%)
People in Group quarters - Dormitories (%)
People in Group quarters - Agriculture workers' dormitories on farms (%)
People in Group quarters - Job Corps and vocational training facilities (%)
People in Group quarters - Other workers' dormitories (%)
People in Group quarters - Crews of maritime vessels (%)
People in Group quarters - Other nonhousehold living situations (%)
People in Group quarters - Other noninstitutional group quarters (%)
Residents speaking English at home (%)
Residents speaking English at home - Born in the United States (%)
Residents speaking English at home - Native, born elsewhere (%)
Residents speaking English at home - Foreign born (%)
Residents speaking Spanish at home (%)
Residents speaking Spanish at home - Born in the United States (%)
Residents speaking Spanish at home - Native, born elsewhere (%)
Residents speaking Spanish at home - Foreign born (%)
Residents speaking other language at home (%)
Residents speaking other language at home - Born in the United States (%)
Residents speaking other language at home - Native, born elsewhere (%)
Residents speaking other language at home - Foreign born (%)
Class of Workers - Employee of private company (%)
Class of Workers - Self-employed in own incorporated business (%)
Class of Workers - Private not-for-profit wage and salary workers (%)
Class of Workers - Local government workers (%)
Class of Workers - State government workers (%)
Class of Workers - Federal government workers (%)
Class of Workers - Self-employed workers in own not incorporated business and Unpaid family workers (%)
House heating fuel used in houses and condos - Utility gas (%)
House heating fuel used in houses and condos - Bottled, tank, or LP gas (%)
House heating fuel used in houses and condos - Electricity (%)
House heating fuel used in houses and condos - Fuel oil, kerosene, etc. (%)
House heating fuel used in houses and condos - Coal or coke (%)
House heating fuel used in houses and condos - Wood (%)
House heating fuel used in houses and condos - Solar energy (%)
House heating fuel used in houses and condos - Other fuel (%)
House heating fuel used in houses and condos - No fuel used (%)
House heating fuel used in apartments - Utility gas (%)
House heating fuel used in apartments - Bottled, tank, or LP gas (%)
House heating fuel used in apartments - Electricity (%)
House heating fuel used in apartments - Fuel oil, kerosene, etc. (%)
House heating fuel used in apartments - Coal or coke (%)
House heating fuel used in apartments - Wood (%)
House heating fuel used in apartments - Solar energy (%)
House heating fuel used in apartments - Other fuel (%)
House heating fuel used in apartments - No fuel used (%)
Armed forces status - In Armed Forces (%)
Armed forces status - Civilian (%)
Armed forces status - Civilian - Veteran (%)
Armed forces status - Civilian - Nonveteran (%)
Fatal accidents locations in years 2005-2021
Fatal accidents locations in 2005
Fatal accidents locations in 2006
Fatal accidents locations in 2007
Fatal accidents locations in 2008
Fatal accidents locations in 2009
Fatal accidents locations in 2010
Fatal accidents locations in 2011
Fatal accidents locations in 2012
Fatal accidents locations in 2013
Fatal accidents locations in 2014
Fatal accidents locations in 2015
Fatal accidents locations in 2016
Fatal accidents locations in 2017
Fatal accidents locations in 2018
Fatal accidents locations in 2019
Fatal accidents locations in 2020
Fatal accidents locations in 2021
Alcohol use - People drinking some alcohol every month (%)
Alcohol use - People not drinking at all (%)
Alcohol use - Average days/month drinking alcohol
Alcohol use - Average drinks/week
Alcohol use - Average days/year people drink much
Audiometry - Average condition of hearing (%)
Audiometry - People that can hear a whisper from across a quiet room (%)
Audiometry - People that can hear normal voice from across a quiet room (%)
Audiometry - Ears ringing, roaring, buzzing (%)
Audiometry - Had a job exposure to loud noise (%)
Audiometry - Had off-work exposure to loud noise (%)
Blood Pressure & Cholesterol - Has high blood pressure (%)
Blood Pressure & Cholesterol - Checking blood pressure at home (%)
Blood Pressure & Cholesterol - Frequently checking blood cholesterol (%)
Blood Pressure & Cholesterol - Has high cholesterol level (%)
Consumer Behavior - Money monthly spent on food at supermarket/grocery store
Consumer Behavior - Money monthly spent on food at other stores
Consumer Behavior - Money monthly spent on eating out
Consumer Behavior - Money monthly spent on carryout/delivered foods
Consumer Behavior - Income spent on food at supermarket/grocery store (%)
Consumer Behavior - Income spent on food at other stores (%)
Consumer Behavior - Income spent on eating out (%)
Consumer Behavior - Income spent on carryout/delivered foods (%)
Current Health Status - General health condition (%)
Current Health Status - Blood donors (%)
Current Health Status - Has blood ever tested for HIV virus (%)
Current Health Status - Left-handed people (%)
Dermatology - People using sunscreen (%)
Diabetes - Diabetics (%)
Diabetes - Had a blood test for high blood sugar (%)
Diabetes - People taking insulin (%)
Diet Behavior & Nutrition - Diet health (%)
Diet Behavior & Nutrition - Milk product consumption (# of products/month)
Diet Behavior & Nutrition - Meals not home prepared (#/week)
Diet Behavior & Nutrition - Meals from fast food or pizza place (#/week)
Diet Behavior & Nutrition - Ready-to-eat foods (#/month)
Diet Behavior & Nutrition - Frozen meals/pizza (#/month)
Drug Use - People that ever used marijuana or hashish (%)
Drug Use - Ever used hard drugs (%)
Drug Use - Ever used any form of cocaine (%)
Drug Use - Ever used heroin (%)
Drug Use - Ever used methamphetamine (%)
Health Insurance - People covered by health insurance (%)
Kidney Conditions-Urology - Avg. # of times urinating at night
Medical Conditions - People with asthma (%)
Medical Conditions - People with anemia (%)
Medical Conditions - People with psoriasis (%)
Medical Conditions - People with overweight (%)
Medical Conditions - Elderly people having difficulties in thinking or remembering (%)
Medical Conditions - People who ever received blood transfusion (%)
Medical Conditions - People having trouble seeing even with glass/contacts (%)
Medical Conditions - People with arthritis (%)
Medical Conditions - People with gout (%)
Medical Conditions - People with congestive heart failure (%)
Medical Conditions - People with coronary heart disease (%)
Medical Conditions - People with angina pectoris (%)
Medical Conditions - People who ever had heart attack (%)
Medical Conditions - People who ever had stroke (%)
Medical Conditions - People with emphysema (%)
Medical Conditions - People with thyroid problem (%)
Medical Conditions - People with chronic bronchitis (%)
Medical Conditions - People with any liver condition (%)
Medical Conditions - People who ever had cancer or malignancy (%)
Mental Health - People who have little interest in doing things (%)
Mental Health - People feeling down, depressed, or hopeless (%)
Mental Health - People who have trouble sleeping or sleeping too much (%)
Mental Health - People feeling tired or having little energy (%)
Mental Health - People with poor appetite or overeating (%)
Mental Health - People feeling bad about themself (%)
Mental Health - People who have trouble concentrating on things (%)
Mental Health - People moving or speaking slowly or too fast (%)
Mental Health - People having thoughts they would be better off dead (%)
Oral Health - Average years since last visit a dentist
Oral Health - People embarrassed because of mouth (%)
Oral Health - People with gum disease (%)
Oral Health - General health of teeth and gums (%)
Oral Health - Average days a week using dental floss/device
Oral Health - Average days a week using mouthwash for dental problem
Oral Health - Average number of teeth
Pesticide Use - Households using pesticides to control insects (%)
Pesticide Use - Households using pesticides to kill weeds (%)
Physical Activity - People doing vigorous-intensity work activities (%)
Physical Activity - People doing moderate-intensity work activities (%)
Physical Activity - People walking or bicycling (%)
Physical Activity - People doing vigorous-intensity recreational activities (%)
Physical Activity - People doing moderate-intensity recreational activities (%)
Physical Activity - Average hours a day doing sedentary activities
Physical Activity - Average hours a day watching TV or videos
Physical Activity - Average hours a day using computer
Physical Functioning - People having limitations keeping them from working (%)
Physical Functioning - People limited in amount of work they can do (%)
Physical Functioning - People that need special equipment to walk (%)
Physical Functioning - People experiencing confusion/memory problems (%)
Physical Functioning - People requiring special healthcare equipment (%)
Prescription Medications - Average number of prescription medicines taking
Preventive Aspirin Use - Adults 40+ taking low-dose aspirin (%)
Reproductive Health - Vaginal deliveries (%)
Reproductive Health - Cesarean deliveries (%)
Reproductive Health - Deliveries resulted in a live birth (%)
Reproductive Health - Pregnancies resulted in a delivery (%)
Reproductive Health - Women breastfeeding newborns (%)
Reproductive Health - Women that had a hysterectomy (%)
Reproductive Health - Women that had both ovaries removed (%)
Reproductive Health - Women that have ever taken birth control pills (%)
Reproductive Health - Women taking birth control pills (%)
Reproductive Health - Women that have ever used Depo-Provera or injectables (%)
Reproductive Health - Women that have ever used female hormones (%)
Sexual Behavior - People 18+ that ever had sex (vaginal, anal, or oral) (%)
Sexual Behavior - Males 18+ that ever had vaginal sex with a woman (%)
Sexual Behavior - Males 18+ that ever performed oral sex on a woman (%)
Sexual Behavior - Males 18+ that ever had anal sex with a woman (%)
Sexual Behavior - Males 18+ that ever had any sex with a man (%)
Sexual Behavior - Females 18+ that ever had vaginal sex with a man (%)
Sexual Behavior - Females 18+ that ever performed oral sex on a man (%)
Sexual Behavior - Females 18+ that ever had anal sex with a man (%)
Sexual Behavior - Females 18+ that ever had any kind of sex with a woman (%)
Sexual Behavior - Average age people first had sex
Sexual Behavior - Average number of female sex partners in lifetime (males 18+)
Sexual Behavior - Average number of female vaginal sex partners in lifetime (males 18+)
Sexual Behavior - Average age people first performed oral sex on a woman (18+)
Sexual Behavior - Average number of woman performed oral sex on in lifetime (18+)
Sexual Behavior - Average number of male sex partners in lifetime (males 18+)
Sexual Behavior - Average number of male anal sex partners in lifetime (males 18+)
Sexual Behavior - Average age people first performed oral sex on a man (18+)
Sexual Behavior - Average number of male oral sex partners in lifetime (18+)
Sexual Behavior - People using protection when performing oral sex (%)
Sexual Behavior - Average number of times people have vaginal or anal sex a year
Sexual Behavior - People having sex without condom (%)
Sexual Behavior - Average number of male sex partners in lifetime (females 18+)
Sexual Behavior - Average number of male vaginal sex partners in lifetime (females 18+)
Sexual Behavior - Average number of female sex partners in lifetime (females 18+)
Sexual Behavior - Circumcised males 18+ (%)
Sleep Disorders - Average hours sleeping at night
Sleep Disorders - People that has trouble sleeping (%)
Smoking-Cigarette Use - People smoking cigarettes (%)
Taste & Smell - People 40+ having problems with smell (%)
Taste & Smell - People 40+ having problems with taste (%)
Taste & Smell - People 40+ that ever had wisdom teeth removed (%)
Taste & Smell - People 40+ that ever had tonsils teeth removed (%)
Taste & Smell - People 40+ that ever had a loss of consciousness because of a head injury (%)
Taste & Smell - People 40+ that ever had a broken nose or other serious injury to face or skull (%)
Taste & Smell - People 40+ that ever had two or more sinus infections (%)
Weight - Average height (inches)
Weight - Average weight (pounds)
Weight - Average BMI
Weight - People that are obese (%)
Weight - People that ever were obese (%)
Weight - People trying to lose weight (%)
Urban population: 8,322
Rural population: 23,111
Estimated median house/condo value in 2022: $351,313
33993:
$351,313Florida:
$354,100
According to our research of Florida and other state lists, there were 45 registered sex offenders living in 33993 zip code as of May 28, 2024 . The ratio of all residents to sex offenders in zip code 33993 is 525 to 1.The ratio of registered sex offenders to all residents in this zip code is near the state average.
Median resident age: This zip code:
42.9 yearsFlorida median age:
42.7 years
Average household size: This zip code:
2.9 peopleFlorida:
2.5 people
Averages for the 2020 tax year for zip code 33993, filed in 2021:
Average Adjusted Gross Income (AGI) in 2020: $59,712 (Individual Income Tax Returns) Here:
$59,712State:
$82,200
Salary/wage: $50,304 (reported on 79.5% of returns )Here:
$50,304State:
$58,347
(% of AGI for various income ranges: 1113.6% for AGIs below $25k , 3487.7% for AGIs $25k-50k , 6369.7% for AGIs $50k-75k , 9215.8% for AGIs $75k-100k , 16782.2% for AGIs $100k-200k , 57001.4% for AGIs over 200k ) Taxable interest for individuals: $1,569 (reported on 20.7% of returns )This zip code:
$1,569Florida:
$4,272
(% of AGI for various income ranges: 13.8% for AGIs below $25k , 13.4% for AGIs $25k-50k , 26.9% for AGIs $50k-75k , 39.6% for AGIs $75k-100k , 132.2% for AGIs $100k-200k , 1348.6% for AGIs over 200k ) Ordinary dividends: $4,862 (reported on 13.1% of returns )(% of AGI for various income ranges: 14.2% for AGIs below $25k , 29.7% for AGIs $25k-50k , 55.1% for AGIs $50k-75k , 97.8% for AGIs $75k-100k , 257.8% for AGIs $100k-200k , 2718.6% for AGIs over 200k ) Net capital gain/loss in AGI: +$24,423 (reported on 13.4% of returns )Here:
+$24,423State:
+$62,983
(% of AGI for various income ranges: 6.6% for AGIs below $25k , 28.4% for AGIs $25k-50k , 70.4% for AGIs $50k-75k , 193.2% for AGIs $75k-100k , 620.1% for AGIs $100k-200k , 29727.1% for AGIs over 200k ) Profit/loss from business: +$10,356 (reported on 22.7% of returns )Here:
+$10,356State:
+$9,719
(% of AGI for various income ranges: 275.7% for AGIs below $25k , 260.8% for AGIs $25k-50k , 240.7% for AGIs $50k-75k , 398.7% for AGIs $75k-100k , 526.0% for AGIs $100k-200k , 2396.4% for AGIs over 200k ) Taxable individual retirement arrangement distribution: $23,620 (reported on 7.4% of returns )33993:
$23,620Florida:
$24,823
(% of AGI for various income ranges: 42.7% for AGIs below $25k , 77.4% for AGIs $25k-50k , 165.4% for AGIs $50k-75k , 316.1% for AGIs $75k-100k , 885.9% for AGIs $100k-200k , 5566.4% for AGIs over 200k ) Total itemized deductions: $27,992 (reported on 6.1% of returns )Here:
$27,992State:
$45,393
(% of AGI for various income ranges: 43.4% for AGIs below $25k , 112.8% for AGIs $25k-50k , 245.2% for AGIs $50k-75k , 368.8% for AGIs $75k-100k , 689.1% for AGIs $100k-200k , 4220.7% for AGIs over 200k ) Charity contributions: $6,542 (reported on 4.5% of returns )(% of AGI for various income ranges: 1.4% for AGIs below $25k , 11.5% for AGIs $25k-50k , 31.4% for AGIs $50k-75k , 56.8% for AGIs $75k-100k , 115.9% for AGIs $100k-200k , 1322.9% for AGIs over 200k ) Taxes paid: $6,678 (reported on 5.9% of returns )(% of AGI for various income ranges: 7.5% for AGIs below $25k , 26.4% for AGIs $25k-50k , 53.0% for AGIs $50k-75k , 81.7% for AGIs $75k-100k , 182.2% for AGIs $100k-200k , 945.7% for AGIs over 200k ) Earned income credit: $2,382 (reported on 20.9% of returns )(% of AGI for various income ranges: 126.1% for AGIs below $25k , 84.6% for AGIs $25k-50k , 1.5% for AGIs $50k-75k ) Percentage of individuals using paid preparers for their 2020 taxes: 93.5%(% for various income ranges: 92.3% for AGIs below $25k , 94.3% for AGIs $25k-50k , 93.3% for AGIs $50k-75k , 94.4% for AGIs $75k-100k , 93.8% for AGIs $100k-200k , 95.7% for AGIs over 200k )
Averages for the 2012 tax year for zip code 33993, filed in 2013:
Average Adjusted Gross Income (AGI) in 2012: $43,706 (Individual Income Tax Returns) Here:
$43,706State:
$60,316
Salary/wage: $38,206 (reported on 81.6% of returns )Here:
$38,206State:
$45,277
(% of AGI for various income ranges: 70.6% for AGIs below $25k , 80.4% for AGIs $25k-50k , 75.8% for AGIs $50k-75k , 74.8% for AGIs $75k-100k , 68.5% for AGIs $100k-200k , 39.3% for AGIs over 200k ) Taxable interest for individuals: $1,511 (reported on 22.1% of returns )This zip code:
$1,511Florida:
$3,587
(% of AGI for various income ranges: 1.0% for AGIs below $25k , 0.5% for AGIs $25k-50k , 0.5% for AGIs $50k-75k , 0.3% for AGIs $75k-100k , 0.9% for AGIs $100k-200k , 2.0% for AGIs over 200k ) Ordinary dividends: $4,388 (reported on 13.3% of returns )(% of AGI for various income ranges: 2.3% for AGIs below $25k , 1.1% for AGIs $25k-50k , 1.0% for AGIs $50k-75k , 0.9% for AGIs $75k-100k , 1.0% for AGIs $100k-200k , 2.8% for AGIs over 200k ) Net capital gain/loss in AGI: +$7,285 (reported on 10.5% of returns )Here:
+$7,285State:
+$33,493
(% of AGI for various income ranges: 0.2% for AGIs $25k-50k , 0.2% for AGIs $50k-75k , 0.6% for AGIs $75k-100k , 1.7% for AGIs $100k-200k , 13.9% for AGIs over 200k ) Profit/loss from business: +$10,426 (reported on 18.5% of returns )Here:
+$10,426State:
+$10,012
(% of AGI for various income ranges: 12.7% for AGIs below $25k , 4.1% for AGIs $25k-50k , 2.0% for AGIs $50k-75k , 1.6% for AGIs $75k-100k , 2.2% for AGIs $100k-200k , 9.1% for AGIs over 200k ) Taxable individual retirement arrangement distribution: $16,344 (reported on 7.9% of returns )33993:
$16,344Florida:
$21,544
(% of AGI for various income ranges: 2.3% for AGIs below $25k , 2.0% for AGIs $25k-50k , 2.9% for AGIs $50k-75k , 3.4% for AGIs $75k-100k , 3.8% for AGIs $100k-200k , 4.0% for AGIs over 200k ) Total itemized deductions: $19,143 (25% of AGI, reported on 24.0% of returns )Here:
$19,143State:
$25,533
Here:
25.1% of AGIState:
18.0% of AGI
(% of AGI for various income ranges: 9.3% for AGIs below $25k , 9.3% for AGIs $25k-50k , 11.6% for AGIs $50k-75k , 10.6% for AGIs $75k-100k , 12.2% for AGIs $100k-200k , 8.9% for AGIs over 200k ) Charity contributions: $2,471 (reported on 17.9% of returns )(% of AGI for various income ranges: 0.6% for AGIs below $25k , 0.7% for AGIs $25k-50k , 1.1% for AGIs $50k-75k , 1.1% for AGIs $75k-100k , 1.5% for AGIs $100k-200k , 0.8% for AGIs over 200k ) Taxes paid: $4,236 (reported on 23.2% of returns )(% of AGI for various income ranges: 1.7% for AGIs below $25k , 1.5% for AGIs $25k-50k , 2.1% for AGIs $50k-75k , 2.3% for AGIs $75k-100k , 3.1% for AGIs $100k-200k , 3.1% for AGIs over 200k ) Earned income credit: $2,427 (reported on 26.1% of returns )(% of AGI for various income ranges: 8.8% for AGIs below $25k , 1.6% for AGIs $25k-50k ) Percentage of individuals using paid preparers for their 2012 taxes: 48.3%(% for various income ranges: 47.2% for AGIs below $25k , 45.9% for AGIs $25k-50k , 47.7% for AGIs $50k-75k , 50.0% for AGIs $75k-100k , 59.7% for AGIs $100k-200k , 81.8% for AGIs over 200k )
Averages for the 2004 tax year for zip code 33993, filed in 2005:
Average Adjusted Gross Income (AGI) in 2004: $44,173 (Individual Income Tax Returns) Here:
$44,173State:
$50,523
Salary/wage: $37,467 (reported on 85.1% of returns )Here:
$37,467State:
$39,563
(% of AGI for various income ranges: 116.3% for AGIs below $10k , 77.4% for AGIs $10k-25k , 82.9% for AGIs $25k-50k , 78.6% for AGIs $50k-75k , 76.9% for AGIs $75k-100k , 52.3% for AGIs over 100k ) Taxable interest for individuals: $1,307 (reported on 37.3% of returns )This zip code:
$1,307Florida:
$3,211
(% of AGI for various income ranges: 2.9% for AGIs below $10k , 1.2% for AGIs $10k-25k , 0.9% for AGIs $25k-50k , 0.9% for AGIs $50k-75k , 1.3% for AGIs $75k-100k , 1.2% for AGIs over 100k ) Taxable dividends: $1,903 (reported on 16.0% of returns )(% of AGI for various income ranges: 2.6% for AGIs below $10k , 1.2% for AGIs $10k-25k , 0.7% for AGIs $25k-50k , 0.5% for AGIs $50k-75k , 0.6% for AGIs $75k-100k , 0.6% for AGIs over 100k ) Net capital gain/loss: +$17,134 (reported on 16.1% of returns )Here:
+$17,134State:
+$27,205
(% of AGI for various income ranges: -1.8% for AGIs below $10k , 0.2% for AGIs $10k-25k , 1.4% for AGIs $25k-50k , 3.2% for AGIs $50k-75k , 4.8% for AGIs $75k-100k , 15.7% for AGIs over 100k ) Profit/loss from business: +$8,935 (reported on 19.2% of returns )Here:
+$8,935State:
+$10,634
(% of AGI for various income ranges: 11.2% for AGIs below $10k , 10.2% for AGIs $10k-25k , 2.4% for AGIs $25k-50k , 3.4% for AGIs $50k-75k , 2.3% for AGIs $75k-100k , 3.8% for AGIs over 100k ) IRA payment deduction: $2,843 (reported on 2.2% of returns )33993:
$2,843Florida:
$3,082
(% of AGI for various income ranges: 0.1% for AGIs $10k-25k , 0.1% for AGIs $25k-50k , 0.2% for AGIs $50k-75k , 0.2% for AGIs $75k-100k , 0.1% for AGIs over 100k ) Total itemized deductions: $17,524 (26% of AGI, reported on 38.2% of returns )Here:
$17,524State:
$20,370
Here:
26.5% of AGIState:
20.7% of AGI
(% of AGI for various income ranges: 32.9% for AGIs below $10k , 17.5% for AGIs $10k-25k , 17.3% for AGIs $25k-50k , 16.0% for AGIs $50k-75k , 15.9% for AGIs $75k-100k , 10.9% for AGIs over 100k ) Charity contributions deductions: $1,854 (3% of AGI, reported on 28.9% of returns )Here:
2.6% of AGIState:
3.8% of AGI
(% of AGI for various income ranges: 1.0% for AGIs below $10k , 0.8% for AGIs $10k-25k , 1.1% for AGIs $25k-50k , 1.5% for AGIs $50k-75k , 1.3% for AGIs $75k-100k , 1.2% for AGIs over 100k ) Total tax: $6,204 (reported on 75.5% of returns )(% of AGI for various income ranges: 3.8% for AGIs below $10k , 4.5% for AGIs $10k-25k , 6.0% for AGIs $25k-50k , 8.1% for AGIs $50k-75k , 10.1% for AGIs $75k-100k , 18.9% for AGIs over 100k ) Earned income credit: $1,772 (reported on 18.2% of returns )Percentage of individuals using paid preparers for their 2004 taxes: 57.3%(% for various income ranges: 50.1% for AGIs below $10k , 58.2% for AGIs $10k-25k , 56.3% for AGIs $25k-50k , 58.8% for AGIs $50k-75k , 60.4% for AGIs $75k-100k , 68.8% for AGIs over 100k )
Estimated median household income in 2022: This zip code:
$87,874Florida:
$69,303
Nearest zip codes: 33991 ,
33909 ,
33990 ,
33903 ,
33955 ,
33914 .
Matlacha Isles Matlacha Shores Zip Code Map
Percentage of family households: This zip code:
48.3%Florida:
41.2%
Percentage of households with unmarried partners: This zip code:
7.7%Florida:
46.7%
Likely homosexual households (counted as self-reported same-sex unmarried-partner households)
Lesbian couples: 0.1% of all households Gay men: 0.0% of all households
Household received Food Stamps/SNAP in the past 12 months: 1,047Household did not receive Food Stamps/SNAP in the past 12 months: 9,972
Women who had a birth in the past 12 months: 474 (297 now married , 175 unmarried) Women who did not have a birth in the past 12 months: 6,625 (2,996 now married , 3,630 unmarried)
Housing units in zip code 33993 with a mortgage: 6,482 (264
second mortgage , 248
both second mortgage and home equity loan )
Houses without a mortgage: 23
Median monthly owner costs for units with a mortgage: $1,565
Median monthly owner costs for units without a mortgage: $529
Residents with income below the poverty level in 2022:
This zip code:
12.8%Whole state:
12.7%
Residents with income below 50% of the poverty level in 2022:
This zip code:
6.4%Whole state:
6.6%
Median number of rooms in houses and condos: Median number of rooms in apartments:
Year house built (houses)
197 2020 or later2,008 2010 to 20197,849 2000 to 2009880 1990 to 1999622 1980 to 1989227 1970 to 1979139 1960 to 1969395 1950 to 19590 1940 to 19490 1939 or earlier
Zip code 33993 household income distribution in 2022 777 Less than $10,000283 $10,000 to $14,999184 $15,000 to $19,999264 $20,000 to $24,999172 $25,000 to $29,999282 $30,000 to $34,999405 $35,000 to $39,999158 $40,000 to $44,999257 $45,000 to $49,999866 $50,000 to $59,999992 $60,000 to $74,9992,066 $75,000 to $99,9991,180 $100,000 to $124,9991,268 $125,000 to $149,9991,011 $150,000 to $199,999898 $200,000 or moreEstimate of home value of owner-occupied houses/condos in 2022 in zip code 33993 30 Less than $10,00045 $10,000 to $14,9998 $15,000 to $19,99913 $20,000 to $24,99959 $30,000 to $34,9999 $35,000 to $39,99991 $40,000 to $49,99928 $60,000 to $69,99967 $70,000 to $79,99942 $100,000 to $124,999152 $150,000 to $174,999615 $175,000 to $199,9991,093 $200,000 to $249,9991,601 $250,000 to $299,9992,957 $300,000 to $399,999836 $400,000 to $499,999853 $500,000 to $749,999438 $750,000 to $999,99978 $1,000,000 to $1,499,99913 $1,500,000 to $1,999,999Rent paid by renters in 2022 in zip code 33993 20 $550 to $59917 $700 to $7497 $800 to $89925 $900 to $999138 $1,000 to $1,249239 $1,250 to $1,499982 $1,500 to $1,999288 $2,000 to $2,49931 $2,500 to $2,99944 No cash rent
Median gross rent in 2022: $1,963.
Median price asked for vacant for-sale houses and condos in 2022: $529,981.
Estimated median house (or condo) value in 2022 for: White Non-Hispanic householders: $353,832Black or African American householders: $551,085American Indian or Alaska Native householders: $494,933Some other race householders: $305,958Hispanic or Latino householders: $353,832Estimated median house or condo value in 2022: $351,313
33993:
$351,313Florida:
$354,100
Lower value quartile - upper value quartile: $274,258 - $441,338
Mean price in 2022: Detached houses: $441,592Here:
$441,592State:
$500,941
Townhouses or other attached units: $381,032Here:
$381,032State:
$370,869
In 2-unit structures: $375,448Here:
$375,448State:
$423,188
In 3-to-4-unit structures: $209,519Here:
$209,519State:
$309,944
In 5-or-more-unit structures: $261,614Here:
$261,614State:
$447,145
Mobile homes: $18,759Here:
$18,759State:
$113,202
Housing units in structures:
One, detached: 11,421One, attached: 160Two: 563 or 4: 365 to 9: 1620 to 49: 15Mobile homes: 314Unemployment : 3.3%
Means of transportation to work in zip code 33993 71.5% 10,857 Drove a car alone11.3% 1,718 Carpooled0.4% 56 Motorcycle0.5% 70 Walked2.2% 334 Other means13.3% 2,022 Worked at homeTravel time to work (commute) in zip code 33993 482 Less than 5 minutes355 5 to 9 minutes1,288 10 to 14 minutes1,329 15 to 19 minutes1,990 20 to 24 minutes414 25 to 29 minutes2,239 30 to 34 minutes547 35 to 39 minutes989 40 to 44 minutes2,163 45 to 59 minutes954 60 to 89 minutes266 90 or more minutes
Neighborhoods in zip code 33993: Percentage of zip code residents living and working in this county: 91.0%
Household type by relationship:
Households: 31,434
Male householders: 6,512 (1,110 living alone ), Female householders: 4,466 (687 living alone )6,524 spouses (6,494 opposite-sex spouses ), 1,212 unmarried partners , (1,152 opposite-sex unmarried partners ), 9,268 children (8,765 natural , 99 adopted , 400 stepchildren ), 722 grandchildren , 194 brothers or sisters , 728 parents , 95 foster children , 439 other relatives , 1,170 non-relatives In group quarters: 30 (-1 institutionalized population )
Size of family households: 3,892 2-persons , 1,696 3-persons , 1,786 4-persons , 598 5-persons , 280 6-persons , 110 7-or-more-persons
Size of nonfamily households: 1,793 1-person , 740 2-persons , 10 3-persons , 64 4-persons , 62 7-or-more-persons
4,659 married couples with children. single-parent households (634 men , 836 women ).
75.8% of residents of 33993 zip code speak English at home. of residents speak Spanish at home (54% very well, 17% well, 13% not well, 16% not at all ).of residents speak other Indo-European language at home (42% very well, 37% well, 12% not well, 9% not at all ).of residents speak Asian or Pacific Island language at home (62% very well, 5% well, 33% not well ).of residents speak other language at home (70% very well, 30% well ).
Foreign born population: 5,727 (18.2%)
(76.1%
of them are naturalized citizens )
This zip code:
18.2%Whole state:
21.7%
41% Barbados 7% Dominica 4% Ecuador 4% Haiti 4% Chile 4% Mexico 3% Honduras 13% American 11% German 6% English 5% Irish 5% Italian 1% Jamaican 1% European
Year of entry for the foreign-born population
1,092 2010 or later 1,400 2000 to 2009 1,576 1990 to 1999 2,152 Before 1990
There are
12 Medical Specialists in Zip Code 33993 .
Facilities with environmental interests located in this zip code:
LEE COUNTY HIGH TECH CENTER NORTH (360 SANTA BARBARA NORTH in CAPE CORAL, FL)
(National Center for Education Statistics) - STATE ID-0581 Organizations: LEE COUNTY SCHOOL DISTRICT (SCHOOL DISTRICT)
MARINER MIDDLE SCHOOL "HH" (25 CHIQUITA AVE. in CAPE CORAL, FL)
National Pollutant Discharge Elimination System NON-MAJOR (Tracking pollutant discharge elimination systems) - permit Organizations: JOE PRESSLER (CONTACT/OWNER)
AMERICINN (NEAR INTERSECTION OF PINE IS R in CAPE CORAL, FL)
National Pollutant Discharge Elimination System NON-MAJOR (Tracking pollutant discharge elimination systems) - permit Organizations: ODIS MCCLELLAN (CONTACT/OWNER)
GREEN RESIDENCE (4600 BURNT STORE RD N in CAPE CORAL, FL)
National Pollutant Discharge Elimination System NON-MAJOR (Tracking pollutant discharge elimination systems) - permit Organizations: WILLIAM GREEN (CONTACT/OWNER)
MATLACHA WASTE WATER TREATMENT PLT (4950 PINE ISLAND RD in MATLACHA, FL)
(Resource Conservation and Recovery Act (tracking hazardous waste)) Organizations: LEE COUNTY BOCC (CONTACT/OWNER)
NICHOLAS PARKWAY RETAIL CENTER (UNDETERMINED ON NICHOLAS PARKW in CAPE CORAL, FL)
National Pollutant Discharge Elimination System NON-MAJOR (Tracking pollutant discharge elimination systems) - permit Organizations: NORMAN BURKE (CONTACT/OWNER)
COMMERCIAL DEVELOPMENT LOT 58, (501 SW PINE ISLAND RD in CAPE CORAL, FL)
National Pollutant Discharge Elimination System NON-MAJOR (Tracking pollutant discharge elimination systems) - permit Organizations: ROGER CAMPAGNOLO (CONTACT/OWNER)
LEE COUNTY MINING, INC. (3501 BURNT STORE ROAD in CAPE CORAL, FL)
AIR MINOR (AIRS/AFS) Business SIC classification: REFUSE SYSTEMS
Housing units lacking complete plumbing facilities: 0.4%
Housing units lacking complete kitchen facilities: 0.4%
92.1% Electricity 4.2% No fuel used 1.7% Solar energy 1.1% Utility gas 0.7% Wood
Place of birth for U.S.-born residents:
This state: 10,040Northeast: 6,051Midwest: 5,080South: 2,535West: 1,190
54% of the 33993 zip code residents lived in the same house 5 years ago.
Out of people who lived in different houses, 50% lived in this county.
Out of people who lived in different counties, 50% lived in Florida.
85% of the 33993 zip code residents lived in the same house 1 year ago.
Out of people who lived in different houses, 46% moved from this county.
Out of people who lived in different houses, 22% moved from different county within same state.
Out of people who lived in different houses, 28% moved from different state.
Out of people who lived in different houses, 2% moved from abroad.
Private vs. public school enrollment:
Students in private schools in grades 1 to 8 (elementary and middle school): 114
Students in private schools in grades 9 to 12 (high school): 308
Students in private undergraduate colleges: 251
Occupation by median earnings in the past 12 months ($)
88,651 Computer and mathematical occupations 78,153 Health diagnosing and treating practitioners and other technical occupations 76,509 Management occupations 69,262 Architecture and engineering occupations 59,392 Life, physical, and social science occupations 57,828 Installation, maintenance, and repair occupations
Companies with federal contracts located in this zip code:
RIGS & THINGS PARASERVICE INC (2212 NW 4TH TER in CAPE CORAL, FL; small business) in 3 contracts from 2005 to 2006
$8,474 with Army for Parachutes; Aerial Pick Up, Delivery, Recovery Systems; and Cargo Tie Down Equipment. Signed on 2006-05-01. Completion date: 2006-06-12.
with Navy for Individual Equipment. Signed on 2005-09-27. Completion date: 2005-10-21.
, same as above. Signed on 2005-08-09. Completion date: 2005-09-07.
Top industries in this zip code by the number of employees in 2005:
Accommodation and Food Services: Full-Service Restaurants (20-49 employees: 2 establishments)Construction: Plumbing, Heating, and Air-Conditioning Contractors (20-49: 1, 10-19: 1, 1-4: 4)Construction: Finish Carpentry Contractors (20-49: 1, 1-4: 3)Construction: Framing Contractors (20-49: 1, 1-4: 1)Real Estate and Rental and Leasing: Offices of Real Estate Agents and Brokers (1-4: 17)Construction: Site Preparation Contractors (10-19: 1, 5-9: 1, 1-4: 4)Construction: Residential Remodelers (10-19: 1, 1-4: 3)Administrative and Support and Waste Management and Remediation Services: Office Administrative Services (5-9: 2, 1-4: 1)Construction: Poured Concrete Foundation and Structure Contractors (10-19: 1)
People in group quarters in 2010:
7 people in group homes for juveniles (non-correctional)
7 people in group homes intended for adults
5 people in nursing facilities/skilled-nursing facilities
5 people in in-patient hospice facilities
Fatal accident statistics in 2014:
Fatal accident count: 1Vehicles involved in fatal accidents: 1Fatal accidents caused by drunken drivers: 0Fatalities: 1Persons involved in fatal accidents: 1Pedestrians involved in fatal accidents: 1
Fatal accident statistics in 2012:
Fatal accident count: 1Vehicles involved in fatal accidents: 2Fatal accidents caused by drunken drivers: 0Fatalities: 1Persons involved in fatal accidents: 2Pedestrians involved in fatal accidents: 0
Home Mortgage Disclosure Act Aggregated Statistics For Year 2009(Based on 14 partial tracts) A) FHA, FSA/RHS & VA B) Conventional C) Refinancings D) Home Improvement Loans F) Non-occupant Loans on G) Loans On Manufactured Number Average Value Number Average Value Number Average Value Number Average Value Number Average Value Number Average Value
LOANS ORIGINATED 371 $105,086 439 $100,095 183 $175,666 4 $130,408 300 $105,756 3 $101,623 APPLICATIONS APPROVED, NOT ACCEPTED 17 $117,222 46 $98,686 34 $209,867 2 $75,885 32 $109,798 0 $0 APPLICATIONS DENIED 103 $107,043 133 $96,569 174 $185,936 17 $40,038 126 $145,497 3 $23,803 APPLICATIONS WITHDRAWN 54 $109,636 66 $102,217 87 $184,826 3 $74,880 52 $131,636 1 $67,690 FILES CLOSED FOR INCOMPLETENESS 18 $105,008 19 $140,784 22 $190,394 2 $223,470 12 $198,492 0 $0
Aggregated Statistics For Year 2008(Based on 14 partial tracts) A) FHA, FSA/RHS & VA B) Conventional C) Refinancings D) Home Improvement Loans F) Non-occupant Loans on G) Loans On Manufactured Number Average Value Number Average Value Number Average Value Number Average Value Number Average Value Number Average Value
LOANS ORIGINATED 408 $129,450 523 $129,040 204 $190,215 12 $112,573 294 $140,468 3 $54,773 APPLICATIONS APPROVED, NOT ACCEPTED 25 $123,831 81 $162,671 89 $210,459 5 $17,924 60 $208,836 3 $49,083 APPLICATIONS DENIED 96 $134,761 206 $159,583 369 $209,891 24 $74,456 166 $196,700 6 $47,118 APPLICATIONS WITHDRAWN 42 $137,292 81 $127,329 107 $199,913 1 $49,720 69 $162,223 0 $0 FILES CLOSED FOR INCOMPLETENESS 26 $143,767 44 $163,944 22 $229,903 3 $126,890 21 $166,592 0 $0
Aggregated Statistics For Year 2007(Based on 14 partial tracts) A) FHA, FSA/RHS & VA B) Conventional C) Refinancings D) Home Improvement Loans E) Loans on Dwellings For 5+ Families F) Non-occupant Loans on G) Loans On Manufactured Number Average Value Number Average Value Number Average Value Number Average Value Number Average Value Number Average Value Number Average Value
LOANS ORIGINATED 57 $186,433 1,152 $204,568 1,062 $215,377 81 $111,706 0 $0 820 $225,409 10 $52,076 APPLICATIONS APPROVED, NOT ACCEPTED 7 $199,360 328 $211,569 368 $219,017 30 $62,376 1 $315,180 252 $235,268 4 $66,682 APPLICATIONS DENIED 30 $188,262 648 $227,628 1,051 $231,982 119 $114,475 0 $0 500 $246,371 8 $79,276 APPLICATIONS WITHDRAWN 10 $201,840 232 $217,683 461 $247,529 28 $127,847 0 $0 261 $273,678 1 $64,610 FILES CLOSED FOR INCOMPLETENESS 1 $159,990 91 $212,826 153 $237,878 1 $230,530 0 $0 50 $234,312 0 $0
Aggregated Statistics For Year 2006(Based on 14 partial tracts) A) FHA, FSA/RHS & VA B) Conventional C) Refinancings D) Home Improvement Loans E) Loans on Dwellings For 5+ Families F) Non-occupant Loans on G) Loans On Manufactured Number Average Value Number Average Value Number Average Value Number Average Value Number Average Value Number Average Value Number Average Value
LOANS ORIGINATED 13 $210,252 3,216 $203,178 2,463 $216,763 171 $144,062 1 $202,770 2,392 $236,519 13 $66,358 APPLICATIONS APPROVED, NOT ACCEPTED 1 $290,880 878 $227,381 410 $210,837 44 $96,615 0 $0 686 $238,950 4 $101,628 APPLICATIONS DENIED 7 $260,510 1,287 $210,031 1,009 $225,946 148 $97,795 0 $0 880 $237,947 11 $81,475 APPLICATIONS WITHDRAWN 4 $286,598 717 $227,013 605 $228,365 29 $178,905 0 $0 551 $253,540 0 $0 FILES CLOSED FOR INCOMPLETENESS 4 $226,930 138 $210,559 152 $225,973 9 $248,014 0 $0 84 $235,248 0 $0
Aggregated Statistics For Year 2005(Based on 14 partial tracts) A) FHA, FSA/RHS & VA B) Conventional C) Refinancings D) Home Improvement Loans F) Non-occupant Loans on G) Loans On Manufactured Number Average Value Number Average Value Number Average Value Number Average Value Number Average Value Number Average Value
LOANS ORIGINATED 36 $169,193 3,244 $178,037 1,514 $178,415 111 $139,062 1,602 $193,087 20 $54,858 APPLICATIONS APPROVED, NOT ACCEPTED 2 $177,710 475 $176,793 343 $214,251 44 $153,520 387 $221,606 5 $67,144 APPLICATIONS DENIED 7 $168,929 789 $191,874 616 $193,141 136 $97,684 457 $229,308 13 $81,090 APPLICATIONS WITHDRAWN 8 $175,632 653 $174,998 404 $183,665 48 $166,362 295 $202,621 0 $0 FILES CLOSED FOR INCOMPLETENESS 0 $0 148 $176,532 287 $193,549 10 $178,607 135 $222,752 0 $0
Aggregated Statistics For Year 2004(Based on 14 partial tracts) A) FHA, FSA/RHS & VA B) Conventional C) Refinancings D) Home Improvement Loans F) Non-occupant Loans on G) Loans On Manufactured Number Average Value Number Average Value Number Average Value Number Average Value Number Average Value Number Average Value
LOANS ORIGINATED 198 $138,985 1,953 $147,399 586 $140,522 74 $69,536 797 $159,352 16 $53,158 APPLICATIONS APPROVED, NOT ACCEPTED 11 $141,315 221 $145,449 129 $142,409 18 $60,629 109 $153,830 2 $122,610 APPLICATIONS DENIED 19 $146,409 379 $138,772 294 $131,872 98 $38,034 145 $161,426 13 $38,422 APPLICATIONS WITHDRAWN 19 $140,705 226 $167,168 161 $134,412 24 $46,958 96 $177,392 2 $127,160 FILES CLOSED FOR INCOMPLETENESS 5 $143,324 58 $137,107 128 $134,013 10 $52,422 26 $120,760 3 $71,520
Aggregated Statistics For Year 2003(Based on 14 partial tracts) A) FHA, FSA/RHS & VA B) Conventional C) Refinancings D) Home Improvement Loans E) Loans on Dwellings For 5+ Families F) Non-occupant Loans on Number Average Value Number Average Value Number Average Value Number Average Value Number Average Value Number Average Value
LOANS ORIGINATED 211 $124,670 902 $143,076 853 $123,416 38 $46,267 2 $392,655 442 $144,724 APPLICATIONS APPROVED, NOT ACCEPTED 21 $125,092 103 $143,045 79 $126,877 5 $57,872 0 $0 37 $136,056 APPLICATIONS DENIED 24 $137,867 153 $132,700 268 $111,039 48 $25,201 1 $220,630 78 $126,788 APPLICATIONS WITHDRAWN 21 $123,470 101 $142,980 137 $125,603 5 $36,966 1 $474,760 52 $134,558 FILES CLOSED FOR INCOMPLETENESS 13 $101,162 20 $119,553 37 $114,112 4 $65,240 0 $0 7 $150,964
Aggregated Statistics For Year 2002(Based on 14 partial tracts) A) FHA, FSA/RHS & VA B) Conventional C) Refinancings D) Home Improvement Loans E) Loans on Dwellings For 5+ Families F) Non-occupant Loans on Number Average Value Number Average Value Number Average Value Number Average Value Number Average Value Number Average Value
LOANS ORIGINATED 144 $113,622 478 $137,082 497 $119,159 21 $32,372 1 $2,677,450 247 $131,152 APPLICATIONS APPROVED, NOT ACCEPTED 8 $127,655 39 $132,943 59 $102,535 7 $34,821 0 $0 14 $94,792 APPLICATIONS DENIED 6 $125,297 50 $122,565 151 $90,990 28 $30,435 0 $0 8 $136,715 APPLICATIONS WITHDRAWN 22 $107,166 55 $114,634 95 $96,531 8 $50,195 0 $0 19 $98,987 FILES CLOSED FOR INCOMPLETENESS 6 $107,808 11 $123,205 30 $96,954 1 $89,470 0 $0 6 $165,663
Aggregated Statistics For Year 2001(Based on 14 partial tracts) A) FHA, FSA/RHS & VA B) Conventional C) Refinancings D) Home Improvement Loans F) Non-occupant Loans on Number Average Value Number Average Value Number Average Value Number Average Value Number Average Value
LOANS ORIGINATED 88 $93,827 334 $127,933 353 $105,678 28 $25,565 144 $138,785 APPLICATIONS APPROVED, NOT ACCEPTED 6 $111,890 31 $140,220 42 $88,266 7 $34,764 12 $152,740 APPLICATIONS DENIED 11 $79,223 41 $79,443 123 $78,285 37 $16,790 19 $86,908 APPLICATIONS WITHDRAWN 10 $86,551 40 $111,994 85 $83,206 8 $34,668 11 $98,008 FILES CLOSED FOR INCOMPLETENESS 4 $112,698 6 $88,207 15 $76,297 1 $60,260 2 $133,210
Aggregated Statistics For Year 2000(Based on 14 partial tracts) A) FHA, FSA/RHS & VA B) Conventional C) Refinancings D) Home Improvement Loans F) Non-occupant Loans on Number Average Value Number Average Value Number Average Value Number Average Value Number Average Value
LOANS ORIGINATED 121 $90,493 195 $105,328 73 $72,051 28 $18,491 64 $104,818 APPLICATIONS APPROVED, NOT ACCEPTED 6 $88,930 21 $92,760 21 $65,846 7 $22,139 6 $84,477 APPLICATIONS DENIED 14 $89,832 44 $81,630 97 $59,951 45 $20,600 10 $69,164 APPLICATIONS WITHDRAWN 10 $92,455 19 $83,522 57 $61,517 7 $15,247 3 $73,040 FILES CLOSED FOR INCOMPLETENESS 6 $71,792 8 $108,949 12 $64,470 0 $0 0 $0
Aggregated Statistics For Year 1999(Based on 7 partial tracts) A) FHA, FSA/RHS & VA B) Conventional C) Refinancings D) Home Improvement Loans E) Loans on Dwellings For 5+ Families F) Non-occupant Loans on Number Average Value Number Average Value Number Average Value Number Average Value Number Average Value Number Average Value
LOANS ORIGINATED 53 $87,002 92 $108,705 81 $68,204 16 $17,224 0 $0 31 $104,730 APPLICATIONS APPROVED, NOT ACCEPTED 0 $0 10 $80,114 19 $67,667 8 $34,302 0 $0 4 $79,740 APPLICATIONS DENIED 7 $87,249 18 $70,337 53 $63,425 23 $20,737 0 $0 2 $66,575 APPLICATIONS WITHDRAWN 6 $93,053 12 $102,922 32 $61,211 5 $42,228 0 $0 1 $38,440 FILES CLOSED FOR INCOMPLETENESS 2 $66,800 4 $81,785 8 $75,178 1 $67,080 1 $42,390 1 $40,000
Private Mortgage Insurance Companies Aggregated Statistics For Year 2009(Based on 14 partial tracts) A) Conventional B) Refinancings C) Non-occupant Loans on Number Average Value Number Average Value Number Average Value
LOANS ORIGINATED 29 $105,074 1 $275,730 7 $86,714 APPLICATIONS APPROVED, NOT ACCEPTED 65 $288,559 13 $347,225 53 $351,851 APPLICATIONS DENIED 3 $85,083 1 $142,800 0 $0 APPLICATIONS WITHDRAWN 2 $127,685 0 $0 0 $0 FILES CLOSED FOR INCOMPLETENESS 3 $88,950 2 $238,485 1 $98,760
Aggregated Statistics For Year 2008(Based on 14 partial tracts) A) Conventional B) Refinancings C) Non-occupant Loans on Number Average Value Number Average Value Number Average Value
LOANS ORIGINATED 166 $158,760 33 $227,124 63 $178,213 APPLICATIONS APPROVED, NOT ACCEPTED 170 $265,572 95 $303,006 149 $314,527 APPLICATIONS DENIED 53 $246,140 10 $242,755 28 $229,958 APPLICATIONS WITHDRAWN 13 $212,700 4 $297,035 11 $251,490 FILES CLOSED FOR INCOMPLETENESS 17 $182,282 6 $381,913 14 $301,058
Aggregated Statistics For Year 2007(Based on 14 partial tracts) A) Conventional B) Refinancings C) Non-occupant Loans on Number Average Value Number Average Value Number Average Value
LOANS ORIGINATED 463 $265,528 269 $287,096 375 $307,063 APPLICATIONS APPROVED, NOT ACCEPTED 444 $305,597 165 $305,784 480 $310,289 APPLICATIONS DENIED 28 $287,966 21 $266,933 22 $260,191 APPLICATIONS WITHDRAWN 67 $342,044 34 $299,309 76 $328,414 FILES CLOSED FOR INCOMPLETENESS 11 $309,178 0 $0 8 $326,376
Aggregated Statistics For Year 2006(Based on 14 partial tracts) A) Conventional B) Refinancings C) Non-occupant Loans on D) Loans On Manufactured Number Average Value Number Average Value Number Average Value Number Average Value
LOANS ORIGINATED 342 $249,735 279 $285,726 372 $273,047 1 $156,920 APPLICATIONS APPROVED, NOT ACCEPTED 344 $295,359 317 $276,856 530 $284,610 0 $0 APPLICATIONS DENIED 21 $320,117 29 $344,330 47 $336,745 0 $0 APPLICATIONS WITHDRAWN 78 $317,268 44 $321,633 91 $329,348 0 $0 FILES CLOSED FOR INCOMPLETENESS 2 $336,285 4 $367,780 7 $306,241 0 $0
Aggregated Statistics For Year 2005(Based on 14 partial tracts) A) Conventional B) Refinancings C) Non-occupant Loans on Number Average Value Number Average Value Number Average Value
LOANS ORIGINATED 390 $199,606 52 $213,541 209 $192,870 APPLICATIONS APPROVED, NOT ACCEPTED 212 $230,463 310 $248,066 411 $245,641 APPLICATIONS DENIED 18 $274,543 6 $246,138 11 $273,947 APPLICATIONS WITHDRAWN 46 $209,271 59 $277,437 66 $254,005 FILES CLOSED FOR INCOMPLETENESS 5 $225,736 12 $246,737 15 $257,649
Aggregated Statistics For Year 2004(Based on 14 partial tracts) A) Conventional B) Refinancings C) Non-occupant Loans on Number Average Value Number Average Value Number Average Value
LOANS ORIGINATED 387 $153,428 58 $149,732 164 $148,297 APPLICATIONS APPROVED, NOT ACCEPTED 102 $169,925 26 $157,182 54 $156,480 APPLICATIONS DENIED 11 $146,136 2 $284,500 7 $189,219 APPLICATIONS WITHDRAWN 40 $169,813 15 $189,514 21 $169,640 FILES CLOSED FOR INCOMPLETENESS 2 $208,000 1 $198,560 2 $159,925
Aggregated Statistics For Year 2003(Based on 14 partial tracts) A) Conventional B) Refinancings C) Non-occupant Loans on Number Average Value Number Average Value Number Average Value
LOANS ORIGINATED 239 $138,088 57 $142,244 110 $134,837 APPLICATIONS APPROVED, NOT ACCEPTED 75 $180,774 34 $140,962 33 $177,327 APPLICATIONS DENIED 5 $187,356 0 $0 3 $182,923 APPLICATIONS WITHDRAWN 35 $162,135 7 $157,526 12 $137,638 FILES CLOSED FOR INCOMPLETENESS 3 $242,087 0 $0 1 $165,250
Aggregated Statistics For Year 2002(Based on 14 partial tracts) A) Conventional B) Refinancings C) Non-occupant Loans on Number Average Value Number Average Value Number Average Value
LOANS ORIGINATED 114 $130,585 48 $124,299 34 $133,659 APPLICATIONS APPROVED, NOT ACCEPTED 58 $165,114 20 $169,410 13 $196,922 APPLICATIONS DENIED 1 $261,800 2 $152,015 1 $261,800 APPLICATIONS WITHDRAWN 10 $183,970 2 $153,315 1 $156,540 FILES CLOSED FOR INCOMPLETENESS 3 $191,093 2 $239,235 2 $239,235
Aggregated Statistics For Year 2001(Based on 14 partial tracts) A) Conventional B) Refinancings C) Non-occupant Loans on Number Average Value Number Average Value Number Average Value
LOANS ORIGINATED 70 $130,856 32 $118,587 21 $162,704 APPLICATIONS APPROVED, NOT ACCEPTED 20 $160,126 11 $118,801 5 $196,428 APPLICATIONS DENIED 1 $285,600 0 $0 0 $0 APPLICATIONS WITHDRAWN 5 $146,528 1 $158,940 1 $135,120 FILES CLOSED FOR INCOMPLETENESS 1 $149,730 0 $0 0 $0
Aggregated Statistics For Year 2000(Based on 14 partial tracts) A) Conventional B) Refinancings C) Non-occupant Loans on Number Average Value Number Average Value Number Average Value
LOANS ORIGINATED 49 $107,840 5 $87,636 5 $71,058 APPLICATIONS APPROVED, NOT ACCEPTED 8 $133,148 3 $153,777 4 $107,518 APPLICATIONS DENIED 4 $125,440 0 $0 0 $0 APPLICATIONS WITHDRAWN 2 $101,400 2 $64,040 0 $0 FILES CLOSED FOR INCOMPLETENESS 1 $54,630 0 $0 0 $0
Aggregated Statistics For Year 1999(Based on 7 partial tracts) A) Conventional B) Refinancings C) Non-occupant Loans on Number Average Value Number Average Value Number Average Value
LOANS ORIGINATED 22 $102,247 10 $103,022 6 $111,563 APPLICATIONS APPROVED, NOT ACCEPTED 2 $155,325 0 $0 0 $0 APPLICATIONS DENIED 1 $106,590 0 $0 0 $0 APPLICATIONS WITHDRAWN 1 $22,500 1 $57,700 1 $22,500 FILES CLOSED FOR INCOMPLETENESS 0 $0 0 $0 0 $0
2002 - 2018 National Fire Incident Reporting System (NFIRS) incidents See full 2006 National Fire Incident Reporting System statistics for zip code 33993, Florida
Most common first names in zip code 33993 among deceased individuals Name Count Lived (average)
John 19 74.3 years William 16 74.9 years James 14 78.3 years Richard 14 72.9 years Robert 13 71.8 years George 8 71.7 years Donald 8 69.1 years Thomas 6 67.3 years Mary 6 75.8 years Edward 6 70.7 years
Most common last names in zip code 33993 among deceased individuals Last name Count Lived (average)
Cook 4 79.3 years Smith 4 77.7 years Johnson 3 74.3 years Dobbins 3 66.0 years Evans 3 86.3 years Leonardi 3 81.3 years Martin 3 83.3 years Nelson 3 79.0 years Perry 3 77.3 years Thomas 3 71.4 years
Businesses in zip code 33993
DressBarn: 1Dressbarn: 1Famous Footwear: 1
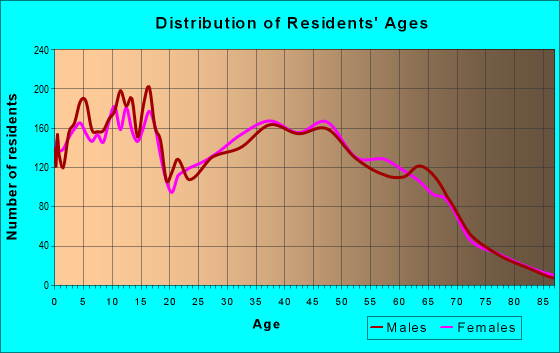
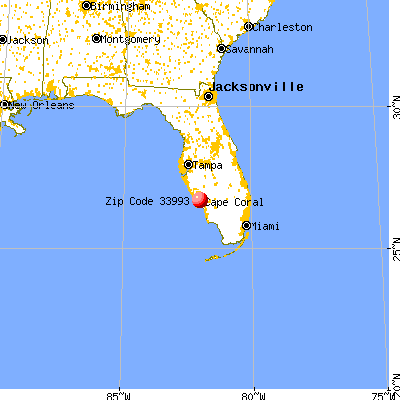


 Nearest zip codes: 33991, 33909, 33990, 33903, 33955, 33914.


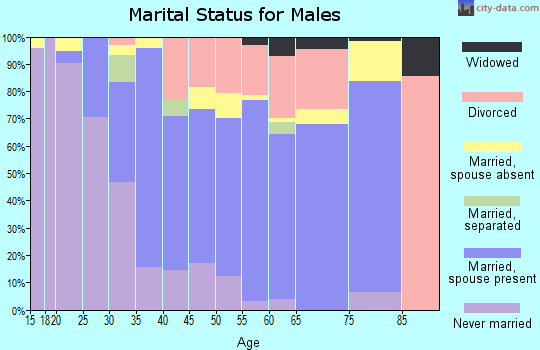


 According to the data from the years 2002 - 2018 the average number of fire incidents per year is 50. The highest number of fire incidents - 92 took place in 2009, and the least - 1 in 2003. The data has a rising trend.
 When looking into fire subcategories, the most incidents belonged to: Outside Fires (56.6%), and Structure Fires (24.5%).