Estimated median house/condo value in 2022: $401,604
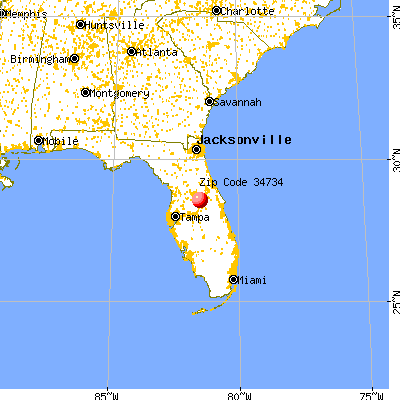
34734:
$401,604
Florida:
$354,100
According to our research of Florida and other state lists, there were 4 registered sex offenders living in 34734 zip code as of May 28, 2024. The ratio of all residents to sex offenders in zip code 34734 is 1,032 to 1. The ratio of registered sex offenders to all residents in this zip code is lower than the state average.
Median resident age:
This zip code:
32.2 years
Florida median age:
42.7 years
Average household size:
This zip code:
3.4 people
Florida:
2.5 people
Averages for the 2020 tax year for zip code 34734, filed in 2021:
Average Adjusted Gross Income (AGI) in 2020: $86,615 (Individual Income Tax Returns)
Here:
$86,615
State:
$82,200
Salary/wage: $75,347 (reported on 80.3% of returns)
Here:
$75,347
State:
$58,347
(% of AGI for various income ranges: 1163.4% for AGIs below $25k, 3700.3% for AGIs $25k-50k, 6814.7% for AGIs $50k-75k, 8658.3% for AGIs $75k-100k, 19832.2% for AGIs $100k-200k, 70436.2% for AGIs over 200k)
Taxable interest for individuals: $1,255 (reported on 29.1% of returns)
This zip code:
$1,255
Florida:
$4,272
(% of AGI for various income ranges: 11.9% for AGIs below $25k, 8.9% for AGIs $25k-50k, 12.1% for AGIs $50k-75k, 25.0% for AGIs $75k-100k, 162.8% for AGIs $100k-200k, 468.8% for AGIs over 200k)
Ordinary dividends: $4,608 (reported on 21.5% of returns)
Here:
$4,608
State:
$15,863
(% of AGI for various income ranges: 20.8% for AGIs below $25k, 37.8% for AGIs $25k-50k, 53.7% for AGIs $50k-75k, 59.2% for AGIs $75k-100k, 260.0% for AGIs $100k-200k, 1656.2% for AGIs over 200k)
Net capital gain/loss in AGI: +$18,372 (reported on 20.6% of returns)
Here:
+$18,372
State:
+$62,983
(% of AGI for various income ranges: 8.1% for AGIs below $25k, 50.0% for AGIs $25k-50k, 77.4% for AGIs $50k-75k, 96.7% for AGIs $75k-100k, 357.2% for AGIs $100k-200k, 9152.5% for AGIs over 200k)
Profit/loss from business: +$11,762 (reported on 23.3% of returns)
Here:
+$11,762
State:
+$9,719
(% of AGI for various income ranges: 193.6% for AGIs below $25k, 277.2% for AGIs $25k-50k, 218.9% for AGIs $50k-75k, 515.8% for AGIs $75k-100k, 911.1% for AGIs $100k-200k, 1771.2% for AGIs over 200k)
Taxable individual retirement arrangement distribution: $18,143 (reported on 6.3% of returns)
34734:
$18,143
Florida:
$24,823
(% of AGI for various income ranges: 37.7% for AGIs below $25k, 60.6% for AGIs $25k-50k, 175.3% for AGIs $50k-75k, 285.0% for AGIs $75k-100k, 803.9% for AGIs $100k-200k)
Total itemized deductions: $37,585 (reported on 9.0% of returns)
Here:
$37,585
State:
$45,393
(% of AGI for various income ranges: 228.1% for AGIs $25k-50k, 410.5% for AGIs $50k-75k, 660.0% for AGIs $75k-100k, 871.7% for AGIs $100k-200k, 4443.8% for AGIs over 200k)
Charity contributions: $13,541 (reported on 7.6% of returns)
Here:
$13,541
State:
$20,178
(% of AGI for various income ranges: 45.0% for AGIs $25k-50k, 160.8% for AGIs $75k-100k, 242.2% for AGIs $100k-200k, 1888.8% for AGIs over 200k)
Taxes paid: $6,815 (reported on 9.0% of returns)
34734:
$6,815
State:
$6,967
(% of AGI for various income ranges: 36.1% for AGIs $25k-50k, 45.8% for AGIs $50k-75k, 95.8% for AGIs $75k-100k, 186.1% for AGIs $100k-200k, 870.0% for AGIs over 200k)
Earned income credit: $2,189 (reported on 16.1% of returns)
Here:
$2,189
State:
$2,306
(% of AGI for various income ranges: 99.8% for AGIs below $25k, 71.9% for AGIs $25k-50k)
Percentage of individuals using paid preparers for their 2020 taxes: 92.4%
Here:
92%
State:
92%
(% for various income ranges: 89.5% for AGIs below $25k, 93.6% for AGIs $25k-50k, 93.1% for AGIs $50k-75k, 94.1% for AGIs $75k-100k, 94.1% for AGIs $100k-200k, 95.0% for AGIs over 200k)
Averages for the 2012 tax year for zip code 34734, filed in 2013:
Average Adjusted Gross Income (AGI) in 2012: $64,152 (Individual Income Tax Returns)
Here:
$64,152
State:
$60,316
Salary/wage: $57,209 (reported on 87.0% of returns)
Here:
$57,209
State:
$45,277
(% of AGI for various income ranges: 78.4% for AGIs below $25k, 81.0% for AGIs $25k-50k, 80.1% for AGIs $50k-75k, 79.8% for AGIs $75k-100k, 85.9% for AGIs $100k-200k, 64.3% for AGIs over 200k)
Taxable interest for individuals: $889 (reported on 31.9% of returns)
This zip code:
$889
Florida:
$3,587
(% of AGI for various income ranges: 1.2% for AGIs below $25k, 0.6% for AGIs $25k-50k, 0.3% for AGIs $50k-75k, 0.2% for AGIs $75k-100k, 0.5% for AGIs $100k-200k, 0.3% for AGIs over 200k)
Ordinary dividends: $2,672 (reported on 19.3% of returns)
Here:
$2,672
State:
$12,831
(% of AGI for various income ranges: 1.1% for AGIs below $25k, 1.2% for AGIs $25k-50k, 0.7% for AGIs $50k-75k, 0.4% for AGIs $75k-100k, 0.6% for AGIs $100k-200k, 1.0% for AGIs over 200k)
Net capital gain/loss in AGI: +$4,178 (reported on 13.0% of returns)
Here:
+$4,178
State:
+$33,493
(% of AGI for various income ranges: 0.1% for AGIs $75k-100k, 0.4% for AGIs $100k-200k, 2.7% for AGIs over 200k)
Profit/loss from business: +$8,717 (reported on 19.8% of returns)
Here:
+$8,717
State:
+$10,012
(% of AGI for various income ranges: 10.3% for AGIs below $25k, 3.0% for AGIs $25k-50k, 1.8% for AGIs $50k-75k, 4.1% for AGIs $75k-100k, 2.0% for AGIs $100k-200k, 1.2% for AGIs over 200k)
Taxable individual retirement arrangement distribution: $15,880 (reported on 7.2% of returns)
34734:
$15,880
Florida:
$21,544
(% of AGI for various income ranges: 2.1% for AGIs below $25k, 2.6% for AGIs $25k-50k, 3.4% for AGIs $50k-75k, 3.0% for AGIs $100k-200k)
Total itemized deductions: $23,809 (20% of AGI, reported on 33.3% of returns)
Here:
$23,809
State:
$25,533
Here:
19.7% of AGI
State:
18.0% of AGI
(% of AGI for various income ranges: 7.6% for AGIs below $25k, 16.3% for AGIs $25k-50k, 12.8% for AGIs $50k-75k, 14.3% for AGIs $75k-100k, 13.1% for AGIs $100k-200k, 10.0% for AGIs over 200k)
Charity contributions: $4,593 (reported on 28.0% of returns)
Here:
$4,593
State:
$5,698
(% of AGI for various income ranges: 0.5% for AGIs below $25k, 1.5% for AGIs $25k-50k, 1.6% for AGIs $50k-75k, 1.9% for AGIs $75k-100k, 2.2% for AGIs $100k-200k, 2.6% for AGIs over 200k)
Taxes paid: $5,000 (reported on 32.9% of returns)
34734:
$5,000
State:
$6,203
(% of AGI for various income ranges: 1.5% for AGIs below $25k, 2.1% for AGIs $25k-50k, 2.6% for AGIs $50k-75k, 3.1% for AGIs $75k-100k, 3.0% for AGIs $100k-200k, 2.4% for AGIs over 200k)
Earned income credit: $2,261 (reported on 18.4% of returns)
Here:
$2,261
State:
$2,372
(% of AGI for various income ranges: 7.0% for AGIs below $25k, 1.1% for AGIs $25k-50k)
Percentage of individuals using paid preparers for their 2012 taxes: 49.8%
Here:
50%
State:
54%
(% for various income ranges: 45.6% for AGIs below $25k, 46.8% for AGIs $25k-50k, 53.8% for AGIs $50k-75k, 56.2% for AGIs $75k-100k, 51.7% for AGIs $100k-200k, 70.0% for AGIs over 200k)
Averages for the 2004 tax year for zip code 34734, filed in 2005:
Average Adjusted Gross Income (AGI) in 2004: $56,236 (Individual Income Tax Returns)
Here:
$56,236
State:
$50,523
Salary/wage: $50,369 (reported on 88.7% of returns)
Here:
$50,369
State:
$39,563
(% of AGI for various income ranges: 104.1% for AGIs below $10k, 83.7% for AGIs $10k-25k, 89.1% for AGIs $25k-50k, 80.6% for AGIs $50k-75k, 88.3% for AGIs $75k-100k, 72.1% for AGIs over 100k)
Taxable interest for individuals: $701 (reported on 44.5% of returns)
This zip code:
$701
Florida:
$3,211
(% of AGI for various income ranges: 4.0% for AGIs below $10k, 1.6% for AGIs $10k-25k, 0.6% for AGIs $25k-50k, 0.5% for AGIs $50k-75k, 0.2% for AGIs $75k-100k, 0.4% for AGIs over 100k)
Taxable dividends: $930 (reported on 22.5% of returns)
Here:
$930
State:
$6,129
(% of AGI for various income ranges: 3.0% for AGIs below $10k, 0.6% for AGIs $10k-25k, 0.3% for AGIs $25k-50k, 0.4% for AGIs $50k-75k, 0.2% for AGIs $75k-100k, 0.4% for AGIs over 100k)
Net capital gain/loss: +$7,811 (reported on 20.3% of returns)
Here:
+$7,811
State:
+$27,205
(% of AGI for various income ranges: 0.4% for AGIs below $10k, 0.4% for AGIs $10k-25k, 0.1% for AGIs $25k-50k, 2.1% for AGIs $50k-75k, 1.0% for AGIs $75k-100k, 4.9% for AGIs over 100k)
Profit/loss from business: +$10,198 (reported on 19.4% of returns)
Here:
+$10,198
State:
+$10,634
(% of AGI for various income ranges: 21.2% for AGIs below $10k, 8.1% for AGIs $10k-25k, 3.5% for AGIs $25k-50k, 3.8% for AGIs $50k-75k, 2.6% for AGIs $75k-100k, 2.7% for AGIs over 100k)
IRA payment deduction: $3,071 (reported on 2.2% of returns)
34734:
$3,071
Florida:
$3,082
Total itemized deductions: $18,287 (22% of AGI, reported on 49.0% of returns)
Here:
$18,287
State:
$20,370
Here:
22.4% of AGI
State:
20.7% of AGI
(% of AGI for various income ranges: 25.4% for AGIs below $10k, 15.1% for AGIs $10k-25k, 18.7% for AGIs $25k-50k, 20.2% for AGIs $50k-75k, 18.7% for AGIs $75k-100k, 12.7% for AGIs over 100k)
Charity contributions deductions: $2,836 (3% of AGI, reported on 42.8% of returns)
Here:
$2,836
State:
$4,064
Here:
3.3% of AGI
State:
3.8% of AGI
(% of AGI for various income ranges: 1.6% for AGIs $10k-25k, 2.4% for AGIs $25k-50k, 2.3% for AGIs $50k-75k, 2.3% for AGIs $75k-100k, 2.1% for AGIs over 100k)
Total tax: $8,365 (reported on 79.9% of returns)
34734:
$8,365
State:
$9,431
(% of AGI for various income ranges: 4.7% for AGIs below $10k, 4.4% for AGIs $10k-25k, 6.4% for AGIs $25k-50k, 7.9% for AGIs $50k-75k, 9.7% for AGIs $75k-100k, 16.9% for AGIs over 100k)
Earned income credit: $1,718 (reported on 12.9% of returns)
Here:
$1,718
State:
$1,808
Percentage of individuals using paid preparers for their 2004 taxes: 54.4%
Here:
54%
State:
60%
(% for various income ranges: 53.0% for AGIs below $10k, 56.0% for AGIs $10k-25k, 50.4% for AGIs $25k-50k, 56.8% for AGIs $50k-75k, 50.3% for AGIs $75k-100k, 59.9% for AGIs over 100k)
Household received Food Stamps/SNAP in the past 12 months: 157 Household did not receive Food Stamps/SNAP in the past 12 months: 1,212
Women who had a birth in the past 12 months: 58 (61 now married, 0 unmarried) Women who did not have a birth in the past 12 months: 1,124 (619 now married, 505 unmarried)
Housing units in zip code 34734 with a mortgage: 910 (55 second mortgage, 26 both second mortgage and home equity loan) Houses without a mortgage: 26
Median monthly owner costs for units with a mortgage: $2,093 Median monthly owner costs for units without a mortgage: $605
Residents with income below the poverty level in 2022:
This zip code:
7.6%
Whole state:
12.7%
Residents with income below 50% of the poverty level in 2022:
This zip code:
4.7%
Whole state:
6.6%
Median number of rooms in houses and condos:
Here:
7.3
State:
5.9
Median number of rooms in apartments:
Here:
5.1
State:
4.2
Notable locations in this zip code not listed on our city pages
In group quarters: 5 (-1 institutionalized population)
Size of family households: 198 2-persons, 441 3-persons, 258 4-persons, 209 5-persons, 89 6-persons
Size of nonfamily households: 146 1-person, 15 2-persons
1,413 married couples with children.
159 single-parent households (58 men, 101 women).
57.7% of residents of 34734 zip code speak English at home.
24.6% of residents speak Spanish at home (75% very well, 15% well, 9% not well, 1% not at all).
13.1% of residents speak other Indo-European language at home (56% very well, 35% well, 9% not well).
3.9% of residents speak Asian or Pacific Island language at home (100% very well).
Foreign born population: 1,068 (23.1%) (55.5% of them are naturalized citizens)
This zip code:
23.1%
Whole state:
21.7%
25%Bolivia
16%Uruguay
11%Sweden
9%Malaysia
5%Bhutan
4%Dominica
4%Bosnia and Herzegovina
11%Brazilian
8%American
7%Bulgarian
5%German
4%West Indian
4%Scottish
3%English
Year of entry for the foreign-born population
7072010 or later
4642000 to 2009
2401990 to 1999
139Before 1990
Facilities with environmental interests located in this zip code:
GOTHA RESERVE SUBDIVISION (CAROLINA AVE. in GOTHA, FL)
National Pollutant Discharge Elimination System NON-MAJOR (Tracking pollutant discharge elimination systems) - permit Organizations: A ARDAMAN (CONTACT/OWNER)
88.7%Electricity
9.5%Utility gas
1.9%Bottled, tank, or LP gas
Place of birth for U.S.-born residents:
This state: 1,697
Northeast: 597
Midwest: 248
South: 445
West: 128
47% of the 34734 zip code residents lived in the same house 5 years ago. Out of people who lived in different houses, 61% lived in this county. Out of people who lived in different counties, 50% lived in Florida.
88% of the 34734 zip code residents lived in the same house 1 year ago. Out of people who lived in different houses, 79% moved from this county. Out of people who lived in different houses, 11% moved from different state.
Private vs. public school enrollment:
Students in private schools in grades 1 to 8 (elementary and middle school): 231
Here:
32.7%
Florida:
15.8%
Students in private schools in grades 9 to 12 (high school): 41
Here:
11.8%
Florida:
12.9%
Students in private undergraduate colleges: 5
Here:
7.9%
Florida:
23.6%
Occupation by median earnings in the past 12 months ($)
118,120Health diagnosing and treating practitioners and other technical occupations
88,726Arts, design, entertainment, sports, and media occupations
81,361Management occupations
57,894Sales and related occupations
39,850Office and administrative support occupations
37,777Construction and extraction occupations
Top industries in this zip code by the number of employees in 2005:
Administrative and Support and Waste Management and Remediation Services: Landscaping Services (100-249 employees: 1 establishment, 1-4 employees: 2 establishments)
Other Services (except Public Administration): Cemeteries and Crematories (20-49: 1, 1-4: 1)
Construction: Masonry Contractors (20-49: 1)
Educational Services: Elementary and Secondary Schools (20-49: 1)
Construction: New Single-Family Housing Construction (except Operative Builders) (10-19: 1, 1-4: 1)
Other Services (except Public Administration): Religious Organizations (5-9: 1, 1-4: 5)
Other Services (except Public Administration): Funeral Homes and Funeral Services (10-19: 1)
Wholesale Trade: Medical, Dental, and Hospital Equipment and Supplies Merchant Wholesalers (10-19: 1)
Construction: Poured Concrete Foundation and Structure Contractors (10-19: 1)
Construction: Drywall and Insulation Contractors (5-9: 1, 1-4: 1)
People in group quarters in 2010:
3 people in in-patient hospice facilities
2 people in group homes intended for adults
People in group quarters in 2000:
5 people in other nonhousehold living situations
Fatal accident statistics in 2013:
Fatal accident count: 1
Vehicles involved in fatal accidents: 1
Fatal accidents caused by drunken drivers: 0
Fatalities: 1
Persons involved in fatal accidents: 2
Pedestrians involved in fatal accidents: 0
Fatal accident statistics in 2012:
Fatal accident count: 1
Vehicles involved in fatal accidents: 1
Fatal accidents caused by drunken drivers: 0
Fatalities: 1
Persons involved in fatal accidents: 1
Pedestrians involved in fatal accidents: 0
Home Mortgage Disclosure Act Aggregated Statistics For Year 2009 (Based on 2 partial tracts)
A) FHA, FSA/RHS & VA Home Purchase Loans
B) Conventional Home Purchase Loans
C) Refinancings
D) Home Improvement Loans
F) Non-occupant Loans on < 5 Family Dwellings (A B C & D)
G) Loans On Manufactured Home Dwelling (A B C & D)
Number
Average Value
Number
Average Value
Number
Average Value
Number
Average Value
Number
Average Value
Number
Average Value
LOANS ORIGINATED
27
$159,960
13
$403,680
48
$211,623
0
$0
0
$0
0
$0
APPLICATIONS APPROVED, NOT ACCEPTED
1
$135,120
0
$0
5
$223,184
0
$0
0
$0
0
$0
APPLICATIONS DENIED
7
$162,174
11
$273,743
14
$219,220
4
$50,670
5
$68,524
2
$62,130
APPLICATIONS WITHDRAWN
5
$134,876
4
$498,242
16
$283,278
0
$0
1
$59,110
0
$0
FILES CLOSED FOR INCOMPLETENESS
6
$172,313
4
$303,710
6
$295,568
0
$0
0
$0
0
$0
Aggregated Statistics For Year 2008 (Based on 2 partial tracts)
A) FHA, FSA/RHS & VA Home Purchase Loans
B) Conventional Home Purchase Loans
C) Refinancings
D) Home Improvement Loans
F) Non-occupant Loans on < 5 Family Dwellings (A B C & D)
G) Loans On Manufactured Home Dwelling (A B C & D)
Number
Average Value
Number
Average Value
Number
Average Value
Number
Average Value
Number
Average Value
Number
Average Value
LOANS ORIGINATED
14
$218,617
33
$309,935
48
$217,630
4
$55,795
13
$190,704
0
$0
APPLICATIONS APPROVED, NOT ACCEPTED
0
$0
1
$165,280
13
$354,588
0
$0
1
$248,520
1
$165,280
APPLICATIONS DENIED
2
$184,580
10
$203,399
48
$249,624
7
$198,021
7
$136,840
0
$0
APPLICATIONS WITHDRAWN
2
$205,090
10
$201,469
21
$230,537
2
$129,690
0
$0
0
$0
FILES CLOSED FOR INCOMPLETENESS
1
$264,200
0
$0
10
$217,393
1
$9,650
0
$0
0
$0
Aggregated Statistics For Year 2007 (Based on 2 partial tracts)
A) FHA, FSA/RHS & VA Home Purchase Loans
B) Conventional Home Purchase Loans
C) Refinancings
D) Home Improvement Loans
E) Loans on Dwellings For 5+ Families
F) Non-occupant Loans on < 5 Family Dwellings (A B C & D)
G) Loans On Manufactured Home Dwelling (A B C & D)
Number
Average Value
Number
Average Value
Number
Average Value
Number
Average Value
Number
Average Value
Number
Average Value
Number
Average Value
LOANS ORIGINATED
2
$249,120
135
$293,870
134
$241,505
12
$115,714
1
$277,470
47
$265,100
0
$0
APPLICATIONS APPROVED, NOT ACCEPTED
0
$0
14
$237,833
35
$245,830
4
$52,780
0
$0
6
$151,805
0
$0
APPLICATIONS DENIED
1
$314,870
27
$233,327
115
$310,716
10
$90,963
0
$0
19
$217,660
1
$57,910
APPLICATIONS WITHDRAWN
0
$0
12
$240,677
35
$307,977
2
$352,270
0
$0
5
$323,798
0
$0
FILES CLOSED FOR INCOMPLETENESS
0
$0
2
$243,695
16
$264,654
0
$0
0
$0
0
$0
0
$0
Aggregated Statistics For Year 2006 (Based on 2 partial tracts)
A) FHA, FSA/RHS & VA Home Purchase Loans
B) Conventional Home Purchase Loans
C) Refinancings
D) Home Improvement Loans
E) Loans on Dwellings For 5+ Families
F) Non-occupant Loans on < 5 Family Dwellings (A B C & D)
G) Loans On Manufactured Home Dwelling (A B C & D)
Number
Average Value
Number
Average Value
Number
Average Value
Number
Average Value
Number
Average Value
Number
Average Value
Number
Average Value
LOANS ORIGINATED
2
$220,770
110
$242,837
188
$227,599
34
$131,711
1
$33,176,000
29
$221,562
0
$0
APPLICATIONS APPROVED, NOT ACCEPTED
0
$0
13
$111,638
41
$206,883
4
$50,970
0
$0
4
$223,485
0
$0
APPLICATIONS DENIED
0
$0
35
$223,356
101
$256,318
17
$95,518
0
$0
16
$164,522
4
$74,798
APPLICATIONS WITHDRAWN
0
$0
11
$398,331
72
$198,604
7
$306,943
0
$0
2
$151,405
0
$0
FILES CLOSED FOR INCOMPLETENESS
0
$0
2
$213,535
14
$215,342
0
$0
0
$0
0
$0
1
$289,540
Aggregated Statistics For Year 2005 (Based on 2 partial tracts)
A) FHA, FSA/RHS & VA Home Purchase Loans
B) Conventional Home Purchase Loans
C) Refinancings
D) Home Improvement Loans
F) Non-occupant Loans on < 5 Family Dwellings (A B C & D)
G) Loans On Manufactured Home Dwelling (A B C & D)
Number
Average Value
Number
Average Value
Number
Average Value
Number
Average Value
Number
Average Value
Number
Average Value
LOANS ORIGINATED
0
$0
164
$208,685
186
$180,143
18
$74,931
41
$178,488
0
$0
APPLICATIONS APPROVED, NOT ACCEPTED
1
$149,590
17
$138,168
35
$197,264
4
$177,040
6
$131,095
1
$36,190
APPLICATIONS DENIED
1
$184,580
45
$195,732
83
$191,803
22
$78,965
17
$133,698
4
$9,350
APPLICATIONS WITHDRAWN
1
$125,470
25
$219,999
66
$167,251
7
$212,499
8
$218,509
0
$0
FILES CLOSED FOR INCOMPLETENESS
0
$0
13
$174,372
22
$239,141
0
$0
6
$152,007
0
$0
Aggregated Statistics For Year 2004 (Based on 2 partial tracts)
A) FHA, FSA/RHS & VA Home Purchase Loans
B) Conventional Home Purchase Loans
C) Refinancings
D) Home Improvement Loans
E) Loans on Dwellings For 5+ Families
F) Non-occupant Loans on < 5 Family Dwellings (A B C & D)
G) Loans On Manufactured Home Dwelling (A B C & D)
Number
Average Value
Number
Average Value
Number
Average Value
Number
Average Value
Number
Average Value
Number
Average Value
Number
Average Value
LOANS ORIGINATED
6
$142,557
112
$178,450
159
$146,718
24
$87,112
1
$10,133,760
21
$132,531
4
$24,730
APPLICATIONS APPROVED, NOT ACCEPTED
0
$0
12
$156,932
40
$129,718
7
$63,594
0
$0
6
$113,200
0
$0
APPLICATIONS DENIED
7
$143,906
34
$159,671
81
$154,196
25
$103,606
0
$0
6
$91,083
4
$21,412
APPLICATIONS WITHDRAWN
2
$161,055
21
$189,750
71
$152,788
6
$80,628
0
$0
6
$123,455
1
$172,520
FILES CLOSED FOR INCOMPLETENESS
1
$149,590
11
$150,033
14
$143,561
0
$0
0
$0
1
$141,150
0
$0
Aggregated Statistics For Year 2003 (Based on 2 partial tracts)
A) FHA, FSA/RHS & VA Home Purchase Loans
B) Conventional Home Purchase Loans
C) Refinancings
D) Home Improvement Loans
F) Non-occupant Loans on < 5 Family Dwellings (A B C & D)
Number
Average Value
Number
Average Value
Number
Average Value
Number
Average Value
Number
Average Value
LOANS ORIGINATED
7
$120,640
146
$144,578
325
$139,530
16
$34,986
34
$121,350
APPLICATIONS APPROVED, NOT ACCEPTED
0
$0
14
$153,213
37
$155,952
5
$34,986
7
$130,809
APPLICATIONS DENIED
1
$48,260
30
$128,482
125
$155,104
5
$41,018
8
$83,845
APPLICATIONS WITHDRAWN
0
$0
16
$142,204
99
$126,757
2
$120,640
2
$124,860
FILES CLOSED FOR INCOMPLETENESS
0
$0
2
$153,215
30
$180,477
0
$0
1
$281,090
Aggregated Statistics For Year 1999 (Based on 1 partial tract)
A) FHA, FSA/RHS & VA Home Purchase Loans
B) Conventional Home Purchase Loans
C) Refinancings
D) Home Improvement Loans
F) Non-occupant Loans on < 5 Family Dwellings (A B C & D)


 Nearest zip codes: 32835, 34761, 32818, 34786, 32811, 32808.


