Estimated zip code population in 2022: 2,253 Zip code population in 2010: 2,117 Zip code population in 2000: 2,097
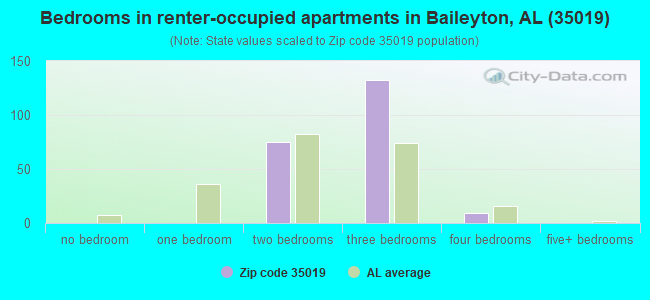
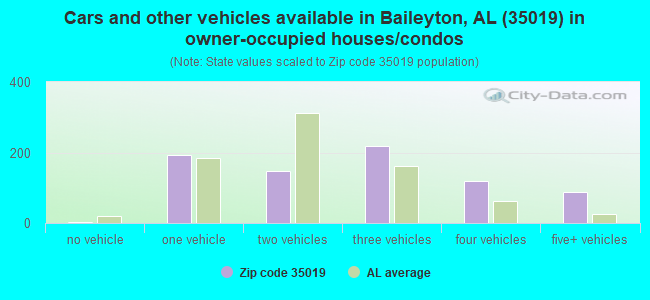
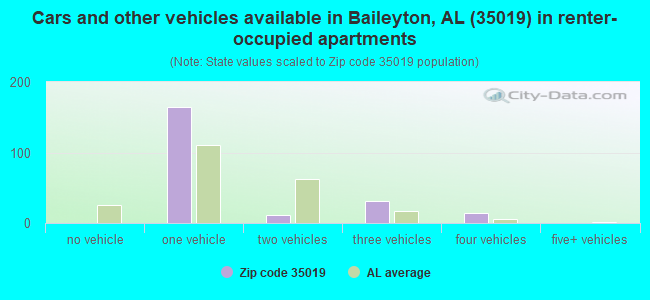
Houses and condos: 1,045 Renter-occupied apartments: 216
% of renters here:
22%
State:
30%
March 2022 cost of living index in zip code 35019: 80.4 (low, U.S. average is 100)
Land area: 29.9 sq. mi. Water area: 0.2 sq. mi.
Population density: 75 people per square mile
(very low).
OSM Map
General Map
Google Map
MSN Map
OSM Map
General Map
Google Map
MSN Map
OSM Map
General Map
Google Map
MSN Map
OSM Map
General Map
Google Map
MSN Map
Please wait while loading the map...
Real estate property taxes paid for housing units in 2022:
This zip code:
0.2% ($222)
Alabama:
0.4% ($718)
Median real estate property taxes paid for housing units with mortgages in 2022: $278 (0.2%) Median real estate property taxes paid for housing units with no mortgage in 2022: $203 (0.2%)
Business Search- 14 Million verified businesses
Males: 1,025
(45.5%)
Females: 1,228
(54.5%)
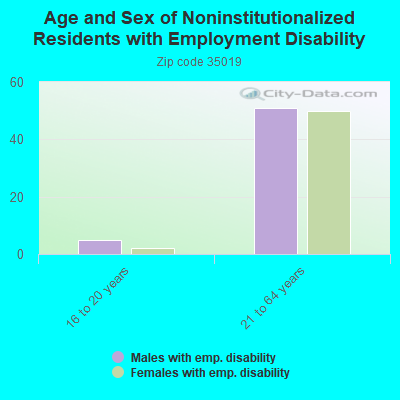
For population 25 years and over in 35019:
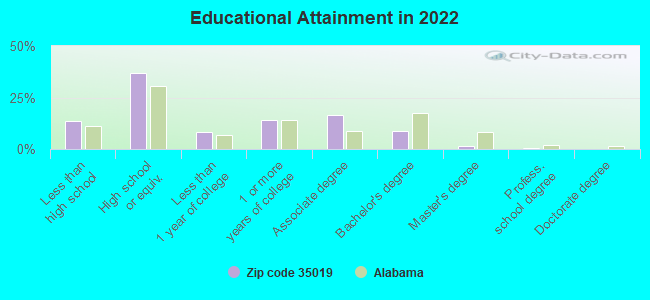
High school or higher: 85.2%
Bachelor's degree or higher: 10.7%
Graduate or professional degree: 2.0%
Unemployed: 8.9%
Mean travel time to work (commute): 32.5 minutes
For population 15 years and over in 35019:
Never married: 25.2%
Now married: 44.2%
Separated: 1.7%
Widowed: 7.4%
Divorced: 21.5%
Zip code 35019 compared to state average:
Unemployed percentage above state average.
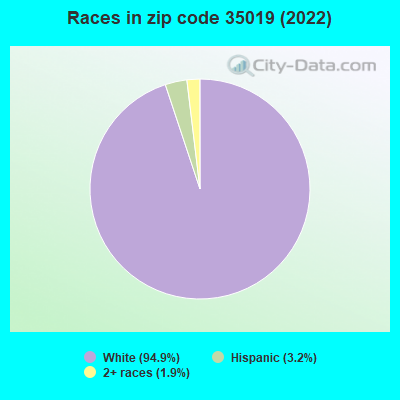
Black race population percentage significantly below state average.
Length of stay since moving in significantly above state average.
Percentage of population with a bachelor's degree or higher significantly below state average.
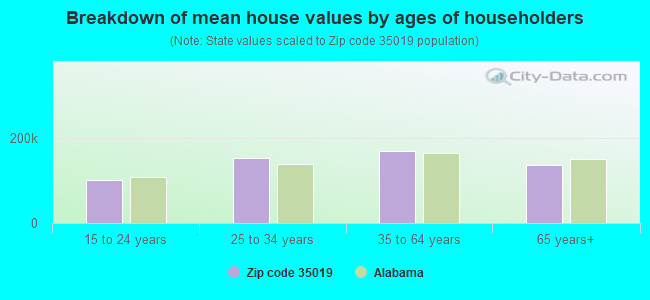
Estimated median house/condo value in 2022: $135,165
35019:
$135,165
Alabama:
$200,900
According to our research of Alabama and other state lists, there were 4 registered sex offenders living in 35019 zip code as of May 28, 2024. The ratio of all residents to sex offenders in zip code 35019 is 592 to 1. The ratio of registered sex offenders to all residents in this zip code is lower than the state average.
Median resident age:
This zip code:
39.9 years
Alabama median age:
39.6 years
Average household size:
This zip code:
2.3 people
Alabama:
2.5 people
Averages for the 2020 tax year for zip code 35019, filed in 2021:
Average Adjusted Gross Income (AGI) in 2020: $54,788 (Individual Income Tax Returns)
Here:
$54,788
State:
$63,984
Salary/wage: $45,163 (reported on 81.0% of returns)
Here:
$45,163
State:
$52,834
(% of AGI for various income ranges: 1071.0% for AGIs below $25k, 3647.6% for AGIs $25k-50k, 6747.3% for AGIs $50k-75k, 9203.3% for AGIs $75k-100k, 18388.6% for AGIs $100k-200k)
Taxable interest for individuals: $2,059 (reported on 22.0% of returns)
This zip code:
$2,059
Alabama:
$1,615
(% of AGI for various income ranges: 7.2% for AGIs below $25k, 8.6% for AGIs $25k-50k, 8.2% for AGIs $50k-75k, 41.7% for AGIs $75k-100k, 542.9% for AGIs $100k-200k)
Ordinary dividends: $612 (reported on 8.0% of returns)
Here:
$612
State:
$7,660
(% of AGI for various income ranges: 3.1% for AGIs below $25k, 10.0% for AGIs $50k-75k, 41.4% for AGIs $100k-200k)
Net capital gain/loss in AGI: +$6,957 (reported on 7.0% of returns)
Here:
+$6,957
State:
+$23,528
(% of AGI for various income ranges: 3.8% for AGIs below $25k, 10.0% for AGIs $50k-75k, 664.3% for AGIs $100k-200k)
Profit/loss from business: +$8,050 (reported on 18.0% of returns)
Here:
+$8,050
State:
+$9,534
(% of AGI for various income ranges: 225.5% for AGIs below $25k, 117.1% for AGIs $25k-50k, 396.4% for AGIs $50k-75k, 161.4% for AGIs $100k-200k)
Taxable individual retirement arrangement distribution: $12,700 (reported on 6.0% of returns)
35019:
$12,700
Alabama:
$19,004
(% of AGI for various income ranges: 109.7% for AGIs below $25k, 740.0% for AGIs $75k-100k)
Total itemized deductions: $30,850 (reported on 4.0% of returns)
Here:
$30,850
State:
$37,338
(% of AGI for various income ranges: 1762.9% for AGIs $100k-200k)
Charity contributions: $9,133 (reported on 3.0% of returns)
Here:
$9,133
State:
$18,005
(% of AGI for various income ranges: 456.7% for AGIs $75k-100k)
Taxes paid: $6,500 (reported on 3.0% of returns)
35019:
$6,500
State:
$6,484
(% of AGI for various income ranges: 278.6% for AGIs $100k-200k)
Earned income credit: $2,500 (reported on 25.0% of returns)
Here:
$2,500
State:
$2,628
(% of AGI for various income ranges: 138.6% for AGIs below $25k, 106.2% for AGIs $25k-50k)
Percentage of individuals using paid preparers for their 2020 taxes: 96.0%
Here:
96%
State:
93%
(% for various income ranges: 92.5% for AGIs below $25k, 96.2% for AGIs $25k-50k, 100.0% for AGIs $50k-75k, 100.0% for AGIs $75k-100k, 100.0% for AGIs $100k-200k)
Averages for the 2012 tax year for zip code 35019, filed in 2013:
Average Adjusted Gross Income (AGI) in 2012: $36,881 (Individual Income Tax Returns)
Here:
$36,881
State:
$52,001
Salary/wage: $35,992 (reported on 82.4% of returns)
Here:
$35,992
State:
$43,822
(% of AGI for various income ranges: 72.1% for AGIs below $25k, 83.4% for AGIs $25k-50k, 84.1% for AGIs $50k-75k, 77.6% for AGIs $75k-100k, 81.3% for AGIs $100k-200k)
Taxable interest for individuals: $1,313 (reported on 25.3% of returns)
This zip code:
$1,313
Alabama:
$1,592
(% of AGI for various income ranges: 0.9% for AGIs below $25k, 0.3% for AGIs $25k-50k, 0.3% for AGIs $50k-75k, 0.2% for AGIs $75k-100k, 2.7% for AGIs $100k-200k)
Ordinary dividends: $444 (reported on 9.9% of returns)
Here:
$444
State:
$5,697
(% of AGI for various income ranges: 0.2% for AGIs below $25k, 0.2% for AGIs $25k-50k, 0.2% for AGIs $50k-75k)
Net capital gain/loss in AGI: +$2,450 (reported on 6.6% of returns)
Here:
+$2,450
State:
+$13,286
Profit/loss from business: +$6,373 (reported on 16.5% of returns)
Here:
+$6,373
State:
+$9,151
(% of AGI for various income ranges: 12.1% for AGIs below $25k, 2.3% for AGIs $25k-50k, 1.2% for AGIs $50k-75k)
Taxable individual retirement arrangement distribution: $9,080 (reported on 5.5% of returns)
35019:
$9,080
Alabama:
$14,992
Total itemized deductions: $17,235 (27% of AGI, reported on 18.7% of returns)
Here:
$17,235
State:
$21,388
Here:
27.0% of AGI
State:
20.1% of AGI
(% of AGI for various income ranges: 9.3% for AGIs below $25k, 6.0% for AGIs $25k-50k, 8.4% for AGIs $50k-75k, 10.2% for AGIs $75k-100k, 10.9% for AGIs $100k-200k)
Charity contributions: $4,558 (reported on 13.2% of returns)
Here:
$4,558
State:
$5,925
(% of AGI for various income ranges: 2.2% for AGIs below $25k, 1.5% for AGIs $50k-75k, 2.2% for AGIs $75k-100k, 2.9% for AGIs $100k-200k)
Taxes paid: $3,029 (reported on 18.7% of returns)
35019:
$3,029
State:
$5,272
(% of AGI for various income ranges: 0.6% for AGIs below $25k, 0.7% for AGIs $25k-50k, 1.3% for AGIs $50k-75k, 1.6% for AGIs $75k-100k, 3.4% for AGIs $100k-200k)
Earned income credit: $2,478 (reported on 29.7% of returns)
Here:
$2,478
State:
$2,646
(% of AGI for various income ranges: 9.2% for AGIs below $25k, 1.8% for AGIs $25k-50k)
Percentage of individuals using paid preparers for their 2012 taxes: 70.3%
Here:
70%
State:
60%
(% for various income ranges: 73.8% for AGIs below $25k, 66.7% for AGIs $25k-50k, 69.2% for AGIs $50k-75k, 66.7% for AGIs $75k-100k, 66.7% for AGIs $100k-200k)
Averages for the 2004 tax year for zip code 35019, filed in 2005:
Average Adjusted Gross Income (AGI) in 2004: $34,961 (Individual Income Tax Returns)
Here:
$34,961
State:
$42,302
Salary/wage: $30,873 (reported on 81.6% of returns)
Here:
$30,873
State:
$36,626
(% of AGI for various income ranges: 76.9% for AGIs below $10k, 75.9% for AGIs $10k-25k, 88.6% for AGIs $25k-50k, 86.2% for AGIs $50k-75k, 87.6% for AGIs $75k-100k, 27.9% for AGIs over 100k)
Taxable interest for individuals: $2,386 (reported on 35.1% of returns)
This zip code:
$2,386
Alabama:
$1,827
(% of AGI for various income ranges: 6.6% for AGIs below $10k, 1.2% for AGIs $10k-25k, 0.7% for AGIs $25k-50k, 1.2% for AGIs $50k-75k, 0.4% for AGIs $75k-100k, 6.9% for AGIs over 100k)
Taxable dividends: $2,651 (reported on 12.1% of returns)
Here:
$2,651
State:
$4,206
(% of AGI for various income ranges: 4.1% for AGIs below $10k, 0.3% for AGIs $10k-25k, 0.0% for AGIs $25k-50k, 0.1% for AGIs $50k-75k, 3.2% for AGIs over 100k)
Net capital gain/loss: +$7,833 (reported on 9.6% of returns)
Here:
+$7,833
State:
+$13,031
(% of AGI for various income ranges: 2.1% for AGIs below $10k, 0.7% for AGIs $10k-25k, 0.3% for AGIs $25k-50k, 0.6% for AGIs $50k-75k, 7.9% for AGIs over 100k)
Profit/loss from business: +$5,869 (reported on 21.8% of returns)
Here:
+$5,869
State:
+$8,302
(% of AGI for various income ranges: 23.4% for AGIs below $10k, 9.6% for AGIs $10k-25k, 4.2% for AGIs $25k-50k, 0.2% for AGIs $50k-75k, 3.6% for AGIs $75k-100k)
Total itemized deductions: $14,492 (20% of AGI, reported on 22.5% of returns)
Here:
$14,492
State:
$17,623
Here:
19.6% of AGI
State:
20.8% of AGI
(% of AGI for various income ranges: 8.0% for AGIs $10k-25k, 10.8% for AGIs $25k-50k, 11.7% for AGIs $50k-75k, 7.5% for AGIs $75k-100k, 8.1% for AGIs over 100k)
Charity contributions deductions: $3,360 (4% of AGI, reported on 18.7% of returns)
Here:
$3,360
State:
$4,768
Here:
4.3% of AGI
State:
5.4% of AGI
(% of AGI for various income ranges: 1.2% for AGIs $10k-25k, 1.3% for AGIs $25k-50k, 2.9% for AGIs $50k-75k, 1.5% for AGIs $75k-100k, 2.1% for AGIs over 100k)
Total tax: $5,159 (reported on 72.6% of returns)
35019:
$5,159
State:
$6,905
(% of AGI for various income ranges: 5.6% for AGIs below $10k, 4.3% for AGIs $10k-25k, 5.8% for AGIs $25k-50k, 8.2% for AGIs $50k-75k, 10.6% for AGIs $75k-100k, 24.1% for AGIs over 100k)
Earned income credit: $1,907 (reported on 25.8% of returns)
Here:
$1,907
State:
$2,048
Percentage of individuals using paid preparers for their 2004 taxes: 78.6%
Here:
79%
State:
65%
(% for various income ranges: 71.5% for AGIs below $10k, 77.9% for AGIs $10k-25k, 84.0% for AGIs $25k-50k, 84.5% for AGIs $50k-75k, 74.4% for AGIs $75k-100k, 70.8% for AGIs over 100k)
Likely homosexual households (counted as self-reported same-sex unmarried-partner households)
Lesbian couples: 0.3% of all households
Gay men: 0.0% of all households
Household received Food Stamps/SNAP in the past 12 months: 110 Household did not receive Food Stamps/SNAP in the past 12 months: 877
Women who had a birth in the past 12 months: 30 (0 now married, 24 unmarried) Women who did not have a birth in the past 12 months: 438 (209 now married, 229 unmarried)
Housing units in zip code 35019 with a mortgage: 287 Median monthly owner costs for units with a mortgage: $1,078 Median monthly owner costs for units without a mortgage: $330
Residents with income below the poverty level in 2022:
This zip code:
21.6%
Whole state:
16.2%
Residents with income below 50% of the poverty level in 2022:
This zip code:
14.8%
Whole state:
8.6%
Median number of rooms in houses and condos:
Here:
5.9
State:
6.5
Median number of rooms in apartments:
Here:
5.7
State:
4.7
Notable locations in this zip code not listed on our city pages
Churches in zip code 35019 include: Mount Pisgah Upper Cumberland Presbyterian Church (A), Mount Hermon Baptist Church (B), Little Vine Primitive Baptist Church (C), Welcome Baptist Church (D), Pan Creek Baptist Church (E), Baileyton United Methodist Church (F), Grandiflora Church of Christ (G), Lystra Baptist Church (H), Pleasant Ridge Church (I). Display/hide their locations on the map
Cemeteries: Little Vine Cemetery (1), Baileyton Cemetery (2), Welcome Cemetery (3), Lystra Cemetery (4), Mount Pisgah Cemetery (5), Mount Hermon Cemetery (6), Canaan Cemetery (7). Display/hide their locations on the map
Streams, rivers, and creeks: Pied Creek (A), Mardis Branch (B), Long Branch (C), Kennedy Creek (D), Herring Branch (E), Fall Creek (F), Yarbrough Branch (G). Display/hide their locations on the map
Size of family households: 148 2-persons, 209 3-persons, 155 4-persons, 5 5-persons, 23 6-persons, 14 7-or-more-persons
Size of nonfamily households: 358 1-person, 76 2-persons
274 married couples with children.
103 single-parent households (7 men, 96 women).
95.8% of residents of 35019 zip code speak English at home.
3.4% of residents speak Spanish at home (24% very well, 18% well, 31% not well, 27% not at all).
Foreign born population: 75 (3.4%) (9.9% of them are naturalized citizens)
This zip code:
3.4%
Whole state:
3.8%
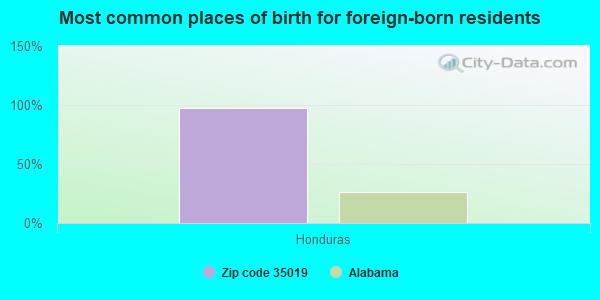
97%Honduras
36%American
21%German
6%Scottish
5%English
2%Irish
0%European
0%Scotch-Irish
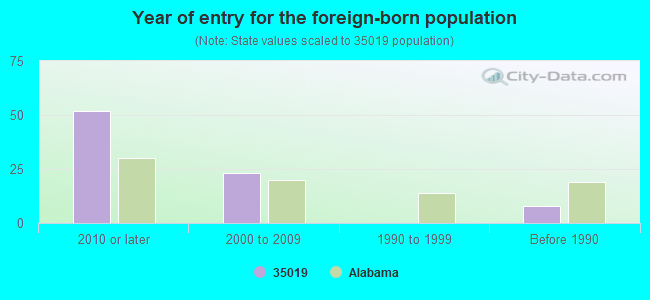
Year of entry for the foreign-born population
522010 or later
232000 to 2009
01990 to 1999
8Before 1990
Facilities with environmental interests located in this zip code:
PARKSIDE ELEMENTARY SCHOOL (12431 AL HIGHWAY 69 N in BAILEYTON, AL)
(National Center for Education Statistics) - STATE ID-0020 Organizations: CULLMAN COUNTY (SCHOOL DISTRICT)
BERRY RASCO FARM (BERRY RASCO in BAILEYTON, AL)
National Pollutant Discharge Elimination System NON-MAJOR (Tracking pollutant discharge elimination systems) - permit Business SIC classification: NONCLASSIFIABLE ESTABLISHMENTS
KENNETH HUNTER FARMS (KENNETH HUNTER in BAILEYTON, AL)
National Pollutant Discharge Elimination System NON-MAJOR (Tracking pollutant discharge elimination systems) - permit Business SIC classification: NONCLASSIFIABLE ESTABLISHMENTS Alternative names: HUNTER KENNETH FARM POULTRY, HUNTER KENNETH FARMS
MICHAEL KEITH BRYANT (429 COUNTY ROAD in BAILEYTON, AL)
National Pollutant Discharge Elimination System NON-MAJOR (Tracking pollutant discharge elimination systems) - permit Business SIC classification: POULTRY AND EGGS
Housing units lacking complete plumbing facilities: 1.1% Housing units lacking complete kitchen facilities: 4.9%
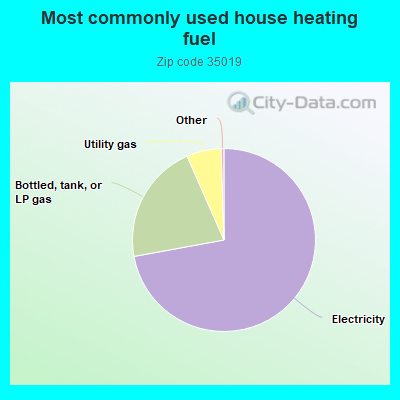
72.2%Electricity
21.3%Bottled, tank, or LP gas
6.1%Utility gas
Population in 1990: 1,781. Population change in the 1990s: +316 (+17.7%).
Place of birth for U.S.-born residents:
This state: 1,804
Midwest: 41
South: 248
West: 71
66% of the 35019 zip code residents lived in the same house 5 years ago. Out of people who lived in different houses, 59% lived in this county. Out of people who lived in different counties, 50% lived in Alabama.
92% of the 35019 zip code residents lived in the same house 1 year ago. Out of people who lived in different houses, 13% moved from this county. Out of people who lived in different houses, 87% moved from different county within same state. Out of people who lived in different houses, 3% moved from different state.
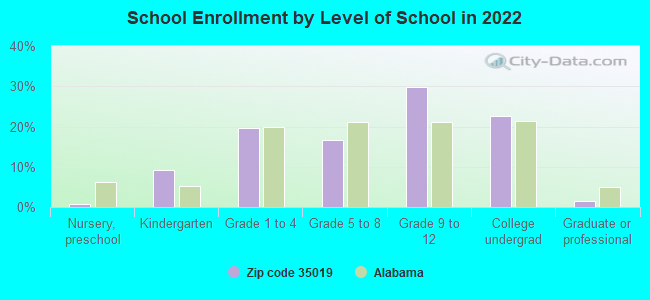
Private vs. public school enrollment:
Students in private schools in grades 1 to 8 (elementary and middle school): 18
Here:
10.4%
Alabama:
14.7%
Students in private schools in grades 9 to 12 (high school): 19
Here:
13.8%
Alabama:
16.3%
Students in private undergraduate colleges:
Here:
0.0%
Alabama:
14.6%
Occupation by median earnings in the past 12 months ($)
111,117Computer and mathematical occupations
91,685Material moving occupations
90,537Management occupations
75,096Installation, maintenance, and repair occupations
72,200Education, training, and library occupations
68,971Building and grounds cleaning and maintenance occupations
Top industries in this zip code by the number of employees in 2005:
Administrative and Support and Waste Management and Remediation Services: All Other Support Services (10-19 employees: 1 establishment)
Health Care and Social Assistance: Child Day Care Services (5-9: 2)
Accommodation and Food Services: Limited-Service Restaurants (5-9: 1)
Health Care and Social Assistance: All Other Outpatient Care Centers (5-9: 1)
Fatal accident statistics in 2010:
Fatal accident count: 1
Vehicles involved in fatal accidents: 1
Fatal accidents caused by drunken drivers: 0
Fatalities: 1
Persons involved in fatal accidents: 1
Pedestrians involved in fatal accidents: 0
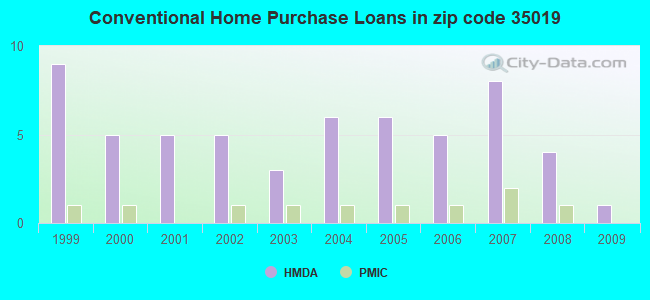
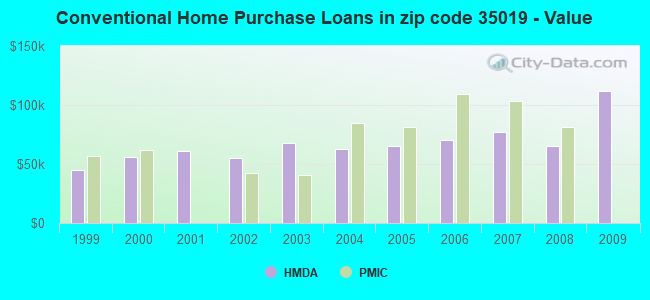
Home Mortgage Disclosure Act Aggregated Statistics For Year 2009 (Based on 1 partial tract)
A) FHA, FSA/RHS & VA Home Purchase Loans
B) Conventional Home Purchase Loans
C) Refinancings
D) Home Improvement Loans
F) Non-occupant Loans on < 5 Family Dwellings (A B C & D)
G) Loans On Manufactured Home Dwelling (A B C & D)
Number
Average Value
Number
Average Value
Number
Average Value
Number
Average Value
Number
Average Value
Number
Average Value
LOANS ORIGINATED
2
$84,600
1
$112,060
9
$121,649
1
$56,140
0
$0
2
$39,820
APPLICATIONS APPROVED, NOT ACCEPTED
0
$0
1
$61,550
1
$180,450
0
$0
1
$29,010
1
$39,050
APPLICATIONS DENIED
1
$107,980
2
$78,810
4
$94,830
1
$29,120
1
$28,680
2
$51,950
APPLICATIONS WITHDRAWN
0
$0
0
$0
2
$134,400
0
$0
0
$0
0
$0
FILES CLOSED FOR INCOMPLETENESS
0
$0
0
$0
1
$104,120
0
$0
0
$0
0
$0
Aggregated Statistics For Year 2008 (Based on 1 partial tract)
A) FHA, FSA/RHS & VA Home Purchase Loans
B) Conventional Home Purchase Loans
C) Refinancings
D) Home Improvement Loans
F) Non-occupant Loans on < 5 Family Dwellings (A B C & D)
G) Loans On Manufactured Home Dwelling (A B C & D)
Number
Average Value
Number
Average Value
Number
Average Value
Number
Average Value
Number
Average Value
Number
Average Value
LOANS ORIGINATED
1
$158,830
4
$65,105
10
$91,814
2
$19,080
1
$32,320
3
$48,163
APPLICATIONS APPROVED, NOT ACCEPTED
0
$0
0
$0
1
$86,480
0
$0
0
$0
0
$0
APPLICATIONS DENIED
0
$0
1
$91,550
5
$114,734
1
$28,240
0
$0
1
$38,270
APPLICATIONS WITHDRAWN
0
$0
0
$0
3
$150,523
0
$0
0
$0
0
$0
FILES CLOSED FOR INCOMPLETENESS
0
$0
0
$0
0
$0
0
$0
0
$0
0
$0
Aggregated Statistics For Year 2007 (Based on 1 partial tract)
A) FHA, FSA/RHS & VA Home Purchase Loans
B) Conventional Home Purchase Loans
C) Refinancings
D) Home Improvement Loans
F) Non-occupant Loans on < 5 Family Dwellings (A B C & D)
G) Loans On Manufactured Home Dwelling (A B C & D)
Number
Average Value
Number
Average Value
Number
Average Value
Number
Average Value
Number
Average Value
Number
Average Value
LOANS ORIGINATED
1
$88,900
8
$77,320
10
$81,754
2
$26,970
2
$56,475
5
$37,966
APPLICATIONS APPROVED, NOT ACCEPTED
0
$0
0
$0
1
$105,560
0
$0
0
$0
0
$0
APPLICATIONS DENIED
0
$0
1
$75,890
4
$89,922
1
$51,290
0
$0
1
$55,590
APPLICATIONS WITHDRAWN
0
$0
0
$0
3
$81,917
0
$0
0
$0
1
$32,980
FILES CLOSED FOR INCOMPLETENESS
0
$0
0
$0
1
$157,070
0
$0
0
$0
0
$0
Aggregated Statistics For Year 2006 (Based on 1 partial tract)
A) FHA, FSA/RHS & VA Home Purchase Loans
B) Conventional Home Purchase Loans
C) Refinancings
D) Home Improvement Loans
F) Non-occupant Loans on < 5 Family Dwellings (A B C & D)
G) Loans On Manufactured Home Dwelling (A B C & D)
Number
Average Value
Number
Average Value
Number
Average Value
Number
Average Value
Number
Average Value
Number
Average Value
LOANS ORIGINATED
1
$88,130
5
$69,974
9
$88,264
2
$42,410
1
$45,220
3
$42,023
APPLICATIONS APPROVED, NOT ACCEPTED
0
$0
2
$63,975
2
$50,905
1
$19,300
0
$0
1
$46,990
APPLICATIONS DENIED
0
$0
1
$135,340
6
$118,168
3
$26,177
0
$0
1
$50,190
APPLICATIONS WITHDRAWN
1
$58,350
0
$0
5
$85,636
1
$24,160
0
$0
0
$0
FILES CLOSED FOR INCOMPLETENESS
0
$0
0
$0
2
$116,145
0
$0
0
$0
0
$0
Aggregated Statistics For Year 2005 (Based on 1 partial tract)
A) FHA, FSA/RHS & VA Home Purchase Loans
B) Conventional Home Purchase Loans
C) Refinancings
D) Home Improvement Loans
F) Non-occupant Loans on < 5 Family Dwellings (A B C & D)
G) Loans On Manufactured Home Dwelling (A B C & D)
Number
Average Value
Number
Average Value
Number
Average Value
Number
Average Value
Number
Average Value
Number
Average Value
LOANS ORIGINATED
1
$60,220
6
$64,948
10
$86,266
1
$32,320
1
$72,690
3
$33,493
APPLICATIONS APPROVED, NOT ACCEPTED
0
$0
1
$47,430
3
$76,290
0
$0
0
$0
0
$0
APPLICATIONS DENIED
0
$0
2
$91,275
8
$83,608
2
$41,030
1
$33,860
2
$56,030
APPLICATIONS WITHDRAWN
0
$0
1
$39,930
4
$90,472
1
$62,320
0
$0
0
$0
FILES CLOSED FOR INCOMPLETENESS
0
$0
0
$0
1
$156,740
0
$0
0
$0
0
$0
Aggregated Statistics For Year 2004 (Based on 1 partial tract)
A) FHA, FSA/RHS & VA Home Purchase Loans
B) Conventional Home Purchase Loans
C) Refinancings
D) Home Improvement Loans
F) Non-occupant Loans on < 5 Family Dwellings (A B C & D)
G) Loans On Manufactured Home Dwelling (A B C & D)
Number
Average Value
Number
Average Value
Number
Average Value
Number
Average Value
Number
Average Value
Number
Average Value
LOANS ORIGINATED
1
$88,130
6
$62,963
14
$81,591
1
$20,740
1
$74,450
3
$36,583
APPLICATIONS APPROVED, NOT ACCEPTED
0
$0
1
$45,330
2
$92,540
0
$0
0
$0
0
$0
APPLICATIONS DENIED
0
$0
2
$53,880
8
$97,974
1
$37,170
0
$0
1
$91,000
APPLICATIONS WITHDRAWN
0
$0
0
$0
4
$89,730
0
$0
0
$0
0
$0
FILES CLOSED FOR INCOMPLETENESS
0
$0
0
$0
3
$102,470
0
$0
0
$0
0
$0
Aggregated Statistics For Year 2003 (Based on 1 partial tract)
A) FHA, FSA/RHS & VA Home Purchase Loans
B) Conventional Home Purchase Loans
C) Refinancings
D) Home Improvement Loans
F) Non-occupant Loans on < 5 Family Dwellings (A B C & D)
Number
Average Value
Number
Average Value
Number
Average Value
Number
Average Value
Number
Average Value
LOANS ORIGINATED
1
$119,900
3
$68,093
17
$96,240
2
$25,095
1
$35,960
APPLICATIONS APPROVED, NOT ACCEPTED
0
$0
0
$0
3
$111,513
0
$0
0
$0
APPLICATIONS DENIED
0
$0
2
$25,535
10
$88,549
1
$27,130
0
$0
APPLICATIONS WITHDRAWN
0
$0
0
$0
4
$100,208
0
$0
0
$0
FILES CLOSED FOR INCOMPLETENESS
0
$0
0
$0
1
$122,210
0
$0
0
$0
Aggregated Statistics For Year 2002 (Based on 1 partial tract)
A) FHA, FSA/RHS & VA Home Purchase Loans
B) Conventional Home Purchase Loans
C) Refinancings
D) Home Improvement Loans
F) Non-occupant Loans on < 5 Family Dwellings (A B C & D)
Number
Average Value
Number
Average Value
Number
Average Value
Number
Average Value
Number
Average Value
LOANS ORIGINATED
1
$89,890
5
$54,708
12
$89,839
2
$25,425
1
$39,490
APPLICATIONS APPROVED, NOT ACCEPTED
0
$0
1
$57,690
2
$67,120
0
$0
0
$0
APPLICATIONS DENIED
0
$0
3
$53,017
7
$73,003
0
$0
0
$0
APPLICATIONS WITHDRAWN
0
$0
0
$0
3
$75,410
0
$0
0
$0
FILES CLOSED FOR INCOMPLETENESS
0
$0
0
$0
2
$98,275
0
$0
0
$0
Aggregated Statistics For Year 2001 (Based on 1 partial tract)
B) Conventional Home Purchase Loans
C) Refinancings
D) Home Improvement Loans
F) Non-occupant Loans on < 5 Family Dwellings (A B C & D)
Number
Average Value
Number
Average Value
Number
Average Value
Number
Average Value
LOANS ORIGINATED
5
$61,150
12
$81,135
1
$11,910
1
$36,730
APPLICATIONS APPROVED, NOT ACCEPTED
1
$39,930
2
$49,360
0
$0
0
$0
APPLICATIONS DENIED
4
$40,700
6
$88,057
1
$3,420
1
$18,310
APPLICATIONS WITHDRAWN
0
$0
4
$79,638
0
$0
0
$0
FILES CLOSED FOR INCOMPLETENESS
0
$0
1
$115,480
0
$0
0
$0
Aggregated Statistics For Year 2000 (Based on 1 partial tract)
B) Conventional Home Purchase Loans
C) Refinancings
D) Home Improvement Loans
Number
Average Value
Number
Average Value
Number
Average Value
LOANS ORIGINATED
5
$56,120
5
$53,386
1
$3,860
APPLICATIONS APPROVED, NOT ACCEPTED
1
$46,440
1
$37,500
0
$0
APPLICATIONS DENIED
6
$33,053
3
$72,983
0
$0
APPLICATIONS WITHDRAWN
0
$0
2
$56,695
0
$0
FILES CLOSED FOR INCOMPLETENESS
0
$0
0
$0
0
$0
Aggregated Statistics For Year 1999 (Based on 1 partial tract)
A) FHA, FSA/RHS & VA Home Purchase Loans
B) Conventional Home Purchase Loans
C) Refinancings
D) Home Improvement Loans
F) Non-occupant Loans on < 5 Family Dwellings (A B C & D)
Detailed PMIC statistics for the following Tracts:0056.00
2003 - 2018 National Fire Incident Reporting System (NFIRS) incidents
According to the data from the years 2003 - 2018 the average number of fires per year is 7. The highest number of fire incidents - 19 took place in 2006, and the least - 0 in 2011. The data has a growing trend.
When looking into fire subcategories, the most reports belonged to: Outside Fires (53.3%), and Structure Fires (32.7%).
Fire incident types reported to NFIRS in Zip Code 35019


 Nearest zip codes: 35087, 35621, 35083, 35058, 35016, 35670.


 According to the data from the years 2003 - 2018 the average number of fires per year is 7. The highest number of fire incidents - 19 took place in 2006, and the least - 0 in 2011. The data has a growing trend.
 When looking into fire subcategories, the most reports belonged to: Outside Fires (53.3%), and Structure Fires (32.7%).