Estimated zip code population in 2022: 2,948 Zip code population in 2010: 3,907 Zip code population in 2000: 3,977
Houses and condos: 1,440 Renter-occupied apartments: 113
% of renters here:
9%
State:
30%
March 2022 cost of living index in zip code 35133: 81.8 (low, U.S. average is 100)
Land area: 48.3 sq. mi. Water area: 0.8 sq. mi.
Population density: 61 people per square mile
(very low).
OSM Map
General Map
Google Map
MSN Map
OSM Map
General Map
Google Map
MSN Map
OSM Map
General Map
Google Map
MSN Map
OSM Map
General Map
Google Map
MSN Map
Please wait while loading the map...
Real estate property taxes paid for housing units in 2022:
This zip code:
0.3% ($515)
Alabama:
0.4% ($718)
Median real estate property taxes paid for housing units with mortgages in 2022: $545 (0.3%) Median real estate property taxes paid for housing units with no mortgage in 2022: $457 (0.3%)
Averages for the 2020 tax year for zip code 35133, filed in 2021:
Average Adjusted Gross Income (AGI) in 2020: $52,100 (Individual Income Tax Returns)
Here:
$52,100
State:
$63,984
Salary/wage: $49,323 (reported on 81.5% of returns)
Here:
$49,323
State:
$52,834
(% of AGI for various income ranges: 1109.8% for AGIs below $25k, 3643.1% for AGIs $25k-50k, 6724.3% for AGIs $50k-75k, 9111.4% for AGIs $75k-100k, 17802.9% for AGIs $100k-200k)
Taxable interest for individuals: $702 (reported on 23.7% of returns)
This zip code:
$702
Alabama:
$1,615
(% of AGI for various income ranges: 17.6% for AGIs below $25k, 15.4% for AGIs $25k-50k, 24.3% for AGIs $50k-75k, 17.1% for AGIs $75k-100k, 57.1% for AGIs $100k-200k)
Ordinary dividends: $1,271 (reported on 9.8% of returns)
Here:
$1,271
State:
$7,660
(% of AGI for various income ranges: 11.1% for AGIs below $25k, 9.7% for AGIs $25k-50k, 23.3% for AGIs $50k-75k, 59.3% for AGIs $100k-200k)
Net capital gain/loss in AGI: +$3,300 (reported on 7.5% of returns)
Here:
+$3,300
State:
+$23,528
(% of AGI for various income ranges: 2.0% for AGIs below $25k, 18.9% for AGIs $25k-50k, 38.6% for AGIs $50k-75k, 195.0% for AGIs $100k-200k)
Profit/loss from business: +$6,730 (reported on 17.3% of returns)
Here:
+$6,730
State:
+$9,534
(% of AGI for various income ranges: 158.2% for AGIs below $25k, 94.3% for AGIs $25k-50k, 117.6% for AGIs $50k-75k, 258.6% for AGIs $75k-100k, 262.9% for AGIs $100k-200k)
Taxable individual retirement arrangement distribution: $15,019 (reported on 9.2% of returns)
35133:
$15,019
Alabama:
$19,004
(% of AGI for various income ranges: 82.0% for AGIs below $25k, 69.4% for AGIs $25k-50k, 135.7% for AGIs $50k-75k, 470.7% for AGIs $75k-100k, 605.0% for AGIs $100k-200k)
Total itemized deductions: $30,260 (reported on 2.9% of returns)
Here:
$30,260
State:
$37,338
(% of AGI for various income ranges: 369.0% for AGIs $50k-75k, 527.1% for AGIs $100k-200k)
Charity contributions: $9,700 (reported on 2.3% of returns)
Here:
$9,700
State:
$18,005
(% of AGI for various income ranges: 277.1% for AGIs $75k-100k)
Taxes paid: $6,020 (reported on 2.9% of returns)
35133:
$6,020
State:
$6,484
(% of AGI for various income ranges: 61.0% for AGIs $50k-75k, 123.6% for AGIs $100k-200k)
Earned income credit: $2,378 (reported on 18.5% of returns)
Here:
$2,378
State:
$2,628
(% of AGI for various income ranges: 110.4% for AGIs below $25k, 75.4% for AGIs $25k-50k)
Percentage of individuals using paid preparers for their 2020 taxes: 94.8%
Here:
95%
State:
93%
(% for various income ranges: 93.1% for AGIs below $25k, 93.3% for AGIs $25k-50k, 96.4% for AGIs $50k-75k, 100.0% for AGIs $75k-100k, 95.7% for AGIs $100k-200k)
Averages for the 2012 tax year for zip code 35133, filed in 2013:
Average Adjusted Gross Income (AGI) in 2012: $44,930 (Individual Income Tax Returns)
Here:
$44,930
State:
$52,001
Salary/wage: $42,025 (reported on 82.3% of returns)
Here:
$42,025
State:
$43,822
(% of AGI for various income ranges: 69.5% for AGIs below $25k, 77.8% for AGIs $25k-50k, 79.9% for AGIs $50k-75k, 79.0% for AGIs $75k-100k, 75.3% for AGIs $100k-200k)
Taxable interest for individuals: $779 (reported on 26.6% of returns)
This zip code:
$779
Alabama:
$1,592
(% of AGI for various income ranges: 1.0% for AGIs below $25k, 0.8% for AGIs $25k-50k, 0.2% for AGIs $50k-75k, 0.1% for AGIs $75k-100k, 0.4% for AGIs $100k-200k)
Ordinary dividends: $640 (reported on 9.5% of returns)
Here:
$640
State:
$5,697
(% of AGI for various income ranges: 0.2% for AGIs below $25k, 0.2% for AGIs $25k-50k, 0.2% for AGIs $100k-200k)
Net capital gain/loss in AGI: +$333 (reported on 5.7% of returns)
Here:
+$333
State:
+$13,286
Profit/loss from business: +$9,081 (reported on 16.5% of returns)
Here:
+$9,081
State:
+$9,151
(% of AGI for various income ranges: 12.0% for AGIs below $25k, 2.9% for AGIs $25k-50k, 2.0% for AGIs $50k-75k, 2.7% for AGIs $75k-100k, 1.5% for AGIs $100k-200k)
Taxable individual retirement arrangement distribution: $10,975 (reported on 10.1% of returns)
35133:
$10,975
Alabama:
$14,992
(% of AGI for various income ranges: 2.9% for AGIs below $25k, 2.7% for AGIs $25k-50k, 2.9% for AGIs $50k-75k, 4.7% for AGIs $75k-100k)
Total itemized deductions: $16,439 (22% of AGI, reported on 25.9% of returns)
Here:
$16,439
State:
$21,388
Here:
21.6% of AGI
State:
20.1% of AGI
(% of AGI for various income ranges: 6.7% for AGIs below $25k, 8.4% for AGIs $25k-50k, 8.9% for AGIs $50k-75k, 10.6% for AGIs $75k-100k, 11.4% for AGIs $100k-200k)
Charity contributions: $4,003 (reported on 22.8% of returns)
Here:
$4,003
State:
$5,925
(% of AGI for various income ranges: 1.2% for AGIs below $25k, 1.5% for AGIs $25k-50k, 1.6% for AGIs $50k-75k, 2.7% for AGIs $75k-100k, 2.7% for AGIs $100k-200k)
Taxes paid: $3,654 (reported on 25.9% of returns)
35133:
$3,654
State:
$5,272
(% of AGI for various income ranges: 0.7% for AGIs below $25k, 1.1% for AGIs $25k-50k, 1.8% for AGIs $50k-75k, 2.5% for AGIs $75k-100k, 3.6% for AGIs $100k-200k)
Earned income credit: $2,237 (reported on 22.2% of returns)
Here:
$2,237
State:
$2,646
(% of AGI for various income ranges: 7.4% for AGIs below $25k, 1.3% for AGIs $25k-50k)
Percentage of individuals using paid preparers for their 2012 taxes: 60.8%
Here:
61%
State:
60%
(% for various income ranges: 56.5% for AGIs below $25k, 61.9% for AGIs $25k-50k, 61.5% for AGIs $50k-75k, 68.8% for AGIs $75k-100k, 66.7% for AGIs $100k-200k)
Averages for the 2004 tax year for zip code 35133, filed in 2005:
Average Adjusted Gross Income (AGI) in 2004: $40,315 (Individual Income Tax Returns)
Here:
$40,315
State:
$42,302
Salary/wage: $38,387 (reported on 86.3% of returns)
Here:
$38,387
State:
$36,626
(% of AGI for various income ranges: 110.2% for AGIs below $10k, 77.4% for AGIs $10k-25k, 87.2% for AGIs $25k-50k, 85.9% for AGIs $50k-75k, 81.6% for AGIs $75k-100k, 69.3% for AGIs over 100k)
Taxable interest for individuals: $1,103 (reported on 34.7% of returns)
This zip code:
$1,103
Alabama:
$1,827
(% of AGI for various income ranges: 4.4% for AGIs below $10k, 2.3% for AGIs $10k-25k, 0.7% for AGIs $25k-50k, 0.9% for AGIs $50k-75k, 0.4% for AGIs $75k-100k, 0.9% for AGIs over 100k)
Taxable dividends: $842 (reported on 11.3% of returns)
Here:
$842
State:
$4,206
(% of AGI for various income ranges: 0.1% for AGIs $10k-25k, 0.5% for AGIs $25k-50k, 0.1% for AGIs $50k-75k, 0.2% for AGIs $75k-100k, 0.3% for AGIs over 100k)
Net capital gain/loss: +$2,156 (reported on 9.8% of returns)
Here:
+$2,156
State:
+$13,031
(% of AGI for various income ranges: -1.0% for AGIs below $10k, 0.0% for AGIs $10k-25k, 0.0% for AGIs $25k-50k, 0.2% for AGIs $50k-75k, 0.1% for AGIs $75k-100k, 2.7% for AGIs over 100k)
Profit/loss from business: +$7,281 (reported on 16.1% of returns)
Here:
+$7,281
State:
+$8,302
(% of AGI for various income ranges: 20.4% for AGIs below $10k, 5.5% for AGIs $10k-25k, 2.4% for AGIs $25k-50k, 2.8% for AGIs $50k-75k, 1.5% for AGIs $75k-100k, 2.1% for AGIs over 100k)
IRA payment deduction: $2,784 (reported on 2.5% of returns)
35133:
$2,784
Alabama:
$3,006
(% of AGI for various income ranges: 0.3% for AGIs $10k-25k, 0.2% for AGIs $50k-75k, 0.5% for AGIs $75k-100k)
Total itemized deductions: $15,031 (23% of AGI, reported on 30.2% of returns)
Here:
$15,031
State:
$17,623
Here:
22.7% of AGI
State:
20.8% of AGI
(% of AGI for various income ranges: 25.1% for AGIs below $10k, 6.7% for AGIs $10k-25k, 9.9% for AGIs $25k-50k, 10.7% for AGIs $50k-75k, 14.1% for AGIs $75k-100k, 12.9% for AGIs over 100k)
Charity contributions deductions: $3,556 (5% of AGI, reported on 26.1% of returns)
Here:
$3,556
State:
$4,768
Here:
5.1% of AGI
State:
5.4% of AGI
(% of AGI for various income ranges: 1.5% for AGIs $10k-25k, 1.5% for AGIs $25k-50k, 2.3% for AGIs $50k-75k, 3.3% for AGIs $75k-100k, 3.3% for AGIs over 100k)
Total tax: $4,695 (reported on 77.8% of returns)
35133:
$4,695
State:
$6,905
(% of AGI for various income ranges: 4.7% for AGIs below $10k, 4.0% for AGIs $10k-25k, 6.3% for AGIs $25k-50k, 8.3% for AGIs $50k-75k, 10.3% for AGIs $75k-100k, 16.7% for AGIs over 100k)
Earned income credit: $1,763 (reported on 16.8% of returns)
Here:
$1,763
State:
$2,048
Percentage of individuals using paid preparers for their 2004 taxes: 65.1%
Here:
65%
State:
65%
(% for various income ranges: 55.8% for AGIs below $10k, 65.8% for AGIs $10k-25k, 66.3% for AGIs $25k-50k, 68.1% for AGIs $50k-75k, 65.6% for AGIs $75k-100k, 74.6% for AGIs over 100k)
Household received Food Stamps/SNAP in the past 12 months: 203 Household did not receive Food Stamps/SNAP in the past 12 months: 1,024
Women who had a birth in the past 12 months: 47 (53 now married, 0 unmarried) Women who did not have a birth in the past 12 months: 434 (299 now married, 133 unmarried)
Housing units in zip code 35133 with a mortgage: 635 (99 second mortgage, 104 both second mortgage and home equity loan) Median monthly owner costs for units with a mortgage: $1,172 Median monthly owner costs for units without a mortgage: $311
Residents with income below the poverty level in 2022:
This zip code:
10.8%
Whole state:
16.2%
Residents with income below 50% of the poverty level in 2022:
This zip code:
1.8%
Whole state:
8.6%
Median number of rooms in houses and condos:
Here:
6.2
State:
6.5
Median number of rooms in apartments:
Here:
5.2
State:
4.7
Notable locations in this zip code not listed on our city pages
Notable locations in zip code 35133: Remlap Volunteer Fire Department Station 2 (A), Remlap Volunteer Fire Department Station 1 (B), Pine Mountain Volunteer Fire and Emergency Medical Services Station 1 (C), Pine Mountain Volunteer Fire and Emergency Medical Services Station 2 (D). Display/hide their locations on the map
Churches in zip code 35133 include: Valley Grove Church (A), Selfville Church (B), Remlap Church (C), Red Valley Church (D), Pleasant Mountain Baptist Church (E), Lees Chapel (F). Display/hide their locations on the map
Streams, rivers, and creeks: Sawmill Slough (A), Sally Branch (B), Rock Creek (C), Red Valley Branch (D), Little White Creek (E), Crump Branch (F), Campbell Creek (G), Bear Mountain Branch (H), Valley Creek (I). Display/hide their locations on the map
Facilities with environmental interests located in this zip code:
MIDWAY USED AUTO SALES AND PTS (19924 STATE HWY 75 in REMLAP, AL)
National Pollutant Discharge Elimination System NON-MAJOR (Tracking pollutant discharge elimination systems) - permit Business SIC classification: MOTOR VEHICLE PARTS, USED Organizations: MIDWAY AUTO PARTS (CONTACT/OWNER)
Alternative names: MIDWAY AUTO PARTS
BLOUNT CO COMM BCP 05 116 01 (BLOUNT COUNTY COMMISSION in REMLAP, AL)
National Pollutant Discharge Elimination System NON-MAJOR (Tracking pollutant discharge elimination systems) - permit Business SIC classification: BRIDGE, TUNNEL, AND ELEVATED HIGHWAY CONSTRUCTION
RED VALLEY HEIGHTS PHASE 1 (DAVE MARTIN DEVELOPMENT INC in REMLAP, AL)
National Pollutant Discharge Elimination System NON-MAJOR (Tracking pollutant discharge elimination systems) - permit Business SIC classification: GENERAL CONTRACTORS-SINGLE-FAMILY HOUSES Alternative names: DAVE MARTIN DEVELOPMENT INC
LEDBETTER FOUNDRY (15303 REMLAP DRIVE in REMLAP, AL)
(Resource Conservation and Recovery Act (tracking hazardous waste))
Housing units lacking complete plumbing facilities: 9.3% Housing units lacking complete kitchen facilities: 11.8%
78.7%Electricity
12.5%Utility gas
5.4%Bottled, tank, or LP gas
2.2%Wood
1.4%No fuel used
Population in 1990: 6,013.
Place of birth for U.S.-born residents:
This state: 2,370
Northeast: 83
Midwest: 47
South: 228
West: 19
62% of the 35133 zip code residents lived in the same house 5 years ago. Out of people who lived in different houses, 29% lived in this county. Out of people who lived in different counties, 50% lived in Alabama.
93% of the 35133 zip code residents lived in the same house 1 year ago. Out of people who lived in different houses, 33% moved from this county. Out of people who lived in different houses, 58% moved from different county within same state. Out of people who lived in different houses, 10% moved from different state.
Private vs. public school enrollment:
Students in private schools in grades 1 to 8 (elementary and middle school): 40
Here:
13.8%
Alabama:
14.7%
Students in private schools in grades 9 to 12 (high school):
Here:
0.0%
Alabama:
16.3%
Students in private undergraduate colleges:
Here:
0.0%
Alabama:
14.6%
Occupation by median earnings in the past 12 months ($)
94,898Health diagnosing and treating practitioners and other technical occupations
60,429Installation, maintenance, and repair occupations
40,972Office and administrative support occupations
34,230Building and grounds cleaning and maintenance occupations
28,039Management occupations
26,597Sales and related occupations
Companies with federal contracts located in this zip code:
SHOOT WRESTLING USA INC (10275 MIZE RD in REMLAP, AL; small business) : $16,000 in 2 contractsfrom 2005 to 2006
$9,600 with Army for Training Aids. Signed on 2006-03-23. Completion date: 2006-08-31.
$6,400, same as above.Signed on 2005-09-27. Completion date: 2006-01-31.
Top industries in this zip code by the number of employees in 2005:
Administrative and Support and Waste Management and Remediation Services: Janitorial Services (50-99 employees: 1 establishment)
Construction: Drywall and Insulation Contractors (20-49: 1, 1-4: 1)
Construction: Oil and Gas Pipeline and Related Structures Construction (20-49: 1)
Construction: Poured Concrete Foundation and Structure Contractors (20-49: 1)
Construction: Plumbing, Heating, and Air-Conditioning Contractors (10-19: 1, 1-4: 1)
Other Services (except Public Administration): Religious Organizations (5-9: 1, 1-4: 3)
Wholesale Trade: Industrial Machinery and Equipment Merchant Wholesalers (5-9: 1)
Construction: Masonry Contractors (5-9: 1)
Fatal accident statistics in 2012:
Fatal accident count: 2
Vehicles involved in fatal accidents: 2
Fatal accidents caused by drunken drivers: 0
Fatalities: 2
Persons involved in fatal accidents: 2
Pedestrians involved in fatal accidents: 1
Fatal accident statistics in 2011:
Fatal accident count: 1
Vehicles involved in fatal accidents: 1
Fatal accidents caused by drunken drivers: 1
Fatalities: 1
Persons involved in fatal accidents: 2
Pedestrians involved in fatal accidents: 0
Home Mortgage Disclosure Act Aggregated Statistics For Year 2009 (Based on 1 partial tract)
A) FHA, FSA/RHS & VA Home Purchase Loans
B) Conventional Home Purchase Loans
C) Refinancings
D) Home Improvement Loans
F) Non-occupant Loans on < 5 Family Dwellings (A B C & D)
G) Loans On Manufactured Home Dwelling (A B C & D)
Number
Average Value
Number
Average Value
Number
Average Value
Number
Average Value
Number
Average Value
Number
Average Value
LOANS ORIGINATED
13
$115,799
16
$77,198
78
$125,781
10
$32,449
5
$60,678
14
$35,627
APPLICATIONS APPROVED, NOT ACCEPTED
1
$153,200
3
$54,080
9
$116,478
2
$72,080
0
$0
4
$53,118
APPLICATIONS DENIED
2
$67,810
12
$65,132
37
$128,888
2
$18,835
3
$69,820
14
$42,803
APPLICATIONS WITHDRAWN
2
$73,085
2
$76,600
21
$146,791
1
$2,010
1
$83,880
3
$50,230
FILES CLOSED FOR INCOMPLETENESS
1
$89,910
0
$0
7
$146,097
1
$60,280
1
$59,770
1
$68,310
Aggregated Statistics For Year 2008 (Based on 1 partial tract)
A) FHA, FSA/RHS & VA Home Purchase Loans
B) Conventional Home Purchase Loans
C) Refinancings
D) Home Improvement Loans
F) Non-occupant Loans on < 5 Family Dwellings (A B C & D)
G) Loans On Manufactured Home Dwelling (A B C & D)
Number
Average Value
Number
Average Value
Number
Average Value
Number
Average Value
Number
Average Value
Number
Average Value
LOANS ORIGINATED
18
$122,952
22
$111,008
62
$125,551
7
$27,124
7
$101,823
10
$60,025
APPLICATIONS APPROVED, NOT ACCEPTED
0
$0
7
$44,704
7
$129,666
0
$0
3
$39,850
6
$38,427
APPLICATIONS DENIED
6
$106,068
17
$77,856
47
$117,164
11
$87,081
0
$0
21
$53,913
APPLICATIONS WITHDRAWN
2
$128,340
3
$65,300
21
$126,914
0
$0
2
$60,780
2
$51,485
FILES CLOSED FOR INCOMPLETENESS
0
$0
1
$82,880
7
$109,717
1
$74,840
1
$40,180
0
$0
Aggregated Statistics For Year 2007 (Based on 1 partial tract)
A) FHA, FSA/RHS & VA Home Purchase Loans
B) Conventional Home Purchase Loans
C) Refinancings
D) Home Improvement Loans
F) Non-occupant Loans on < 5 Family Dwellings (A B C & D)
G) Loans On Manufactured Home Dwelling (A B C & D)
Number
Average Value
Number
Average Value
Number
Average Value
Number
Average Value
Number
Average Value
Number
Average Value
LOANS ORIGINATED
11
$101,967
62
$110,700
54
$122,217
13
$30,408
4
$82,125
18
$56,425
APPLICATIONS APPROVED, NOT ACCEPTED
2
$28,130
9
$79,029
12
$99,078
2
$41,940
1
$67,810
6
$46,630
APPLICATIONS DENIED
3
$94,933
17
$94,521
64
$110,616
16
$48,346
2
$66,050
17
$55,874
APPLICATIONS WITHDRAWN
2
$77,605
9
$105,650
14
$129,881
3
$72,500
1
$47,220
2
$53,495
FILES CLOSED FOR INCOMPLETENESS
0
$0
3
$139,303
5
$103,272
1
$85,890
1
$25,110
1
$32,150
Aggregated Statistics For Year 2006 (Based on 1 partial tract)
A) FHA, FSA/RHS & VA Home Purchase Loans
B) Conventional Home Purchase Loans
C) Refinancings
D) Home Improvement Loans
F) Non-occupant Loans on < 5 Family Dwellings (A B C & D)
G) Loans On Manufactured Home Dwelling (A B C & D)
Number
Average Value
Number
Average Value
Number
Average Value
Number
Average Value
Number
Average Value
Number
Average Value
LOANS ORIGINATED
10
$116,483
76
$93,824
69
$100,540
11
$33,425
7
$62,213
16
$59,209
APPLICATIONS APPROVED, NOT ACCEPTED
1
$10,050
11
$83,655
18
$79,503
6
$34,157
3
$65,467
7
$51,234
APPLICATIONS DENIED
2
$79,365
25
$85,130
42
$103,378
16
$36,668
1
$35,160
16
$58,989
APPLICATIONS WITHDRAWN
1
$54,250
9
$95,828
28
$103,115
4
$55,252
1
$21,600
2
$60,780
FILES CLOSED FOR INCOMPLETENESS
0
$0
1
$98,950
9
$120,887
1
$69,820
1
$30,140
0
$0
Aggregated Statistics For Year 2005 (Based on 1 partial tract)
A) FHA, FSA/RHS & VA Home Purchase Loans
B) Conventional Home Purchase Loans
C) Refinancings
D) Home Improvement Loans
F) Non-occupant Loans on < 5 Family Dwellings (A B C & D)
G) Loans On Manufactured Home Dwelling (A B C & D)
Number
Average Value
Number
Average Value
Number
Average Value
Number
Average Value
Number
Average Value
Number
Average Value
LOANS ORIGINATED
7
$98,379
53
$90,139
76
$100,552
9
$31,812
6
$91,502
14
$47,109
APPLICATIONS APPROVED, NOT ACCEPTED
0
$0
13
$66,690
14
$110,183
2
$72,330
1
$77,860
10
$53,093
APPLICATIONS DENIED
2
$131,350
26
$65,898
52
$97,427
11
$48,038
2
$23,355
22
$42,924
APPLICATIONS WITHDRAWN
0
$0
10
$83,432
35
$111,051
4
$87,652
1
$66,300
7
$63,219
FILES CLOSED FOR INCOMPLETENESS
0
$0
1
$140,640
8
$144,536
0
$0
0
$0
1
$41,690
Aggregated Statistics For Year 2004 (Based on 1 partial tract)
A) FHA, FSA/RHS & VA Home Purchase Loans
B) Conventional Home Purchase Loans
C) Refinancings
D) Home Improvement Loans
F) Non-occupant Loans on < 5 Family Dwellings (A B C & D)
G) Loans On Manufactured Home Dwelling (A B C & D)
Number
Average Value
Number
Average Value
Number
Average Value
Number
Average Value
Number
Average Value
Number
Average Value
LOANS ORIGINATED
11
$91,647
55
$87,574
72
$101,353
11
$30,321
7
$71,757
19
$44,335
APPLICATIONS APPROVED, NOT ACCEPTED
0
$0
14
$67,057
19
$87,189
2
$57,260
1
$39,180
10
$46,714
APPLICATIONS DENIED
4
$88,782
30
$73,185
58
$91,704
13
$31,838
5
$71,126
25
$54,088
APPLICATIONS WITHDRAWN
2
$82,375
7
$101,967
25
$100,520
3
$63,290
0
$0
1
$59,270
FILES CLOSED FOR INCOMPLETENESS
0
$0
3
$66,807
27
$109,297
1
$15,070
0
$0
5
$60,076
Aggregated Statistics For Year 2003 (Based on 1 partial tract)
A) FHA, FSA/RHS & VA Home Purchase Loans
B) Conventional Home Purchase Loans
C) Refinancings
D) Home Improvement Loans
F) Non-occupant Loans on < 5 Family Dwellings (A B C & D)
Number
Average Value
Number
Average Value
Number
Average Value
Number
Average Value
Number
Average Value
LOANS ORIGINATED
15
$99,690
44
$79,649
137
$93,058
9
$40,630
5
$50,632
APPLICATIONS APPROVED, NOT ACCEPTED
1
$21,600
6
$68,397
22
$83,359
1
$2,510
1
$26,120
APPLICATIONS DENIED
1
$73,840
19
$63,872
73
$84,792
11
$16,530
0
$0
APPLICATIONS WITHDRAWN
0
$0
6
$96,777
31
$93,557
3
$106,487
0
$0
FILES CLOSED FOR INCOMPLETENESS
0
$0
2
$52,995
7
$113,376
1
$16,580
0
$0
Aggregated Statistics For Year 2002 (Based on 1 partial tract)
A) FHA, FSA/RHS & VA Home Purchase Loans
B) Conventional Home Purchase Loans
C) Refinancings
D) Home Improvement Loans
F) Non-occupant Loans on < 5 Family Dwellings (A B C & D)
Number
Average Value
Number
Average Value
Number
Average Value
Number
Average Value
Number
Average Value
LOANS ORIGINATED
11
$102,424
40
$76,940
97
$93,449
8
$43,260
6
$48,975
APPLICATIONS APPROVED, NOT ACCEPTED
0
$0
9
$41,189
19
$97,049
1
$105,480
1
$25,110
APPLICATIONS DENIED
1
$156,220
30
$55,420
47
$73,389
7
$14,710
4
$50,732
APPLICATIONS WITHDRAWN
0
$0
3
$103,307
21
$81,875
2
$87,400
1
$65,800
FILES CLOSED FOR INCOMPLETENESS
0
$0
3
$69,820
10
$95,738
0
$0
0
$0
Aggregated Statistics For Year 2001 (Based on 1 partial tract)
A) FHA, FSA/RHS & VA Home Purchase Loans
B) Conventional Home Purchase Loans
C) Refinancings
D) Home Improvement Loans
F) Non-occupant Loans on < 5 Family Dwellings (A B C & D)
Number
Average Value
Number
Average Value
Number
Average Value
Number
Average Value
Number
Average Value
LOANS ORIGINATED
12
$97,697
53
$76,700
88
$91,088
16
$14,221
4
$53,370
APPLICATIONS APPROVED, NOT ACCEPTED
1
$83,880
14
$50,409
9
$74,173
1
$4,520
1
$22,100
APPLICATIONS DENIED
2
$53,745
49
$49,646
45
$77,142
7
$4,449
3
$78,023
APPLICATIONS WITHDRAWN
1
$100,460
2
$71,580
30
$79,631
0
$0
2
$89,910
FILES CLOSED FOR INCOMPLETENESS
0
$0
2
$53,245
10
$66,756
0
$0
0
$0
Aggregated Statistics For Year 2000 (Based on 1 partial tract)
A) FHA, FSA/RHS & VA Home Purchase Loans
B) Conventional Home Purchase Loans
C) Refinancings
D) Home Improvement Loans
F) Non-occupant Loans on < 5 Family Dwellings (A B C & D)
Number
Average Value
Number
Average Value
Number
Average Value
Number
Average Value
Number
Average Value
LOANS ORIGINATED
11
$86,670
52
$63,425
30
$69,870
13
$14,722
3
$57,430
APPLICATIONS APPROVED, NOT ACCEPTED
1
$48,720
16
$51,862
8
$68,878
4
$20,468
2
$42,195
APPLICATIONS DENIED
2
$76,100
58
$44,809
18
$65,216
4
$13,688
3
$27,123
APPLICATIONS WITHDRAWN
2
$77,355
5
$59,874
9
$63,848
2
$23,860
1
$36,170
FILES CLOSED FOR INCOMPLETENESS
1
$123,570
3
$103,977
12
$65,927
0
$0
1
$47,720
Aggregated Statistics For Year 1999 (Based on 1 partial tract)
A) FHA, FSA/RHS & VA Home Purchase Loans
B) Conventional Home Purchase Loans
C) Refinancings
D) Home Improvement Loans
F) Non-occupant Loans on < 5 Family Dwellings (A B C & D)

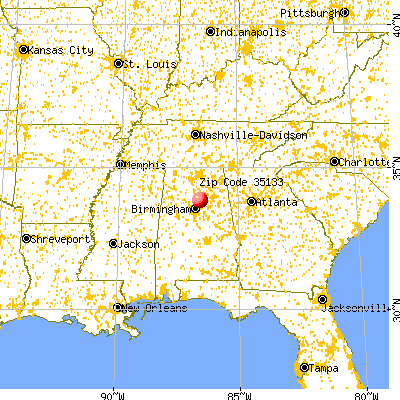


 Nearest zip codes: 35097, 35172, 35013, 35126, 35049, 35146.


 (Students: 383, Location: 18770 STATE HIGHWAY 75, Grades: KG-12)


