Estimated zip code population in 2022: 2,656 Zip code population in 2010: 3,378 Zip code population in 2000: 3,152
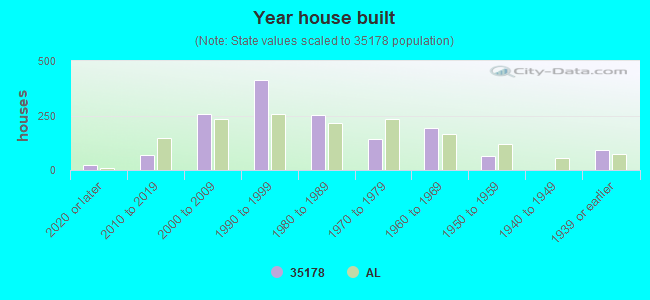
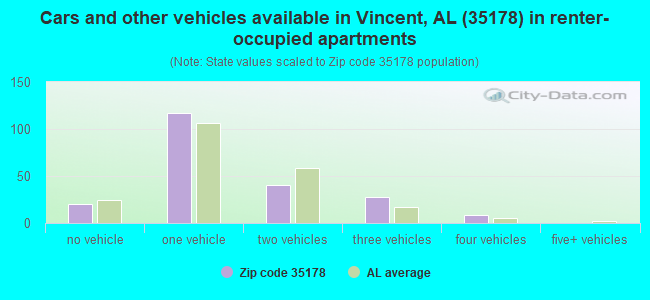
Houses and condos: 1,572 Renter-occupied apartments: 212
% of renters here:
17%
State:
30%
March 2022 cost of living index in zip code 35178: 82.8 (low, U.S. average is 100)
Land area: 57.0 sq. mi. Water area: 2.6 sq. mi.
Population density: 47 people per square mile
(very low).
OSM Map
General Map
Google Map
MSN Map
OSM Map
General Map
Google Map
MSN Map
OSM Map
General Map
Google Map
MSN Map
OSM Map
General Map
Google Map
MSN Map
Please wait while loading the map...
Real estate property taxes paid for housing units in 2022:
This zip code:
0.4% ($559)
Alabama:
0.4% ($718)
Median real estate property taxes paid for housing units with mortgages in 2022: $595 (0.3%) Median real estate property taxes paid for housing units with no mortgage in 2022: $500 (0.4%)
Business Search- 14 Million verified businesses
Males: 1,363
(51.3%)
Females: 1,292
(48.7%)
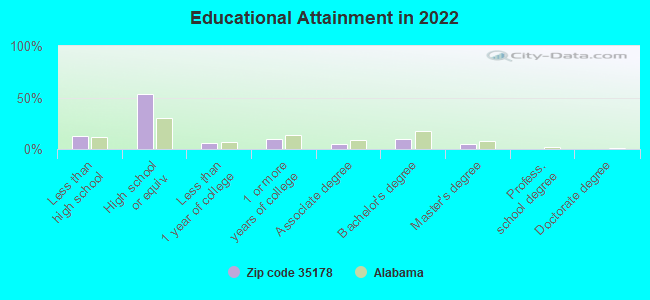
For population 25 years and over in 35178:
High school or higher: 86.7%
Bachelor's degree or higher: 14.3%
Graduate or professional degree: 4.8%
Unemployed: 10.1%
Mean travel time to work (commute): 33.4 minutes
For population 15 years and over in 35178:
Never married: 24.8%
Now married: 44.7%
Separated: 2.6%
Widowed: 10.6%
Divorced: 17.3%
Zip code 35178 compared to state average:
Median household income below state average.
Unemployed percentage above state average.
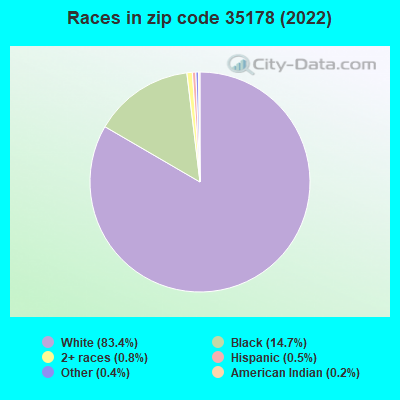
Black race population percentage below state average.
Hispanic race population percentage significantly below state average.
Median age significantly above state average.
Foreign-born population percentage significantly below state average.
Renting percentage below state average.
Length of stay since moving in significantly above state average.
Number of college students below state average.
Percentage of population with a bachelor's degree or higher below state average.
Averages for the 2020 tax year for zip code 35178, filed in 2021:
Average Adjusted Gross Income (AGI) in 2020: $51,936 (Individual Income Tax Returns)
Here:
$51,936
State:
$63,984
Salary/wage: $43,985 (reported on 82.3% of returns)
Here:
$43,985
State:
$52,834
(% of AGI for various income ranges: 1194.7% for AGIs below $25k, 4173.1% for AGIs $25k-50k, 6597.6% for AGIs $50k-75k, 10548.8% for AGIs $75k-100k, 17250.0% for AGIs $100k-200k)
Taxable interest for individuals: $923 (reported on 23.8% of returns)
This zip code:
$923
Alabama:
$1,615
(% of AGI for various income ranges: 20.9% for AGIs below $25k, 13.4% for AGIs $25k-50k, 29.4% for AGIs $50k-75k, 58.8% for AGIs $75k-100k, 127.5% for AGIs $100k-200k)
Ordinary dividends: $3,169 (reported on 9.8% of returns)
Here:
$3,169
State:
$7,660
(% of AGI for various income ranges: 8.9% for AGIs below $25k, 24.9% for AGIs $25k-50k, 63.5% for AGIs $50k-75k, 45.0% for AGIs $75k-100k, 295.0% for AGIs $100k-200k)
Net capital gain/loss in AGI: +$12,577 (reported on 7.9% of returns)
Here:
+$12,577
State:
+$23,528
(% of AGI for various income ranges: 8.0% for AGIs below $25k, 9.1% for AGIs $25k-50k, 60.0% for AGIs $50k-75k, 1831.2% for AGIs $100k-200k)
Profit/loss from business: +$4,792 (reported on 15.2% of returns)
Here:
+$4,792
State:
+$9,534
(% of AGI for various income ranges: 119.8% for AGIs below $25k, 30.3% for AGIs $25k-50k, 34.7% for AGIs $50k-75k, 367.5% for AGIs $75k-100k, 250.0% for AGIs $100k-200k)
Taxable individual retirement arrangement distribution: $16,492 (reported on 7.9% of returns)
35178:
$16,492
Alabama:
$19,004
(% of AGI for various income ranges: 44.9% for AGIs below $25k, 78.0% for AGIs $25k-50k, 443.5% for AGIs $50k-75k, 1143.8% for AGIs $100k-200k)
Total itemized deductions: $29,900 (reported on 7.9% of returns)
Here:
$29,900
State:
$37,338
(% of AGI for various income ranges: 593.1% for AGIs $25k-50k, 307.1% for AGIs $50k-75k, 1611.2% for AGIs $100k-200k)
Charity contributions: $9,346 (reported on 7.9% of returns)
Here:
$9,346
State:
$18,005
(% of AGI for various income ranges: 214.9% for AGIs $25k-50k, 578.8% for AGIs $100k-200k)
Taxes paid: $4,020 (reported on 6.1% of returns)
35178:
$4,020
State:
$6,484
(% of AGI for various income ranges: 24.9% for AGIs $25k-50k, 48.2% for AGIs $50k-75k, 291.2% for AGIs $100k-200k)
Earned income credit: $2,574 (reported on 21.3% of returns)
Here:
$2,574
State:
$2,628
(% of AGI for various income ranges: 140.2% for AGIs below $25k, 77.1% for AGIs $25k-50k)
Percentage of individuals using paid preparers for their 2020 taxes: 89.6%
Here:
90%
State:
93%
(% for various income ranges: 91.4% for AGIs below $25k, 82.0% for AGIs $25k-50k, 91.7% for AGIs $50k-75k, 100.0% for AGIs $75k-100k, 93.3% for AGIs $100k-200k, 100.0% for AGIs over 200k)
Averages for the 2012 tax year for zip code 35178, filed in 2013:
Average Adjusted Gross Income (AGI) in 2012: $43,597 (Individual Income Tax Returns)
Here:
$43,597
State:
$52,001
Salary/wage: $35,706 (reported on 84.9% of returns)
Here:
$35,706
State:
$43,822
(% of AGI for various income ranges: 73.9% for AGIs below $25k, 81.5% for AGIs $25k-50k, 76.8% for AGIs $50k-75k, 75.2% for AGIs $75k-100k, 91.5% for AGIs $100k-200k)
Taxable interest for individuals: $842 (reported on 26.0% of returns)
This zip code:
$842
Alabama:
$1,592
(% of AGI for various income ranges: 0.7% for AGIs below $25k, 0.3% for AGIs $25k-50k, 0.9% for AGIs $50k-75k, 0.5% for AGIs $75k-100k, 0.5% for AGIs $100k-200k)
Ordinary dividends: $2,679 (reported on 9.6% of returns)
Here:
$2,679
State:
$5,697
(% of AGI for various income ranges: 0.4% for AGIs below $25k, 0.1% for AGIs $25k-50k, 0.7% for AGIs $50k-75k, 2.0% for AGIs $100k-200k)
Net capital gain/loss in AGI: +$6,256 (reported on 6.2% of returns)
Here:
+$6,256
State:
+$13,286
(% of AGI for various income ranges: 0.7% for AGIs $50k-75k, 4.3% for AGIs $100k-200k)
Profit/loss from business: +$7,347 (reported on 13.0% of returns)
Here:
+$7,347
State:
+$9,151
(% of AGI for various income ranges: 9.6% for AGIs below $25k, 1.6% for AGIs $25k-50k, 4.1% for AGIs $75k-100k)
Taxable individual retirement arrangement distribution: $16,475 (reported on 8.2% of returns)
35178:
$16,475
Alabama:
$14,992
(% of AGI for various income ranges: 2.8% for AGIs below $25k, 2.7% for AGIs $25k-50k, 3.3% for AGIs $50k-75k, 8.0% for AGIs $100k-200k)
Total itemized deductions: $18,949 (24% of AGI, reported on 26.7% of returns)
Here:
$18,949
State:
$21,388
Here:
24.0% of AGI
State:
20.1% of AGI
(% of AGI for various income ranges: 7.6% for AGIs below $25k, 12.8% for AGIs $25k-50k, 13.4% for AGIs $50k-75k, 13.4% for AGIs $75k-100k, 18.7% for AGIs $100k-200k)
Charity contributions: $5,106 (reported on 22.6% of returns)
Here:
$5,106
State:
$5,925
(% of AGI for various income ranges: 1.2% for AGIs below $25k, 3.1% for AGIs $25k-50k, 2.6% for AGIs $50k-75k, 3.0% for AGIs $75k-100k, 4.9% for AGIs $100k-200k)
Taxes paid: $4,043 (reported on 25.3% of returns)
35178:
$4,043
State:
$5,272
(% of AGI for various income ranges: 0.8% for AGIs below $25k, 1.4% for AGIs $25k-50k, 2.3% for AGIs $50k-75k, 2.7% for AGIs $75k-100k, 6.3% for AGIs $100k-200k)
Earned income credit: $2,524 (reported on 28.1% of returns)
Here:
$2,524
State:
$2,646
(% of AGI for various income ranges: 9.6% for AGIs below $25k, 1.3% for AGIs $25k-50k)
Percentage of individuals using paid preparers for their 2012 taxes: 62.3%
Here:
62%
State:
60%
(% for various income ranges: 59.1% for AGIs below $25k, 56.4% for AGIs $25k-50k, 71.4% for AGIs $50k-75k, 77.8% for AGIs $75k-100k, 88.9% for AGIs $100k-200k)
Averages for the 2004 tax year for zip code 35178, filed in 2005:
Average Adjusted Gross Income (AGI) in 2004: $34,175 (Individual Income Tax Returns)
Here:
$34,175
State:
$42,302
Salary/wage: $31,257 (reported on 87.6% of returns)
Here:
$31,257
State:
$36,626
(% of AGI for various income ranges: 91.5% for AGIs below $10k, 82.5% for AGIs $10k-25k, 84.4% for AGIs $25k-50k, 82.4% for AGIs $50k-75k, 80.6% for AGIs $75k-100k, 63.2% for AGIs over 100k)
Taxable interest for individuals: $1,107 (reported on 30.8% of returns)
This zip code:
$1,107
Alabama:
$1,827
(% of AGI for various income ranges: 2.2% for AGIs below $10k, 1.0% for AGIs $10k-25k, 1.1% for AGIs $25k-50k, 1.1% for AGIs $50k-75k, 0.5% for AGIs $75k-100k, 1.0% for AGIs over 100k)
Taxable dividends: $1,541 (reported on 11.0% of returns)
Here:
$1,541
State:
$4,206
(% of AGI for various income ranges: 0.3% for AGIs below $10k, 0.4% for AGIs $10k-25k, 0.2% for AGIs $25k-50k, 0.5% for AGIs $50k-75k, 0.3% for AGIs $75k-100k, 1.3% for AGIs over 100k)
Net capital gain/loss: +$6,053 (reported on 6.6% of returns)
Here:
+$6,053
State:
+$13,031
(% of AGI for various income ranges: -0.1% for AGIs $10k-25k, 0.8% for AGIs $25k-50k, 0.3% for AGIs $50k-75k, -0.2% for AGIs $75k-100k, 6.1% for AGIs over 100k)
Profit/loss from business: +$6,451 (reported on 13.6% of returns)
Here:
+$6,451
State:
+$8,302
(% of AGI for various income ranges: 10.1% for AGIs below $10k, 5.3% for AGIs $10k-25k, 2.0% for AGIs $25k-50k, 2.4% for AGIs $50k-75k, 2.3% for AGIs $75k-100k)
IRA payment deduction: $1,545 (reported on 0.8% of returns)
35178:
$1,545
Alabama:
$3,006
Total itemized deductions: $14,226 (25% of AGI, reported on 26.9% of returns)
Here:
$14,226
State:
$17,623
Here:
24.6% of AGI
State:
20.8% of AGI
(% of AGI for various income ranges: 11.6% for AGIs below $10k, 7.6% for AGIs $10k-25k, 10.9% for AGIs $25k-50k, 12.3% for AGIs $50k-75k, 12.2% for AGIs $75k-100k, 12.9% for AGIs over 100k)
Charity contributions deductions: $3,526 (6% of AGI, reported on 23.8% of returns)
Here:
$3,526
State:
$4,768
Here:
5.9% of AGI
State:
5.4% of AGI
(% of AGI for various income ranges: 1.3% for AGIs $10k-25k, 2.2% for AGIs $25k-50k, 2.5% for AGIs $50k-75k, 2.5% for AGIs $75k-100k, 4.4% for AGIs over 100k)
Total tax: $4,091 (reported on 70.0% of returns)
35178:
$4,091
State:
$6,905
(% of AGI for various income ranges: 2.7% for AGIs below $10k, 3.1% for AGIs $10k-25k, 6.2% for AGIs $25k-50k, 8.5% for AGIs $50k-75k, 10.7% for AGIs $75k-100k, 16.7% for AGIs over 100k)
Earned income credit: $1,937 (reported on 26.6% of returns)
Here:
$1,937
State:
$2,048
Percentage of individuals using paid preparers for their 2004 taxes: 65.7%
Here:
66%
State:
65%
(% for various income ranges: 51.5% for AGIs below $10k, 64.9% for AGIs $10k-25k, 71.3% for AGIs $25k-50k, 75.1% for AGIs $50k-75k, 64.6% for AGIs $75k-100k, 71.7% for AGIs over 100k)
Household received Food Stamps/SNAP in the past 12 months: 164 Household did not receive Food Stamps/SNAP in the past 12 months: 1,061
Women who had a birth in the past 12 months: 16 (0 now married, 12 unmarried) Women who did not have a birth in the past 12 months: 353 (237 now married, 115 unmarried)
Housing units in zip code 35178 with a mortgage: 500 (7 second mortgage, 7 both second mortgage and home equity loan) Houses without a mortgage: 37
Median monthly owner costs for units with a mortgage: $1,078 Median monthly owner costs for units without a mortgage: $343
Residents with income below the poverty level in 2022:
This zip code:
36.6%
Whole state:
16.2%
Residents with income below 50% of the poverty level in 2022:
This zip code:
14.6%
Whole state:
8.6%
Median number of rooms in houses and condos:
Here:
6.3
State:
6.5
Median number of rooms in apartments:
Here:
4.9
State:
4.7
Notable locations in this zip code not listed on our city pages
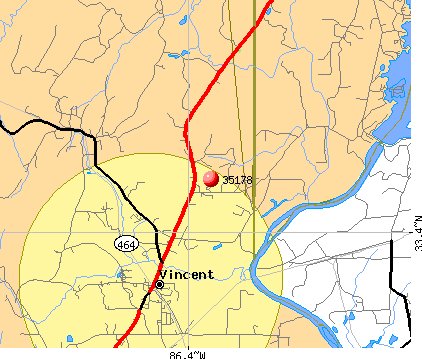
Notable locations in zip code 35178: Kelly Creek Landing (A), Bearden Farms Number 2 (B), Pier Fiftynine Marina (C), Burns Marina (D), Birmingham Sailing Club (E), Vincent Volunteer Fire Department (F). Display/hide their locations on the map
Churches in zip code 35178 include: Mount Canaan Church (A), Pentecostal Church (B), First Born Church (C), Arkwright Church (D), Coosa Valley Church (E), Evening Star Church (F), New Hope Church (G), Duncan Chapel (H), Calcis Church (I). Display/hide their locations on the map
Cemeteries: Elliott Cemetery (1), Raley Family Cemetery (2), Williamson Cemetery (3), Vincent Cemetery (4), Arkwright Cemetery (5), Macedonia Cemetery (6), Glover Cemetery (7). Display/hide their locations on the map
Streams, rivers, and creeks: Spring Creek (A), Locust Creek (B), Little Creek (C), Glade Branch (D), Blue Spring Branch (E), Camp Creek (F), Kelly Creek (G), Toe River (H), Wolf Creek (I). Display/hide their locations on the map
Size of family households: 336 2-persons, 107 3-persons, 92 4-persons, 87 5-persons, 3 6-persons
Size of nonfamily households: 541 1-person, 39 2-persons, 11 3-persons
229 married couples with children.
206 single-parent households (22 men, 184 women).
98.4% of residents of 35178 zip code speak English at home.
1.0% of residents speak Spanish at home (100% very well).
0.4% of residents speak other Indo-European language at home (100% very well).
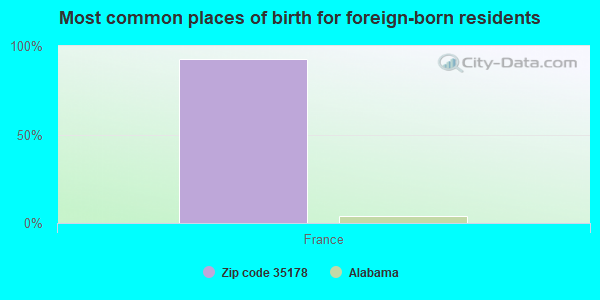
Foreign born population: 15 (0.6%) (100.0% of them are naturalized citizens)
This zip code:
0.6%
Whole state:
3.8%
93%France
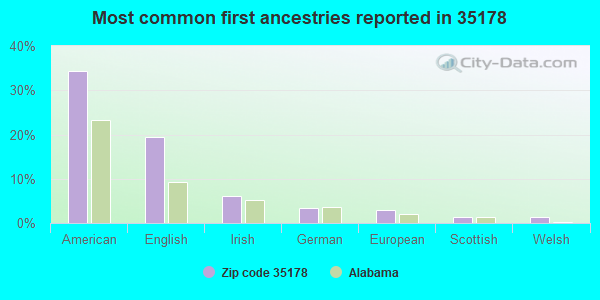
34%American
19%English
6%Irish
3%German
3%European
1%Scottish
1%Welsh
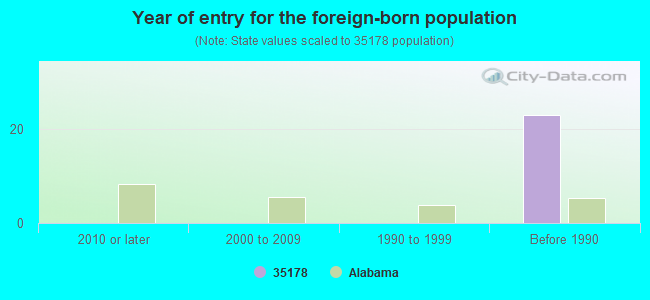
Year of entry for the foreign-born population
02010 or later
02000 to 2009
01990 to 1999
23Before 1990
Facilities with environmental interests located in this zip code:
ALABAMA PLATING CO INC (HIGHWAY 231 NORTH in VINCENT, AL)
SUPERFUND NPL (Superfund database) SUPERFUND (Superfund database) TSD (Resource Conservation and Recovery Act (tracking hazardous waste)) Small Quantity Generators, between 100 kg and 1000 kg of hazardous waste/month (Resource Conservation and Recovery Act (tracking hazardous waste)) TRI REPORTER (Tracking of toxic chemicals releasing facilities) Business SIC classification: ELECTROPLATING, PLATING, POLISHING, ANODIZING, AND COLORING Alternative names: ALABAMA PLATING GALVANIZING SATELLITE FA, ALABAMA PLATING- SATELLITE
ALABAMA POWER COMPANY (LOGAN MARTIN HYDRO in VINCENT, AL)
National Pollutant Discharge Elimination System NON-MAJOR (Tracking pollutant discharge elimination systems) - permit Business SIC classification: ELECTRIC SERVICES Alternative names: ALABAMA POWER CO LOGAN MARTIN
READINESS CENTER (METRO D CONSTRUCTION in VINCENT, AL)
National Pollutant Discharge Elimination System NON-MAJOR (Tracking pollutant discharge elimination systems) - permit Business SIC classification: GENERAL CONTRACTORS-NONRESIDENTIAL BUILDINGS, OTHER THAN INDUSTRIAL BUILDINGS AND WAREHOUSES Alternative names: METRO D CONST READINESS CTR
LAMAR HINDS (LAMAR HINDS in VINCENT, AL)
National Pollutant Discharge Elimination System NON-MAJOR (Tracking pollutant discharge elimination systems) - permit Business SIC classification: MISCELLANEOUS NONMETALLIC MINERALS, EXCEPT FUELS Alternative names: LAMAR HINDS LAMAR HINDS
Housing units lacking complete plumbing facilities: 6.6% Housing units lacking complete kitchen facilities: 4.9%
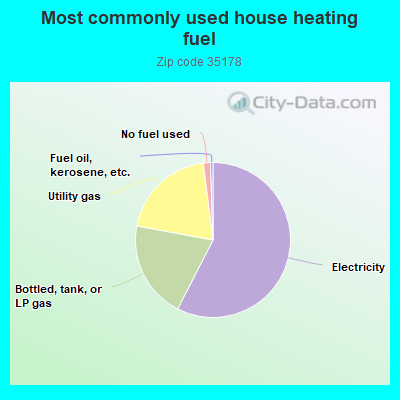
57.6%Electricity
20.4%Bottled, tank, or LP gas
20.1%Utility gas
1.5%No fuel used
0.5%Fuel oil, kerosene, etc.
Population in 1990: 295. Population change in the 1990s: +2,857 (+968.5%).
Place of birth for U.S.-born residents:
This state: 2,173
Northeast: 16
Midwest: 154
South: 255
West: 6
65% of the 35178 zip code residents lived in the same house 5 years ago. Out of people who lived in different houses, 55% lived in this county. Out of people who lived in different counties, 50% lived in Alabama.
95% of the 35178 zip code residents lived in the same house 1 year ago. Out of people who lived in different houses, 39% moved from this county. Out of people who lived in different houses, 55% moved from different county within same state. Out of people who lived in different houses, 9% moved from different state.
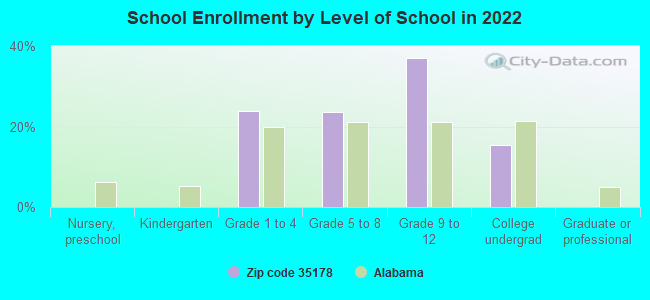
Private vs. public school enrollment:
Students in private schools in grades 1 to 8 (elementary and middle school): 8
Here:
3.8%
Alabama:
14.7%
Students in private schools in grades 9 to 12 (high school): 19
Here:
10.8%
Alabama:
16.3%
Students in private undergraduate colleges: 15
Here:
20.6%
Alabama:
14.6%
Occupation by median earnings in the past 12 months ($)
70,867Law enforcement workers including supervisors
54,984Installation, maintenance, and repair occupations
45,545Construction and extraction occupations
44,209Education, training, and library occupations
41,213Production occupations
38,737Office and administrative support occupations
Top industries in this zip code by the number of employees in 2005:
Health Care and Social Assistance: Offices of Physicians (except Mental Health Specialists) (20-49 employees: 1 establishment)
Utilities: Electric Power Distribution (10-19: 2)
Other Services (except Public Administration): Religious Organizations (10-19: 1, 1-4: 2)
Construction: Commercial and Institutional Building Construction (10-19: 1)
Finance and Insurance: Commercial Banking (5-9: 1)
Accommodation and Food Services: Bed-and-Breakfast Inns (5-9: 1)
Construction: Site Preparation Contractors (1-4: 2)
Professional, Scientific, and Technical Services: Advertising Agencies (1-4: 1)
Fatal accident statistics in 2014:
Fatal accident count: 2
Vehicles involved in fatal accidents: 3
Fatal accidents caused by drunken drivers: 1
Fatalities: 2
Persons involved in fatal accidents: 5
Pedestrians involved in fatal accidents: 0
Fatal accident statistics in 2013:
Fatal accident count: 2
Vehicles involved in fatal accidents: 2
Fatal accidents caused by drunken drivers: 1
Fatalities: 2
Persons involved in fatal accidents: 3
Pedestrians involved in fatal accidents: 0
Home Mortgage Disclosure Act Aggregated Statistics For Year 2009 (Based on 2 partial tracts)
A) FHA, FSA/RHS & VA Home Purchase Loans
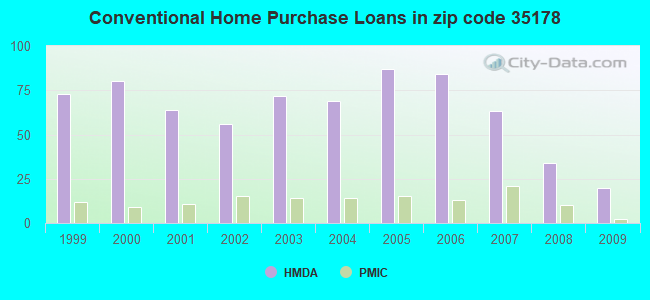
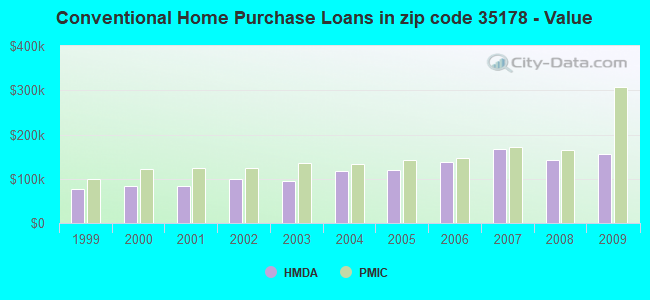
B) Conventional Home Purchase Loans
C) Refinancings
D) Home Improvement Loans
F) Non-occupant Loans on < 5 Family Dwellings (A B C & D)
G) Loans On Manufactured Home Dwelling (A B C & D)
Number
Average Value
Number
Average Value
Number
Average Value
Number
Average Value
Number
Average Value
Number
Average Value
LOANS ORIGINATED
12
$117,637
20
$155,140
90
$156,931
11
$46,900
22
$154,509
14
$34,418
APPLICATIONS APPROVED, NOT ACCEPTED
1
$102,600
3
$82,853
8
$156,172
1
$46,580
0
$0
4
$56,732
APPLICATIONS DENIED
6
$108,987
12
$107,659
41
$157,605
5
$37,592
4
$160,898
11
$55,317
APPLICATIONS WITHDRAWN
2
$179,230
4
$141,278
32
$172,064
1
$57,080
2
$168,215
1
$93,530
FILES CLOSED FOR INCOMPLETENESS
1
$170,200
1
$126,180
4
$156,730
0
$0
0
$0
1
$16,830
Aggregated Statistics For Year 2008 (Based on 2 partial tracts)
A) FHA, FSA/RHS & VA Home Purchase Loans
B) Conventional Home Purchase Loans
C) Refinancings
D) Home Improvement Loans
F) Non-occupant Loans on < 5 Family Dwellings (A B C & D)
G) Loans On Manufactured Home Dwelling (A B C & D)
Number
Average Value
Number
Average Value
Number
Average Value
Number
Average Value
Number
Average Value
Number
Average Value
LOANS ORIGINATED
11
$130,811
34
$141,408
70
$171,285
18
$41,443
15
$135,108
17
$35,891
APPLICATIONS APPROVED, NOT ACCEPTED
1
$119,250
7
$66,970
9
$186,018
2
$52,975
3
$84,250
8
$51,221
APPLICATIONS DENIED
4
$125,162
13
$75,616
40
$150,645
11
$46,686
1
$58,260
12
$61,617
APPLICATIONS WITHDRAWN
1
$186,220
4
$164,742
24
$173,152
1
$211,750
2
$160,410
1
$108,860
FILES CLOSED FOR INCOMPLETENESS
0
$0
1
$155,330
8
$213,168
0
$0
0
$0
0
$0
Aggregated Statistics For Year 2007 (Based on 2 partial tracts)
A) FHA, FSA/RHS & VA Home Purchase Loans
B) Conventional Home Purchase Loans
C) Refinancings
D) Home Improvement Loans
F) Non-occupant Loans on < 5 Family Dwellings (A B C & D)
G) Loans On Manufactured Home Dwelling (A B C & D)
Number
Average Value
Number
Average Value
Number
Average Value
Number
Average Value
Number
Average Value
Number
Average Value
LOANS ORIGINATED
9
$120,171
63
$167,862
81
$159,208
21
$40,600
21
$201,171
15
$53,663
APPLICATIONS APPROVED, NOT ACCEPTED
1
$67,600
9
$93,197
11
$161,794
1
$18,700
2
$62,445
5
$66,096
APPLICATIONS DENIED
3
$118,630
23
$92,900
45
$120,375
13
$62,565
1
$41,040
22
$55,794
APPLICATIONS WITHDRAWN
1
$95,180
8
$139,692
23
$150,685
5
$64,614
2
$85,100
2
$58,115
FILES CLOSED FOR INCOMPLETENESS
0
$0
3
$161,773
9
$180,827
1
$70,810
1
$182,010
0
$0
Aggregated Statistics For Year 2006 (Based on 2 partial tracts)
A) FHA, FSA/RHS & VA Home Purchase Loans
B) Conventional Home Purchase Loans
C) Refinancings
D) Home Improvement Loans
F) Non-occupant Loans on < 5 Family Dwellings (A B C & D)
G) Loans On Manufactured Home Dwelling (A B C & D)
Number
Average Value
Number
Average Value
Number
Average Value
Number
Average Value
Number
Average Value
Number
Average Value
LOANS ORIGINATED
7
$138,687
84
$137,095
69
$131,652
20
$36,606
16
$168,740
16
$56,771
APPLICATIONS APPROVED, NOT ACCEPTED
0
$0
11
$86,237
9
$126,434
3
$30,183
0
$0
7
$48,670
APPLICATIONS DENIED
1
$153,300
24
$86,790
42
$128,293
13
$33,898
3
$122,940
17
$50,580
APPLICATIONS WITHDRAWN
0
$0
11
$127,656
29
$106,852
3
$44,383
3
$83,377
2
$77,495
FILES CLOSED FOR INCOMPLETENESS
0
$0
4
$100,032
16
$148,585
0
$0
0
$0
0
$0
Aggregated Statistics For Year 2005 (Based on 2 partial tracts)
A) FHA, FSA/RHS & VA Home Purchase Loans
B) Conventional Home Purchase Loans
C) Refinancings
D) Home Improvement Loans
F) Non-occupant Loans on < 5 Family Dwellings (A B C & D)
G) Loans On Manufactured Home Dwelling (A B C & D)
Number
Average Value
Number
Average Value
Number
Average Value
Number
Average Value
Number
Average Value
Number
Average Value
LOANS ORIGINATED
5
$132,384
87
$120,355
83
$123,103
22
$38,895
17
$145,006
15
$49,515
APPLICATIONS APPROVED, NOT ACCEPTED
1
$50,060
16
$76,203
19
$101,736
0
$0
1
$126,800
11
$47,196
APPLICATIONS DENIED
2
$57,580
26
$63,844
52
$118,996
17
$41,964
4
$82,732
25
$42,701
APPLICATIONS WITHDRAWN
1
$60,070
13
$93,600
38
$139,507
5
$167,092
2
$58,380
4
$70,478
FILES CLOSED FOR INCOMPLETENESS
0
$0
5
$91,432
11
$139,584
1
$87,850
1
$119,530
0
$0
Aggregated Statistics For Year 2004 (Based on 2 partial tracts)
A) FHA, FSA/RHS & VA Home Purchase Loans
B) Conventional Home Purchase Loans
C) Refinancings
D) Home Improvement Loans
F) Non-occupant Loans on < 5 Family Dwellings (A B C & D)
G) Loans On Manufactured Home Dwelling (A B C & D)
Number
Average Value
Number
Average Value
Number
Average Value
Number
Average Value
Number
Average Value
Number
Average Value
LOANS ORIGINATED
6
$115,368
69
$118,472
87
$137,649
15
$34,095
18
$144,596
18
$42,941
APPLICATIONS APPROVED, NOT ACCEPTED
0
$0
11
$94,404
21
$110,951
3
$44,333
1
$73,120
9
$61,308
APPLICATIONS DENIED
1
$139,300
21
$74,953
60
$109,280
13
$60,768
3
$140,103
20
$53,660
APPLICATIONS WITHDRAWN
0
$0
8
$114,809
27
$130,909
2
$65,700
2
$102,995
2
$54,015
FILES CLOSED FOR INCOMPLETENESS
0
$0
1
$83,720
28
$124,314
1
$58,100
0
$0
2
$70,430
Aggregated Statistics For Year 2003 (Based on 2 partial tracts)
A) FHA, FSA/RHS & VA Home Purchase Loans
B) Conventional Home Purchase Loans
C) Refinancings
D) Home Improvement Loans
F) Non-occupant Loans on < 5 Family Dwellings (A B C & D)
Number
Average Value
Number
Average Value
Number
Average Value
Number
Average Value
Number
Average Value
LOANS ORIGINATED
6
$85,680
72
$95,180
157
$119,013
15
$17,611
11
$158,237
APPLICATIONS APPROVED, NOT ACCEPTED
2
$25,685
11
$85,856
26
$108,502
1
$81,220
1
$85,130
APPLICATIONS DENIED
2
$50,890
31
$48,733
74
$122,956
10
$23,189
2
$35,495
APPLICATIONS WITHDRAWN
1
$63,470
3
$125,007
47
$128,735
1
$43,740
1
$297,310
FILES CLOSED FOR INCOMPLETENESS
0
$0
2
$109,235
18
$157,722
0
$0
1
$167,160
Aggregated Statistics For Year 2002 (Based on 2 partial tracts)
A) FHA, FSA/RHS & VA Home Purchase Loans
B) Conventional Home Purchase Loans
C) Refinancings
D) Home Improvement Loans
F) Non-occupant Loans on < 5 Family Dwellings (A B C & D)
Number
Average Value
Number
Average Value
Number
Average Value
Number
Average Value
Number
Average Value
LOANS ORIGINATED
5
$92,310
56
$99,380
121
$124,767
18
$25,138
11
$139,735
APPLICATIONS APPROVED, NOT ACCEPTED
1
$71,970
10
$66,248
16
$96,231
1
$34,950
1
$82,840
APPLICATIONS DENIED
0
$0
44
$44,652
44
$98,755
10
$22,475
5
$85,444
APPLICATIONS WITHDRAWN
1
$60,420
6
$94,392
26
$122,058
0
$0
1
$87,720
FILES CLOSED FOR INCOMPLETENESS
0
$0
1
$122,690
13
$306,034
0
$0
0
$0
Aggregated Statistics For Year 2001 (Based on 2 partial tracts)
A) FHA, FSA/RHS & VA Home Purchase Loans
B) Conventional Home Purchase Loans
C) Refinancings
D) Home Improvement Loans
F) Non-occupant Loans on < 5 Family Dwellings (A B C & D)
Number
Average Value
Number
Average Value
Number
Average Value
Number
Average Value
Number
Average Value
LOANS ORIGINATED
6
$99,013
64
$82,512
112
$109,688
20
$24,182
9
$121,278
APPLICATIONS APPROVED, NOT ACCEPTED
0
$0
13
$53,069
9
$83,679
2
$21,285
1
$79,630
APPLICATIONS DENIED
0
$0
64
$49,266
35
$84,015
7
$12,121
4
$62,665
APPLICATIONS WITHDRAWN
0
$0
3
$105,043
18
$90,746
2
$45,675
1
$56,070
FILES CLOSED FOR INCOMPLETENESS
0
$0
0
$0
11
$125,771
0
$0
1
$74,030
Aggregated Statistics For Year 2000 (Based on 2 partial tracts)
A) FHA, FSA/RHS & VA Home Purchase Loans
B) Conventional Home Purchase Loans
C) Refinancings
D) Home Improvement Loans
F) Non-occupant Loans on < 5 Family Dwellings (A B C & D)
Number
Average Value
Number
Average Value
Number
Average Value
Number
Average Value
Number
Average Value
LOANS ORIGINATED
5
$87,494
80
$83,791
46
$88,261
19
$17,627
9
$69,432
APPLICATIONS APPROVED, NOT ACCEPTED
1
$46,620
23
$55,074
6
$52,333
3
$27,193
0
$0
APPLICATIONS DENIED
1
$85,530
101
$39,992
20
$52,254
4
$5,470
4
$48,178
APPLICATIONS WITHDRAWN
2
$77,510
8
$75,172
10
$72,095
1
$5,040
1
$94,400
FILES CLOSED FOR INCOMPLETENESS
0
$0
1
$169,530
6
$54,855
0
$0
1
$49,690
Aggregated Statistics For Year 1999 (Based on 2 partial tracts)
A) FHA, FSA/RHS & VA Home Purchase Loans
B) Conventional Home Purchase Loans
C) Refinancings
D) Home Improvement Loans
F) Non-occupant Loans on < 5 Family Dwellings (A B C & D)

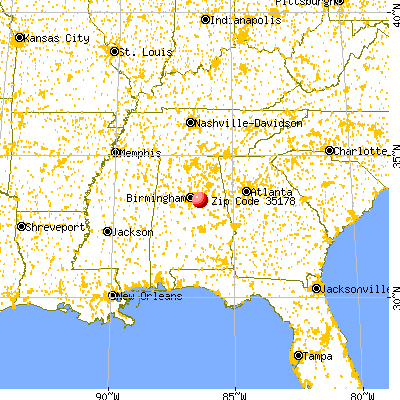


 Nearest zip codes: 35054, 35078, 35176, 35147, 35128, 35014.