Estimated zip code population in 2022: 5,236 Zip code population in 2010: 4,931 Zip code population in 2000: 3,870
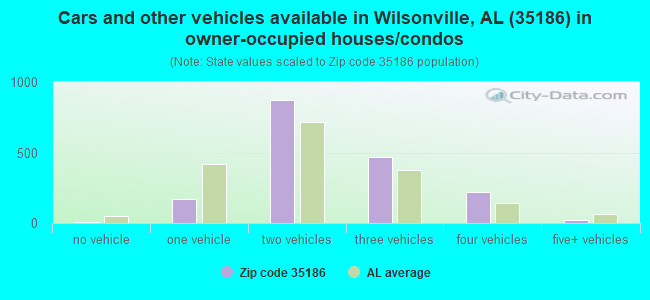
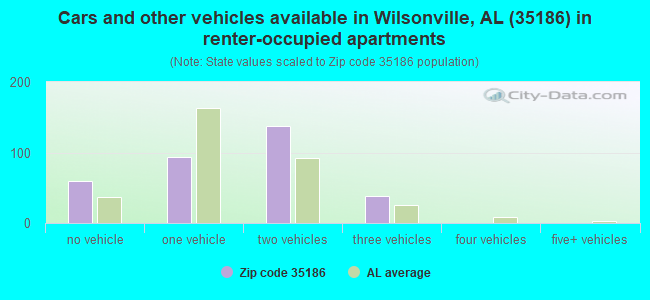
Houses and condos: 2,163 Renter-occupied apartments: 333
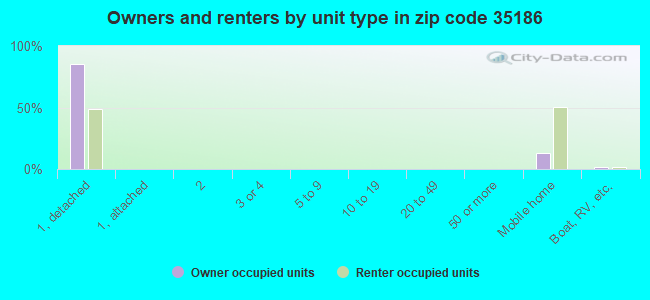
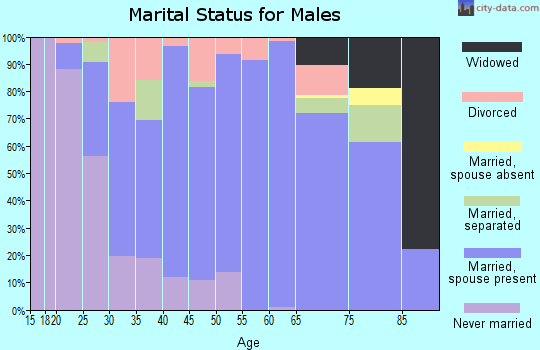
% of renters here:
16%
State:
30%
March 2022 cost of living index in zip code 35186: 83.0 (low, U.S. average is 100)
Land area: 55.3 sq. mi. Water area: 3.4 sq. mi.
Population density: 95 people per square mile
(very low).
OSM Map
General Map
Google Map
MSN Map
OSM Map
General Map
Google Map
MSN Map
OSM Map
General Map
Google Map
MSN Map
OSM Map
General Map
Google Map
MSN Map
Please wait while loading the map...
Real estate property taxes paid for housing units in 2022:
This zip code:
0.4% ($1,131)
Alabama:
0.4% ($718)
Median real estate property taxes paid for housing units with mortgages in 2022: $1,138 (0.4%) Median real estate property taxes paid for housing units with no mortgage in 2022: $1,142 (0.4%)
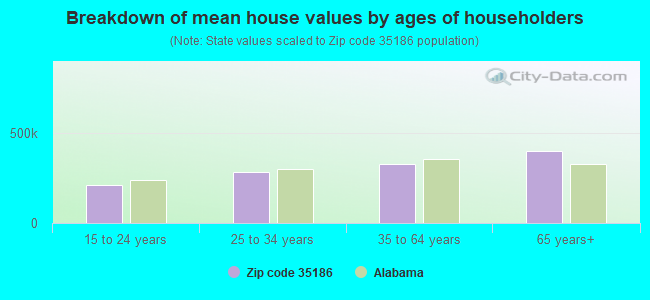
Estimated median house/condo value in 2022: $304,598
35186:
$304,598
Alabama:
$200,900
According to our research of Alabama and other state lists, there were 12 registered sex offenders living in 35186 zip code as of May 15, 2024. The ratio of all residents to sex offenders in zip code 35186 is 423 to 1. The ratio of registered sex offenders to all residents in this zip code is near the state average.
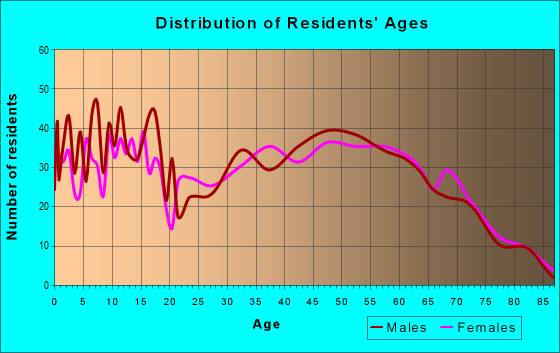
Median resident age:
This zip code:
46.5 years
Alabama median age:
39.6 years
Average household size:
This zip code:
2.5 people
Alabama:
2.5 people
Averages for the 2020 tax year for zip code 35186, filed in 2021:
Average Adjusted Gross Income (AGI) in 2020: $75,829 (Individual Income Tax Returns)
Here:
$75,829
State:
$63,984
Salary/wage: $64,313 (reported on 79.4% of returns)
Here:
$64,313
State:
$52,834
(% of AGI for various income ranges: 1174.1% for AGIs below $25k, 3242.9% for AGIs $25k-50k, 6952.0% for AGIs $50k-75k, 8621.2% for AGIs $75k-100k, 18695.0% for AGIs $100k-200k, 54084.0% for AGIs over 200k)
Taxable interest for individuals: $1,324 (reported on 35.4% of returns)
This zip code:
$1,324
Alabama:
$1,615
(% of AGI for various income ranges: 35.3% for AGIs below $25k, 36.6% for AGIs $25k-50k, 54.5% for AGIs $50k-75k, 55.3% for AGIs $75k-100k, 174.1% for AGIs $100k-200k, 318.0% for AGIs over 200k)
Ordinary dividends: $4,615 (reported on 18.4% of returns)
Here:
$4,615
State:
$7,660
(% of AGI for various income ranges: 37.1% for AGIs below $25k, 45.4% for AGIs $25k-50k, 152.5% for AGIs $50k-75k, 137.1% for AGIs $75k-100k, 350.5% for AGIs $100k-200k, 484.0% for AGIs over 200k)
Net capital gain/loss in AGI: +$11,382 (reported on 15.2% of returns)
Here:
+$11,382
State:
+$23,528
(% of AGI for various income ranges: 18.4% for AGIs below $25k, 44.0% for AGIs $25k-50k, 39.5% for AGIs $50k-75k, 102.9% for AGIs $75k-100k, 585.5% for AGIs $100k-200k, 4168.0% for AGIs over 200k)
Profit/loss from business: +$11,582 (reported on 17.9% of returns)
Here:
+$11,582
State:
+$9,534
(% of AGI for various income ranges: 91.4% for AGIs below $25k, 175.7% for AGIs $25k-50k, 201.0% for AGIs $50k-75k, 316.5% for AGIs $75k-100k, 760.9% for AGIs $100k-200k, 1912.0% for AGIs over 200k)
Taxable individual retirement arrangement distribution: $22,167 (reported on 12.1% of returns)
35186:
$22,167
Alabama:
$19,004
(% of AGI for various income ranges: 88.0% for AGIs below $25k, 176.0% for AGIs $25k-50k, 336.0% for AGIs $50k-75k, 585.9% for AGIs $75k-100k, 1486.4% for AGIs $100k-200k)
Total itemized deductions: $33,617 (reported on 10.8% of returns)
Here:
$33,617
State:
$37,338
(% of AGI for various income ranges: 140.0% for AGIs below $25k, 335.5% for AGIs $50k-75k, 405.3% for AGIs $75k-100k, 1224.5% for AGIs $100k-200k, 6656.0% for AGIs over 200k)
Charity contributions: $12,509 (reported on 9.9% of returns)
Here:
$12,509
State:
$18,005
(% of AGI for various income ranges: 117.5% for AGIs $50k-75k, 81.2% for AGIs $75k-100k, 437.3% for AGIs $100k-200k, 2834.0% for AGIs over 200k)
Taxes paid: $6,817 (reported on 10.3% of returns)
35186:
$6,817
State:
$6,484
(% of AGI for various income ranges: 14.3% for AGIs below $25k, 61.5% for AGIs $50k-75k, 80.6% for AGIs $75k-100k, 262.3% for AGIs $100k-200k, 1322.0% for AGIs over 200k)
Earned income credit: $2,137 (reported on 13.5% of returns)
Here:
$2,137
State:
$2,628
(% of AGI for various income ranges: 81.2% for AGIs below $25k, 69.4% for AGIs $25k-50k)
Percentage of individuals using paid preparers for their 2020 taxes: 92.4%
Here:
92%
State:
93%
(% for various income ranges: 88.4% for AGIs below $25k, 95.5% for AGIs $25k-50k, 93.5% for AGIs $50k-75k, 95.8% for AGIs $75k-100k, 92.9% for AGIs $100k-200k, 92.3% for AGIs over 200k)
Averages for the 2012 tax year for zip code 35186, filed in 2013:
Average Adjusted Gross Income (AGI) in 2012: $57,070 (Individual Income Tax Returns)
Here:
$57,070
State:
$52,001
Salary/wage: $51,268 (reported on 83.2% of returns)
Here:
$51,268
State:
$43,822
(% of AGI for various income ranges: 71.8% for AGIs below $25k, 78.5% for AGIs $25k-50k, 72.8% for AGIs $50k-75k, 74.3% for AGIs $75k-100k, 81.5% for AGIs $100k-200k, 61.6% for AGIs over 200k)
Taxable interest for individuals: $1,120 (reported on 36.0% of returns)
This zip code:
$1,120
Alabama:
$1,592
(% of AGI for various income ranges: 2.1% for AGIs below $25k, 0.9% for AGIs $25k-50k, 0.5% for AGIs $50k-75k, 0.6% for AGIs $75k-100k, 0.6% for AGIs $100k-200k, 0.2% for AGIs over 200k)
Ordinary dividends: $3,442 (reported on 16.8% of returns)
Here:
$3,442
State:
$5,697
(% of AGI for various income ranges: 1.7% for AGIs below $25k, 0.8% for AGIs $25k-50k, 0.9% for AGIs $50k-75k, 1.6% for AGIs $75k-100k, 0.9% for AGIs $100k-200k, 0.7% for AGIs over 200k)
Net capital gain/loss in AGI: +$1,250 (reported on 11.2% of returns)
Here:
+$1,250
State:
+$13,286
(% of AGI for various income ranges: 0.1% for AGIs $25k-50k, 0.7% for AGIs $75k-100k, 0.3% for AGIs $100k-200k)
Profit/loss from business: +$7,625 (reported on 16.2% of returns)
Here:
+$7,625
State:
+$9,151
(% of AGI for various income ranges: 9.1% for AGIs below $25k, 2.1% for AGIs $25k-50k, 2.5% for AGIs $50k-75k, 3.0% for AGIs $75k-100k, 1.1% for AGIs $100k-200k)
Taxable individual retirement arrangement distribution: $14,842 (reported on 12.2% of returns)
35186:
$14,842
Alabama:
$14,992
(% of AGI for various income ranges: 4.3% for AGIs below $25k, 3.6% for AGIs $25k-50k, 4.4% for AGIs $50k-75k, 3.9% for AGIs $75k-100k, 3.2% for AGIs $100k-200k)
Total itemized deductions: $21,216 (21% of AGI, reported on 35.0% of returns)
Here:
$21,216
State:
$21,388
Here:
21.2% of AGI
State:
20.1% of AGI
(% of AGI for various income ranges: 10.8% for AGIs below $25k, 11.0% for AGIs $25k-50k, 13.1% for AGIs $50k-75k, 14.5% for AGIs $75k-100k, 14.1% for AGIs $100k-200k, 12.1% for AGIs over 200k)
Charity contributions: $5,005 (reported on 31.5% of returns)
Here:
$5,005
State:
$5,925
(% of AGI for various income ranges: 1.2% for AGIs below $25k, 2.0% for AGIs $25k-50k, 2.9% for AGIs $50k-75k, 2.8% for AGIs $75k-100k, 3.1% for AGIs $100k-200k, 3.4% for AGIs over 200k)
Taxes paid: $5,326 (reported on 34.5% of returns)
35186:
$5,326
State:
$5,272
(% of AGI for various income ranges: 1.1% for AGIs below $25k, 1.6% for AGIs $25k-50k, 2.5% for AGIs $50k-75k, 3.2% for AGIs $75k-100k, 3.9% for AGIs $100k-200k, 5.2% for AGIs over 200k)
Earned income credit: $2,218 (reported on 16.8% of returns)
Here:
$2,218
State:
$2,646
(% of AGI for various income ranges: 6.4% for AGIs below $25k, 1.3% for AGIs $25k-50k)
Percentage of individuals using paid preparers for their 2012 taxes: 59.9%
Here:
60%
State:
60%
(% for various income ranges: 55.9% for AGIs below $25k, 60.9% for AGIs $25k-50k, 60.7% for AGIs $50k-75k, 56.5% for AGIs $75k-100k, 66.7% for AGIs $100k-200k, 80.0% for AGIs over 200k)
Averages for the 2004 tax year for zip code 35186, filed in 2005:
Average Adjusted Gross Income (AGI) in 2004: $46,069 (Individual Income Tax Returns)
Here:
$46,069
State:
$42,302
Salary/wage: $42,176 (reported on 84.7% of returns)
Here:
$42,176
State:
$36,626
(% of AGI for various income ranges: 111.2% for AGIs below $10k, 74.8% for AGIs $10k-25k, 80.2% for AGIs $25k-50k, 80.5% for AGIs $50k-75k, 84.8% for AGIs $75k-100k, 69.8% for AGIs over 100k)
Taxable interest for individuals: $1,452 (reported on 41.5% of returns)
This zip code:
$1,452
Alabama:
$1,827
(% of AGI for various income ranges: 3.9% for AGIs below $10k, 2.8% for AGIs $10k-25k, 1.1% for AGIs $25k-50k, 1.0% for AGIs $50k-75k, 1.2% for AGIs $75k-100k, 1.1% for AGIs over 100k)
Taxable dividends: $1,924 (reported on 18.8% of returns)
Here:
$1,924
State:
$4,206
(% of AGI for various income ranges: 2.5% for AGIs below $10k, 0.9% for AGIs $10k-25k, 0.8% for AGIs $25k-50k, 0.4% for AGIs $50k-75k, 0.9% for AGIs $75k-100k, 0.8% for AGIs over 100k)
Net capital gain/loss: +$4,422 (reported on 13.4% of returns)
Here:
+$4,422
State:
+$13,031
(% of AGI for various income ranges: -1.2% for AGIs below $10k, 0.4% for AGIs $10k-25k, 0.9% for AGIs $25k-50k, 0.4% for AGIs $50k-75k, 0.9% for AGIs $75k-100k, 2.6% for AGIs over 100k)
Profit/loss from business: +$6,017 (reported on 17.1% of returns)
Here:
+$6,017
State:
+$8,302
(% of AGI for various income ranges: 13.8% for AGIs below $10k, 8.5% for AGIs $10k-25k, 1.8% for AGIs $25k-50k, 2.1% for AGIs $50k-75k, 0.2% for AGIs $75k-100k, 1.3% for AGIs over 100k)
IRA payment deduction: $2,815 (reported on 1.6% of returns)
35186:
$2,815
Alabama:
$3,006
Total itemized deductions: $17,082 (22% of AGI, reported on 36.1% of returns)
Here:
$17,082
State:
$17,623
Here:
21.6% of AGI
State:
20.8% of AGI
(% of AGI for various income ranges: 11.9% for AGIs below $10k, 8.6% for AGIs $10k-25k, 13.4% for AGIs $25k-50k, 14.0% for AGIs $50k-75k, 15.0% for AGIs $75k-100k, 13.5% for AGIs over 100k)
Charity contributions deductions: $4,252 (5% of AGI, reported on 32.3% of returns)
Here:
$4,252
State:
$4,768
Here:
5.1% of AGI
State:
5.4% of AGI
(% of AGI for various income ranges: 1.5% for AGIs $10k-25k, 3.0% for AGIs $25k-50k, 2.9% for AGIs $50k-75k, 2.8% for AGIs $75k-100k, 3.7% for AGIs over 100k)
Total tax: $6,081 (reported on 77.8% of returns)
35186:
$6,081
State:
$6,905
(% of AGI for various income ranges: 3.6% for AGIs below $10k, 4.3% for AGIs $10k-25k, 5.8% for AGIs $25k-50k, 8.2% for AGIs $50k-75k, 10.5% for AGIs $75k-100k, 15.9% for AGIs over 100k)
Earned income credit: $1,670 (reported on 15.7% of returns)
Here:
$1,670
State:
$2,048
Percentage of individuals using paid preparers for their 2004 taxes: 63.2%
Here:
63%
State:
65%
(% for various income ranges: 52.4% for AGIs below $10k, 65.9% for AGIs $10k-25k, 65.8% for AGIs $25k-50k, 67.7% for AGIs $50k-75k, 61.8% for AGIs $75k-100k, 65.0% for AGIs over 100k)
Likely homosexual households (counted as self-reported same-sex unmarried-partner households)
Lesbian couples: 0.1% of all households
Gay men: 0.0% of all households
Household received Food Stamps/SNAP in the past 12 months: 227 Household did not receive Food Stamps/SNAP in the past 12 months: 1,848
Women who had a birth in the past 12 months: 59 (64 now married, 2 unmarried) Women who did not have a birth in the past 12 months: 898 (454 now married, 443 unmarried)
Housing units in zip code 35186 with a mortgage: 994 (98 second mortgage, 88 both second mortgage and home equity loan) Houses without a mortgage: 44
Median monthly owner costs for units with a mortgage: $1,420 Median monthly owner costs for units without a mortgage: $482
Residents with income below the poverty level in 2022:
This zip code:
9.9%
Whole state:
16.2%
Residents with income below 50% of the poverty level in 2022:
This zip code:
3.7%
Whole state:
8.6%
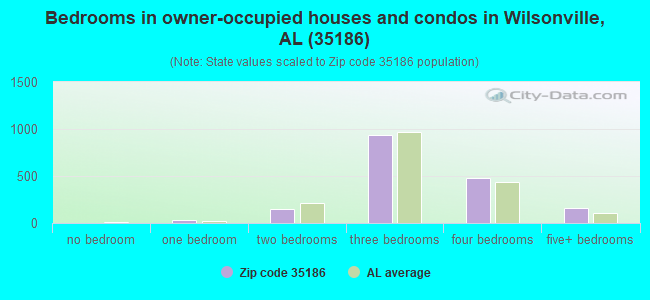
Median number of rooms in houses and condos:
Here:
6.8
State:
6.5
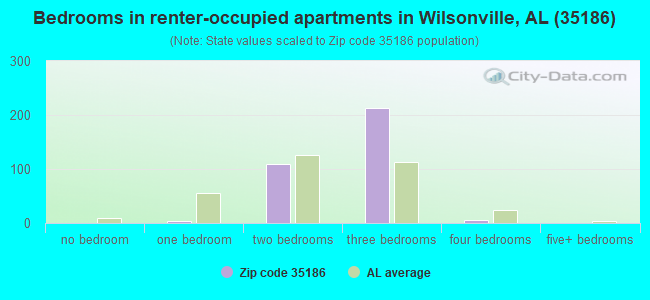
Median number of rooms in apartments:
Here:
4.4
State:
4.7
Notable locations in this zip code not listed on our city pages
Notable locations in zip code 35186: Smiths Camp (A), Ingram Camp (B), Earnest C Gaston Steam Plant (C), Wilsonville Town Hall (D), Wilsonville Fire Department Station 1 (E), Four Mile Fire and Rescue (F), Southeast Shelby County Rescue Station 2 (G), Wilsonville Fire Department Station 2 (H). Display/hide their locations on the map
Churches in zip code 35186 include: Mountain View Church (A), Old Chapel Methodist Church (B), Prospect Baptist Church (C), Blue Springs Church (D), Cedar Grove Freewill Baptist Church (E), First Baptist Church (F), Fourmile Baptist Church (G). Display/hide their locations on the map
Cemeteries: Heaton Cemetery (1), Johnson Cemetery (2), Cedar Grove Cemetery (3), Ray Cemetery (4), Whitfield Cemetery (5), Prospect Cemetery (6), Kirkland Cemetery (7). Display/hide their locations on the map
Streams, rivers, and creeks: Page Spring Branch (A), Muddy Prong (B), Yellowleaf Creek (C), Lick Branch (D), Dry Branch (E), Bulley Creek (F), Beeswax Creek (G). Display/hide their locations on the map
In group quarters: 53 (-1 institutionalized population)
Size of family households: 816 2-persons, 322 3-persons, 274 4-persons, 74 5-persons, 29 6-persons, 23 7-or-more-persons
Size of nonfamily households: 435 1-person, 100 2-persons
845 married couples with children.
209 single-parent households (64 men, 145 women).
96.6% of residents of 35186 zip code speak English at home.
2.7% of residents speak Spanish at home (80% very well, 8% well, 12% not well).
0.9% of residents speak Asian or Pacific Island language at home (60% very well, 40% well).
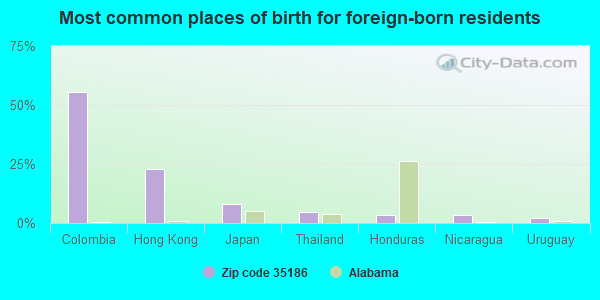
Foreign born population: 93 (1.8%) (36.5% of them are naturalized citizens)
This zip code:
1.8%
Whole state:
3.8%
56%Colombia
23%Hong Kong
8%Japan
5%Thailand
3%Honduras
3%Nicaragua
2%Uruguay
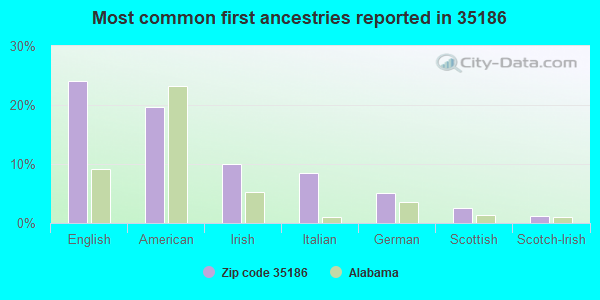
24%English
20%American
10%Irish
9%Italian
5%German
3%Scottish
1%Scotch-Irish
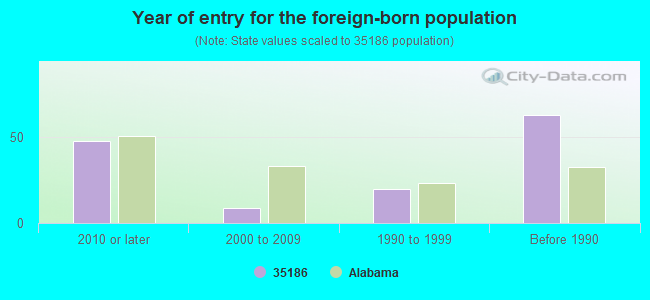
Year of entry for the foreign-born population
482010 or later
92000 to 2009
201990 to 1999
63Before 1990
Facilities with environmental interests located in this zip code:
ALABAMA POWER COMPANY PLANT GASTON STEAM PLANT (31972 HIGHWAY 25 in WILSONVILLE, AL)
AIR MAJOR (AIRS/AFS) AIR PROGRAM (Clean Air Markets Division Business System) SUPERFUND (Superfund database) (Integrated Compliance Information System) - ICIS-04-2000-0120, FORMAL ENFORCEMENT ACTION, ICIS-04-2000-0099, CRITERIA AND HAZARDOUS AIR POLLUTANT INVENTORY (Inventory of air pollution sources) National Pollutant Discharge Elimination System MAJOR (Tracking pollutant discharge elimination systems) - permit Conditionally Exempt Small Quantity Generators, less than 100 kg/month of hazardous waste (Resource Conservation and Recovery Act (tracking hazardous waste)) USED OIL PROGRAM (Resource Conservation and Recovery Act (tracking hazardous waste)) TRI REPORTER (Tracking of toxic chemicals releasing facilities) Business SIC classification: PRODUCTS OF PETROLEUM AND COAL; ELECTRIC SERVICES Organizations: GEORGIA POWER COMPANY (CONTACT/OWNER)
, SOUTHERN ELECTRIC COMPANY (CONTACT/OWNER)
, GEORGIA POWER COMPANY (OWNER/OPERATOR)
, SOUTHERN ELECTRIC COMPANY (OWNER/OPERATOR)
Alternative names: ALABAMA POWER CO EC GASTON STEAM PLANT, ALABAMA POWER CO. GASTON STEAM PLANT, ALABAMA POWER CO. - PLANT GASTON, AL POWER CO E C GASTON STM PL, ALABAMA POWER CO. GASTON STEAM PLANT, ALA POWER CO - GASTON, E C GASTON
CLEAN COAL RESEARCH CENTER SOUTHERN COMPANY SERVICES INC. (HIGHWAY 25 NORTH in WILSONVILLE, AL)
AIR MAJOR (AIRS/AFS) SUPERFUND (Superfund database) CRITERIA AND HAZARDOUS AIR POLLUTANT INVENTORY (Inventory of air pollution sources) National Pollutant Discharge Elimination System NON-MAJOR (Tracking pollutant discharge elimination systems) - permit Conditionally Exempt Small Quantity Generators, less than 100 kg/month of hazardous waste (Resource Conservation and Recovery Act (tracking hazardous waste)) - notification TSD (Resource Conservation and Recovery Act (tracking hazardous waste)) (Resource Conservation and Recovery Act (tracking hazardous waste)) Small Quantity Generators, between 100 kg and 1000 kg of hazardous waste/month (Resource Conservation and Recovery Act (tracking hazardous waste)) - notification TRI REPORTER (Tracking of toxic chemicals releasing facilities) Business SIC classification: PRODUCTS OF PETROLEUM AND COAL; COMMERCIAL PHYSICAL AND BIOLOGICAL RESEARCH Business NAICS classification: ALL OTHER PETROLEUM AND COAL PRODUCTS MANUFACTURING.; RESEARCH AND DEVELOPMENT IN THE PHYSICAL, ENGINEERING, AND LIFE SCIENCES. Organizations: POWER SYSTEMS DEVELOPMENT FAC (CONTACT/OPERATOR)
Alternative names: CATALYTIC INC/SRC PILOT PLT, POWER SYSTEMS DEVELOPMENT FAC, SOUTHERN COMPANY DRUM SITE, SOUTHERN COMPANY POWER SYSTEMS DEVELOPMENT FACILIT, SOUTHERN COMPANY SERVICES PSDF
ALABAMA COAL RECOVERY L L C WILSONVILLE PLANT (31972 HIGHWAY 25 in WILSONVILLE, AL)
ENFORCEMENT/COMPLIANCE ACTIVITY (Integrated Compliance Information System) - ICIS-04-2004-9909, FORMAL ENFORCEMENT ACTION (Integrated Compliance Information System) - ICIS-04-2004-9909, FORMAL ENFORCEMENT ACTION TRI REPORTER (Tracking of toxic chemicals releasing facilities) Business SIC classification: PRODUCTS OF PETROLEUM AND COAL Alternative names: ALABAMA COAL RECOVERY L.L.C., ALABAMA COAL RECOVERY, LLC - WILSONVILLE PLANT
AIR MINOR (AIRS/AFS) Business SIC classification: PRODUCTS OF PETROLEUM AND COAL
NEW LOCKEY ROAD (SHELBY COUNTY COMMISSION in WILSONVILLE, AL)
National Pollutant Discharge Elimination System NON-MAJOR (Tracking pollutant discharge elimination systems) - permit Business SIC classification: HIGHWAY AND STREET CONSTRUCTION, EXCEPT ELEVATED HIGHWAYS Alternative names: NEW LOKEY ROAD
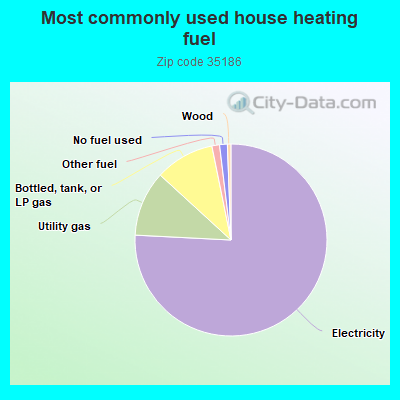
75.9%Electricity
11.0%Utility gas
10.0%Bottled, tank, or LP gas
1.3%Other fuel
1.3%No fuel used
0.6%Wood
Population in 1990: 5,224.
Place of birth for U.S.-born residents:
This state: 3,792
Northeast: 203
Midwest: 143
South: 810
West: 129
62% of the 35186 zip code residents lived in the same house 5 years ago. Out of people who lived in different houses, 56% lived in this county. Out of people who lived in different counties, 50% lived in Alabama.
93% of the 35186 zip code residents lived in the same house 1 year ago. Out of people who lived in different houses, 51% moved from this county. Out of people who lived in different houses, 17% moved from different county within same state. Out of people who lived in different houses, 36% moved from different state.
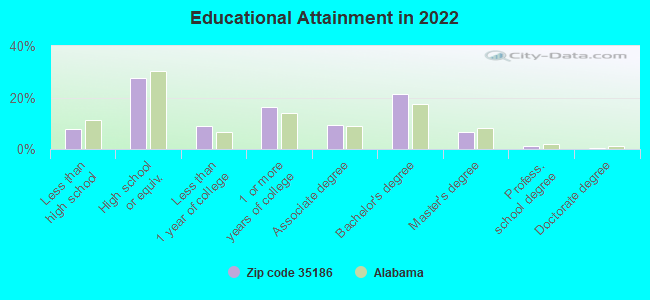
Private vs. public school enrollment:
Students in private schools in grades 1 to 8 (elementary and middle school): 42
Here:
8.0%
Alabama:
14.7%
Students in private schools in grades 9 to 12 (high school): 44
Here:
18.8%
Alabama:
16.3%
Students in private undergraduate colleges: 15
Here:
10.6%
Alabama:
14.6%
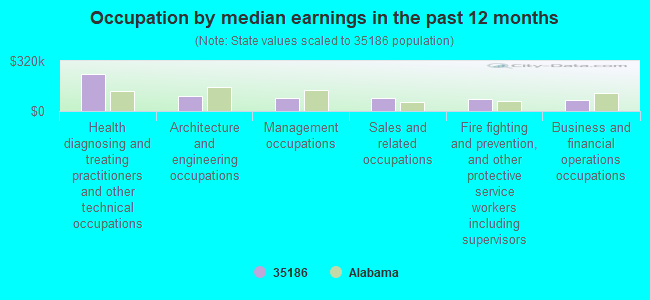
Occupation by median earnings in the past 12 months ($)
233,852Health diagnosing and treating practitioners and other technical occupations
99,091Architecture and engineering occupations
86,300Management occupations
82,235Sales and related occupations
78,975Fire fighting and prevention, and other protective service workers including supervisors
71,604Business and financial operations occupations
Top industries in this zip code by the number of employees in 2005:
Utilities: Electric Power Distribution (250-499 employees: 1 establishment, 50-99 employees: 2 establishments)
Professional, Scientific, and Technical Services: All Other Professional, Scientific, and Technical Services (20-49: 1)
Health Care and Social Assistance: Other Residential Care Facilities (20-49: 1)
Other Services (except Public Administration): Religious Organizations (10-19: 1, 1-4: 1)
Accommodation and Food Services: Limited-Service Restaurants (10-19: 1)
Professional, Scientific, and Technical Services: Graphic Design Services (10-19: 1)
Accommodation and Food Services: Full-Service Restaurants (10-19: 1)
Construction: New Single-Family Housing Construction (except Operative Builders) (5-9: 1, 1-4: 1)
People in group quarters in 2010:
28 people in residential treatment centers for juveniles (non-correctional)
12 people in workers' group living quarters and job corps centers
11 people in correctional facilities intended for juveniles
People in group quarters in 2000:
4 people in homes for the physically handicapped
Fatal accident statistics in 2013:
Fatal accident count: 1
Vehicles involved in fatal accidents: 1
Fatal accidents caused by drunken drivers: 0
Fatalities: 1
Persons involved in fatal accidents: 1
Pedestrians involved in fatal accidents: 0
Fatal accident statistics in 2012:
Fatal accident count: 1
Vehicles involved in fatal accidents: 1
Fatal accidents caused by drunken drivers: 0
Fatalities: 1
Persons involved in fatal accidents: 1
Pedestrians involved in fatal accidents: 0
Home Mortgage Disclosure Act Aggregated Statistics For Year 2009 (Based on 1 partial tract)
A) FHA, FSA/RHS & VA Home Purchase Loans
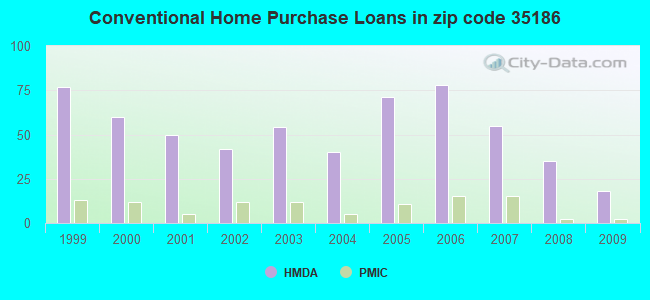
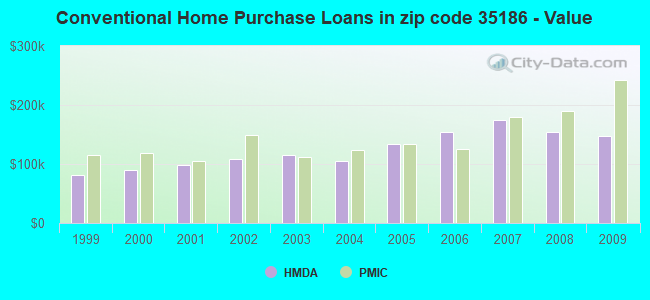
B) Conventional Home Purchase Loans
C) Refinancings
D) Home Improvement Loans
F) Non-occupant Loans on < 5 Family Dwellings (A B C & D)
G) Loans On Manufactured Home Dwelling (A B C & D)
Number
Average Value
Number
Average Value
Number
Average Value
Number
Average Value
Number
Average Value
Number
Average Value
LOANS ORIGINATED
21
$160,285
18
$148,187
85
$163,551
10
$32,161
8
$223,491
11
$47,490
APPLICATIONS APPROVED, NOT ACCEPTED
1
$142,630
2
$181,700
6
$163,985
1
$2,730
0
$0
1
$69,050
APPLICATIONS DENIED
4
$109,702
6
$77,828
34
$188,246
2
$5,905
2
$86,760
5
$53,420
APPLICATIONS WITHDRAWN
1
$127,190
2
$112,200
20
$174,750
4
$71,090
0
$0
3
$60,263
FILES CLOSED FOR INCOMPLETENESS
1
$125,370
1
$140,820
4
$178,748
1
$338,870
0
$0
1
$82,670
Aggregated Statistics For Year 2008 (Based on 1 partial tract)
A) FHA, FSA/RHS & VA Home Purchase Loans
B) Conventional Home Purchase Loans
C) Refinancings
D) Home Improvement Loans
F) Non-occupant Loans on < 5 Family Dwellings (A B C & D)
G) Loans On Manufactured Home Dwelling (A B C & D)
Number
Average Value
Number
Average Value
Number
Average Value
Number
Average Value
Number
Average Value
Number
Average Value
LOANS ORIGINATED
12
$117,423
35
$154,990
62
$149,565
13
$27,954
4
$89,942
19
$54,749
APPLICATIONS APPROVED, NOT ACCEPTED
2
$15,445
11
$106,295
4
$186,242
1
$8,180
0
$0
7
$53,471
APPLICATIONS DENIED
2
$68,140
15
$107,263
37
$139,835
4
$38,610
1
$56,330
18
$68,390
APPLICATIONS WITHDRAWN
4
$99,708
5
$104,296
19
$176,010
1
$21,800
2
$157,170
3
$65,413
FILES CLOSED FOR INCOMPLETENESS
1
$69,950
1
$159,900
5
$182,608
1
$18,170
0
$0
0
$0
Aggregated Statistics For Year 2007 (Based on 1 partial tract)
A) FHA, FSA/RHS & VA Home Purchase Loans
B) Conventional Home Purchase Loans
C) Refinancings
D) Home Improvement Loans
F) Non-occupant Loans on < 5 Family Dwellings (A B C & D)
G) Loans On Manufactured Home Dwelling (A B C & D)
Number
Average Value
Number
Average Value
Number
Average Value
Number
Average Value
Number
Average Value
Number
Average Value
LOANS ORIGINATED
5
$73,406
55
$175,093
80
$145,655
17
$72,145
10
$172,888
13
$57,795
APPLICATIONS APPROVED, NOT ACCEPTED
2
$56,325
5
$118,286
9
$140,919
2
$45,425
3
$186,847
6
$56,327
APPLICATIONS DENIED
0
$0
18
$122,244
37
$130,382
15
$86,853
4
$78,130
8
$66,889
APPLICATIONS WITHDRAWN
0
$0
10
$165,074
14
$151,979
4
$38,385
0
$0
3
$68,440
FILES CLOSED FOR INCOMPLETENESS
1
$93,580
5
$138,274
11
$126,034
1
$10,900
1
$31,800
0
$0
Aggregated Statistics For Year 2006 (Based on 1 partial tract)
A) FHA, FSA/RHS & VA Home Purchase Loans
B) Conventional Home Purchase Loans
C) Refinancings
D) Home Improvement Loans
F) Non-occupant Loans on < 5 Family Dwellings (A B C & D)
G) Loans On Manufactured Home Dwelling (A B C & D)
Number
Average Value
Number
Average Value
Number
Average Value
Number
Average Value
Number
Average Value
Number
Average Value
LOANS ORIGINATED
5
$87,398
78
$154,515
45
$128,482
14
$30,954
6
$134,307
18
$59,254
APPLICATIONS APPROVED, NOT ACCEPTED
0
$0
14
$74,756
10
$112,472
2
$23,620
0
$0
8
$56,781
APPLICATIONS DENIED
1
$38,160
28
$114,017
30
$112,654
13
$50,876
2
$156,715
19
$54,223
APPLICATIONS WITHDRAWN
1
$109,020
13
$120,831
38
$143,017
4
$69,272
5
$202,778
1
$78,130
FILES CLOSED FOR INCOMPLETENESS
0
$0
8
$158,192
15
$195,570
0
$0
2
$84,035
0
$0
Aggregated Statistics For Year 2005 (Based on 1 partial tract)
A) FHA, FSA/RHS & VA Home Purchase Loans
B) Conventional Home Purchase Loans
C) Refinancings
D) Home Improvement Loans
F) Non-occupant Loans on < 5 Family Dwellings (A B C & D)
G) Loans On Manufactured Home Dwelling (A B C & D)
Number
Average Value
Number
Average Value
Number
Average Value
Number
Average Value
Number
Average Value
Number
Average Value
LOANS ORIGINATED
5
$109,746
71
$133,614
73
$123,008
18
$42,397
9
$115,480
23
$42,779
APPLICATIONS APPROVED, NOT ACCEPTED
0
$0
17
$108,646
19
$144,117
2
$16,805
0
$0
9
$57,033
APPLICATIONS DENIED
0
$0
30
$76,526
37
$109,192
15
$62,323
3
$93,577
25
$37,794
APPLICATIONS WITHDRAWN
2
$91,760
5
$118,832
34
$133,844
5
$167,346
1
$134,460
6
$84,338
FILES CLOSED FOR INCOMPLETENESS
1
$64,500
1
$81,770
6
$181,095
1
$38,160
0
$0
0
$0
Aggregated Statistics For Year 2004 (Based on 1 partial tract)
A) FHA, FSA/RHS & VA Home Purchase Loans
B) Conventional Home Purchase Loans
C) Refinancings
D) Home Improvement Loans
F) Non-occupant Loans on < 5 Family Dwellings (A B C & D)
G) Loans On Manufactured Home Dwelling (A B C & D)
Number
Average Value
Number
Average Value
Number
Average Value
Number
Average Value
Number
Average Value
Number
Average Value
LOANS ORIGINATED
5
$80,856
40
$104,432
89
$124,822
15
$21,441
7
$53,601
19
$48,772
APPLICATIONS APPROVED, NOT ACCEPTED
0
$0
10
$105,659
15
$120,649
2
$24,985
0
$0
8
$60,756
APPLICATIONS DENIED
2
$80,855
29
$64,253
52
$92,615
7
$72,810
3
$86,003
30
$61,808
APPLICATIONS WITHDRAWN
1
$76,310
7
$150,161
32
$109,304
4
$79,040
3
$109,323
5
$63,594
FILES CLOSED FOR INCOMPLETENESS
0
$0
4
$65,412
24
$125,487
1
$135,370
0
$0
2
$67,685
Aggregated Statistics For Year 2003 (Based on 1 partial tract)
A) FHA, FSA/RHS & VA Home Purchase Loans
B) Conventional Home Purchase Loans
C) Refinancings
D) Home Improvement Loans
F) Non-occupant Loans on < 5 Family Dwellings (A B C & D)
Number
Average Value
Number
Average Value
Number
Average Value
Number
Average Value
Number
Average Value
LOANS ORIGINATED
6
$107,505
54
$115,817
144
$109,134
15
$35,068
14
$154,640
APPLICATIONS APPROVED, NOT ACCEPTED
2
$67,230
9
$88,428
13
$80,367
1
$181,700
1
$52,690
APPLICATIONS DENIED
3
$90,243
15
$56,630
40
$97,573
5
$20,714
1
$15,440
APPLICATIONS WITHDRAWN
3
$79,343
7
$121,480
36
$95,418
0
$0
1
$27,250
FILES CLOSED FOR INCOMPLETENESS
0
$0
4
$65,640
8
$115,380
2
$28,620
0
$0
Aggregated Statistics For Year 2002 (Based on 1 partial tract)
A) FHA, FSA/RHS & VA Home Purchase Loans
B) Conventional Home Purchase Loans
C) Refinancings
D) Home Improvement Loans
F) Non-occupant Loans on < 5 Family Dwellings (A B C & D)
Number
Average Value
Number
Average Value
Number
Average Value
Number
Average Value
Number
Average Value
LOANS ORIGINATED
4
$89,715
42
$108,695
111
$120,249
24
$16,240
9
$116,792
APPLICATIONS APPROVED, NOT ACCEPTED
0
$0
6
$71,772
21
$97,123
0
$0
1
$49,060
APPLICATIONS DENIED
0
$0
21
$68,440
25
$113,272
8
$44,402
2
$31,795
APPLICATIONS WITHDRAWN
0
$0
6
$99,783
23
$103,569
5
$69,046
0
$0
FILES CLOSED FOR INCOMPLETENESS
0
$0
1
$45,420
17
$108,432
0
$0
0
$0
Aggregated Statistics For Year 2001 (Based on 1 partial tract)
A) FHA, FSA/RHS & VA Home Purchase Loans
B) Conventional Home Purchase Loans
C) Refinancings
D) Home Improvement Loans
F) Non-occupant Loans on < 5 Family Dwellings (A B C & D)
Number
Average Value
Number
Average Value
Number
Average Value
Number
Average Value
Number
Average Value
LOANS ORIGINATED
5
$79,766
50
$98,100
94
$106,613
25
$15,154
13
$125,443
APPLICATIONS APPROVED, NOT ACCEPTED
0
$0
15
$46,697
5
$119,014
0
$0
0
$0
APPLICATIONS DENIED
0
$0
27
$78,703
22
$75,984
2
$7,270
2
$23,165
APPLICATIONS WITHDRAWN
1
$115,380
5
$67,228
20
$81,902
1
$2,730
1
$154,440
FILES CLOSED FOR INCOMPLETENESS
0
$0
1
$92,670
7
$132,381
0
$0
1
$204,410
Aggregated Statistics For Year 2000 (Based on 1 partial tract)
A) FHA, FSA/RHS & VA Home Purchase Loans
B) Conventional Home Purchase Loans
C) Refinancings
D) Home Improvement Loans
F) Non-occupant Loans on < 5 Family Dwellings (A B C & D)
Number
Average Value
Number
Average Value
Number
Average Value
Number
Average Value
Number
Average Value
LOANS ORIGINATED
11
$91,428
60
$89,336
25
$78,930
14
$13,692
3
$162,320
APPLICATIONS APPROVED, NOT ACCEPTED
2
$41,335
15
$48,999
3
$189,270
0
$0
0
$0
APPLICATIONS DENIED
2
$49,515
43
$44,559
10
$59,779
1
$9,080
2
$49,060
APPLICATIONS WITHDRAWN
1
$61,780
10
$67,774
4
$91,758
0
$0
1
$37,250
FILES CLOSED FOR INCOMPLETENESS
0
$0
6
$136,427
5
$77,040
0
$0
1
$128,100
Aggregated Statistics For Year 1999 (Based on 1 partial tract)
A) FHA, FSA/RHS & VA Home Purchase Loans
B) Conventional Home Purchase Loans
C) Refinancings
D) Home Improvement Loans
F) Non-occupant Loans on < 5 Family Dwellings (A B C & D)
Detailed PMIC statistics for the following Tracts:0308.00
2005 - 2018 National Fire Incident Reporting System (NFIRS) incidents
According to the data from the years 2005 - 2018 the average number of fires per year is 8. The highest number of fires - 33 took place in 2006, and the least - 0 in 2012. The data has a constant trend.
When looking into fire subcategories, the most incidents belonged to: Outside Fires (55.8%), and Structure Fires (31.0%).
Fire incident types reported to NFIRS in Zip Code 35186
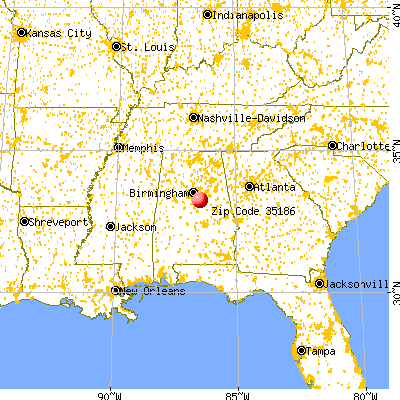


 Nearest zip codes: 35078, 35051, 35044, 35143, 35043, 35147.
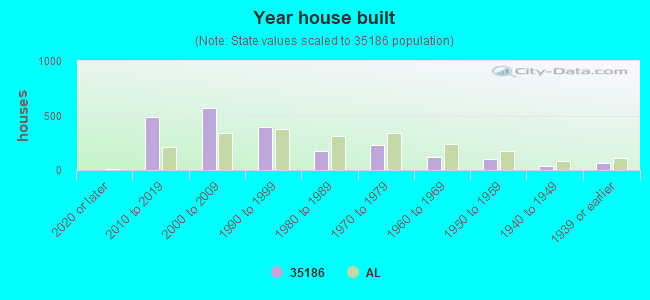


 According to the data from the years 2005 - 2018 the average number of fires per year is 8. The highest number of fires - 33 took place in 2006, and the least - 0 in 2012. The data has a constant trend.
 When looking into fire subcategories, the most incidents belonged to: Outside Fires (55.8%), and Structure Fires (31.0%).