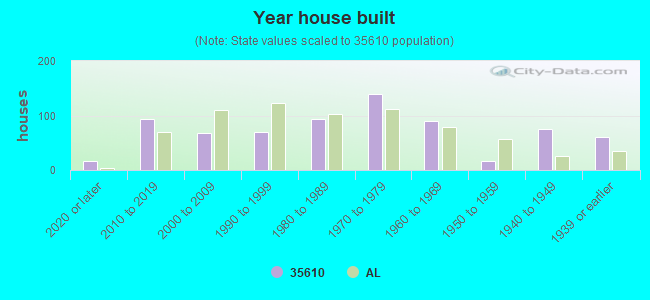
Estimated median house/condo value in 2022: $140,764
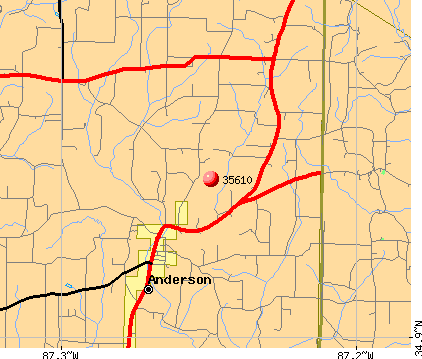
35610:
$140,764
Alabama:
$200,900
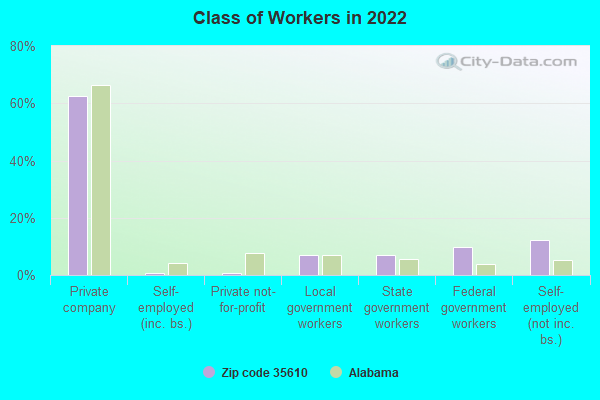
According to our research of Alabama and other state lists, there were 2 registered sex offenders living in 35610 zip code as of May 29, 2024. The ratio of all residents to sex offenders in zip code 35610 is 1,071 to 1. The ratio of registered sex offenders to all residents in this zip code is much lower than the state average.
Median resident age:
This zip code:
45.4 years
Alabama median age:
39.6 years
Average household size:
This zip code:
2.5 people
Alabama:
2.5 people
Averages for the 2020 tax year for zip code 35610, filed in 2021:
Average Adjusted Gross Income (AGI) in 2020: $53,167 (Individual Income Tax Returns)
Here:
$53,167
State:
$63,984
Salary/wage: $52,549 (reported on 78.2% of returns)
Here:
$52,549
State:
$52,834
(% of AGI for various income ranges: 1103.2% for AGIs below $25k, 3566.7% for AGIs $25k-50k, 6394.0% for AGIs $50k-75k, 9290.0% for AGIs $75k-100k, 18058.6% for AGIs $100k-200k)
Taxable interest for individuals: $967 (reported on 30.8% of returns)
This zip code:
$967
Alabama:
$1,615
(% of AGI for various income ranges: 30.0% for AGIs below $25k, 40.0% for AGIs $25k-50k, 43.0% for AGIs $50k-75k, 80.0% for AGIs $75k-100k, 34.3% for AGIs $100k-200k)
Ordinary dividends: $1,150 (reported on 10.3% of returns)
Here:
$1,150
State:
$7,660
(% of AGI for various income ranges: 23.7% for AGIs below $25k, 12.0% for AGIs $50k-75k, 50.0% for AGIs $100k-200k)
Net capital gain/loss in AGI: +$2,043 (reported on 9.0% of returns)
Here:
+$2,043
State:
+$23,528
(% of AGI for various income ranges: 38.0% for AGIs $25k-50k, 143.3% for AGIs $75k-100k)
Profit/loss from business: +$7,646 (reported on 16.7% of returns)
Here:
+$7,646
State:
+$9,534
(% of AGI for various income ranges: 194.2% for AGIs below $25k, 342.7% for AGIs $25k-50k, 1.0% for AGIs $50k-75k, 183.3% for AGIs $75k-100k)
Taxable individual retirement arrangement distribution: $11,186 (reported on 9.0% of returns)
35610:
$11,186
Alabama:
$19,004
(% of AGI for various income ranges: 186.3% for AGIs below $25k, 429.0% for AGIs $50k-75k)
Total itemized deductions: $28,900 (reported on 3.8% of returns)
Here:
$28,900
State:
$37,338
(% of AGI for various income ranges: 1445.0% for AGIs $75k-100k)
Taxes paid: $5,633 (reported on 3.8% of returns)
35610:
$5,633
State:
$6,484
(% of AGI for various income ranges: 281.7% for AGIs $75k-100k)
Earned income credit: $2,307 (reported on 17.9% of returns)
Here:
$2,307
State:
$2,628
(% of AGI for various income ranges: 105.8% for AGIs below $25k, 81.3% for AGIs $25k-50k)
Percentage of individuals using paid preparers for their 2020 taxes: 98.7%
Here:
99%
State:
93%
(% for various income ranges: 96.3% for AGIs below $25k, 100.0% for AGIs $25k-50k, 100.0% for AGIs $50k-75k, 100.0% for AGIs $75k-100k, 100.0% for AGIs $100k-200k)
Averages for the 2012 tax year for zip code 35610, filed in 2013:
Average Adjusted Gross Income (AGI) in 2012: $42,972 (Individual Income Tax Returns)
Here:
$42,972
State:
$52,001
Salary/wage: $40,890 (reported on 82.4% of returns)
Here:
$40,890
State:
$43,822
(% of AGI for various income ranges: 66.7% for AGIs below $25k, 81.9% for AGIs $25k-50k, 77.4% for AGIs $50k-75k, 81.7% for AGIs $75k-100k, 79.8% for AGIs $100k-200k)
Taxable interest for individuals: $760 (reported on 33.8% of returns)
This zip code:
$760
Alabama:
$1,592
(% of AGI for various income ranges: 1.1% for AGIs below $25k, 0.7% for AGIs $25k-50k, 0.4% for AGIs $50k-75k, 0.8% for AGIs $75k-100k, 0.3% for AGIs $100k-200k)
Ordinary dividends: $571 (reported on 9.5% of returns)
Here:
$571
State:
$5,697
Net capital gain/loss in AGI: +$233 (reported on 4.1% of returns)
Here:
+$233
State:
+$13,286
Profit/loss from business: +$5,846 (reported on 17.6% of returns)
Here:
+$5,846
State:
+$9,151
(% of AGI for various income ranges: 12.9% for AGIs below $25k, 3.1% for AGIs $25k-50k, 0.9% for AGIs $50k-75k, 0.2% for AGIs $75k-100k)
Taxable individual retirement arrangement distribution: $11,733 (reported on 8.1% of returns)
35610:
$11,733
Alabama:
$14,992
Total itemized deductions: $17,150 (24% of AGI, reported on 21.6% of returns)
Here:
$17,150
State:
$21,388
Here:
23.9% of AGI
State:
20.1% of AGI
(% of AGI for various income ranges: 7.3% for AGIs below $25k, 6.1% for AGIs $25k-50k, 9.8% for AGIs $50k-75k, 9.8% for AGIs $75k-100k, 9.3% for AGIs $100k-200k)
Charity contributions: $3,929 (reported on 18.9% of returns)
Here:
$3,929
State:
$5,925
(% of AGI for various income ranges: 1.5% for AGIs $25k-50k, 1.4% for AGIs $50k-75k, 2.6% for AGIs $75k-100k, 2.4% for AGIs $100k-200k)
Taxes paid: $3,288 (reported on 21.6% of returns)
35610:
$3,288
State:
$5,272
(% of AGI for various income ranges: 0.8% for AGIs below $25k, 0.9% for AGIs $25k-50k, 1.5% for AGIs $50k-75k, 2.0% for AGIs $75k-100k, 2.5% for AGIs $100k-200k)
Earned income credit: $2,338 (reported on 21.6% of returns)
Here:
$2,338
State:
$2,646
(% of AGI for various income ranges: 6.7% for AGIs below $25k, 2.0% for AGIs $25k-50k)
Percentage of individuals using paid preparers for their 2012 taxes: 82.4%
Here:
82%
State:
60%
(% for various income ranges: 80.0% for AGIs below $25k, 83.3% for AGIs $25k-50k, 84.6% for AGIs $50k-75k, 85.7% for AGIs $75k-100k, 83.3% for AGIs $100k-200k)
Averages for the 2004 tax year for zip code 35610, filed in 2005:
Average Adjusted Gross Income (AGI) in 2004: $32,732 (Individual Income Tax Returns)
Here:
$32,732
State:
$42,302
Salary/wage: $33,316 (reported on 81.9% of returns)
Here:
$33,316
State:
$36,626
(% of AGI for various income ranges: 96.8% for AGIs below $10k, 72.7% for AGIs $10k-25k, 92.1% for AGIs $25k-50k, 83.0% for AGIs $50k-75k, 84.8% for AGIs $75k-100k, 63.9% for AGIs over 100k)
Taxable interest for individuals: $1,131 (reported on 41.2% of returns)
This zip code:
$1,131
Alabama:
$1,827
(% of AGI for various income ranges: 4.8% for AGIs below $10k, 3.2% for AGIs $10k-25k, 1.2% for AGIs $25k-50k, 1.5% for AGIs $50k-75k, 0.4% for AGIs $75k-100k, 0.4% for AGIs over 100k)
Taxable dividends: $932 (reported on 15.0% of returns)
Here:
$932
State:
$4,206
(% of AGI for various income ranges: 4.1% for AGIs below $10k, 0.5% for AGIs $10k-25k, 0.1% for AGIs $25k-50k, 0.7% for AGIs $50k-75k, 0.2% for AGIs $75k-100k)
Net capital gain/loss: +$1,413 (reported on 8.1% of returns)
Here:
+$1,413
State:
+$13,031
(% of AGI for various income ranges: -0.6% for AGIs $10k-25k, 0.1% for AGIs $25k-50k, 0.2% for AGIs $50k-75k, 1.8% for AGIs $75k-100k)
Profit/loss from business: +$1,729 (reported on 17.9% of returns)
Here:
+$1,729
State:
+$8,302
(% of AGI for various income ranges: 0.8% for AGIs below $10k, 1.3% for AGIs $10k-25k, 1.8% for AGIs $25k-50k, 0.8% for AGIs $50k-75k, 0.0% for AGIs $75k-100k)
Total itemized deductions: $13,831 (25% of AGI, reported on 22.1% of returns)
Here:
$13,831
State:
$17,623
Here:
25.0% of AGI
State:
20.8% of AGI
(% of AGI for various income ranges: 13.0% for AGIs below $10k, 9.2% for AGIs $10k-25k, 8.3% for AGIs $25k-50k, 9.2% for AGIs $50k-75k, 9.8% for AGIs $75k-100k, 11.0% for AGIs over 100k)
Charity contributions deductions: $3,625 (6% of AGI, reported on 18.5% of returns)
Here:
$3,625
State:
$4,768
Here:
6.2% of AGI
State:
5.4% of AGI
(% of AGI for various income ranges: 2.1% for AGIs $10k-25k, 1.4% for AGIs $25k-50k, 1.6% for AGIs $50k-75k, 3.1% for AGIs $75k-100k, 3.8% for AGIs over 100k)
Total tax: $3,593 (reported on 72.1% of returns)
35610:
$3,593
State:
$6,905
(% of AGI for various income ranges: 4.6% for AGIs below $10k, 3.6% for AGIs $10k-25k, 5.2% for AGIs $25k-50k, 8.2% for AGIs $50k-75k, 11.4% for AGIs $75k-100k, 15.8% for AGIs over 100k)
Earned income credit: $1,632 (reported on 19.5% of returns)
Here:
$1,632
State:
$2,048
Percentage of individuals using paid preparers for their 2004 taxes: 78.1%
Here:
78%
State:
65%
(% for various income ranges: 73.5% for AGIs below $10k, 74.0% for AGIs $10k-25k, 81.6% for AGIs $25k-50k, 84.5% for AGIs $50k-75k, 83.3% for AGIs $75k-100k, 73.7% for AGIs over 100k)
Likely homosexual households (counted as self-reported same-sex unmarried-partner households)
Lesbian couples: 0.3% of all households
Gay men: 0.0% of all households
Household received Food Stamps/SNAP in the past 12 months: 79 Household did not receive Food Stamps/SNAP in the past 12 months: 621
Women who had a birth in the past 12 months: 38 (36 now married, 4 unmarried) Women who did not have a birth in the past 12 months: 253 (166 now married, 86 unmarried)
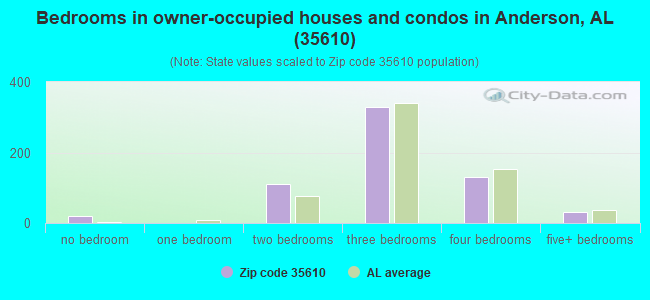
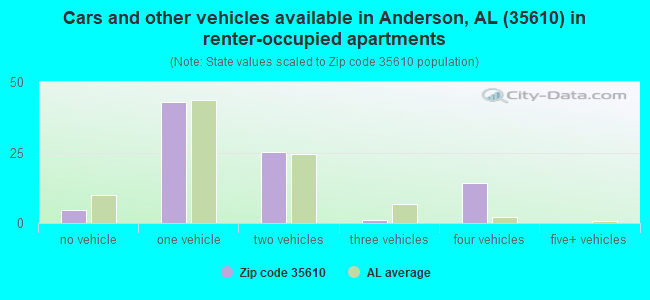
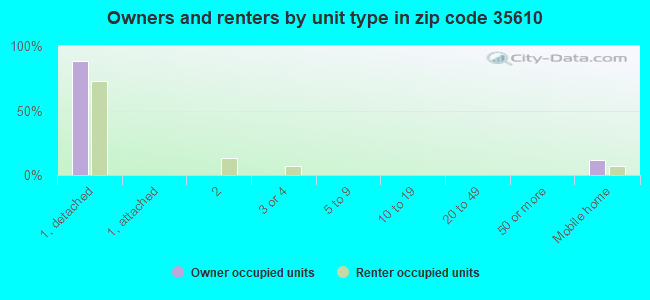
Housing units in zip code 35610 with a mortgage: 385 (36 second mortgage, 37 both second mortgage and home equity loan) Houses without a mortgage: 3
Median monthly owner costs for units with a mortgage: $1,093 Median monthly owner costs for units without a mortgage: $395
Residents with income below the poverty level in 2022:
This zip code:
7.6%
Whole state:
16.2%
Residents with income below 50% of the poverty level in 2022:
This zip code:
5.5%
Whole state:
8.6%
Median number of rooms in houses and condos:
Here:
6.5
State:
6.5
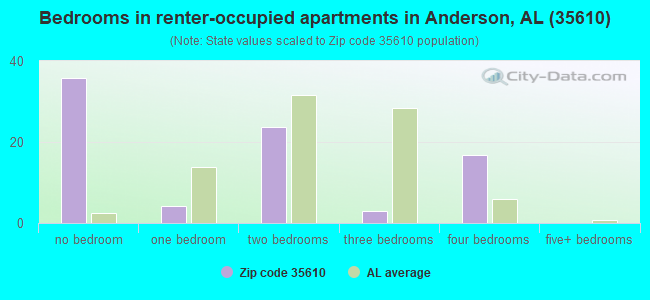
Median number of rooms in apartments:
Here:
2.3
State:
4.7
Notable locations in this zip code not listed on our city pages
Notable locations in zip code 35610: Anderson Volunteer Fire Department (A), Good Springs Volunteer Fire Department (B). Display/hide their locations on the map
Churches in zip code 35610 include: Oxford Church of Christ (A), Old Union Church (B), Mitchell Chapel (C), Union Hill Church (D), Bethel Memorial Baptist Church (E), Beulah Church (F), Grassy Church (G), Enon Church (H), Hurricane Springs Primitive Baptist Church (I). Display/hide their locations on the map
Cemeteries: Oak Grove Cemetery (1), McCravy Cemetery (2), Mitchell Cemetery (3), Elledge Cemetery (4), Union Hill Cemetery (5), Hammond Cemetery (6). Display/hide their locations on the map
Size of family households: 282 2-persons, 196 3-persons, 10 4-persons, 29 5-persons, 15 6-persons, 13 7-or-more-persons
Size of nonfamily households: 134 1-person, 26 2-persons
133 married couples with children.
13 single-parent households (13 women).
94.1% of residents of 35610 zip code speak English at home.
0.3% of residents speak Spanish at home (100% very well).
3.8% of residents speak other Indo-European language at home (98% very well, 2% well).
1.5% of residents speak other language at home (60% well, 40% not well).
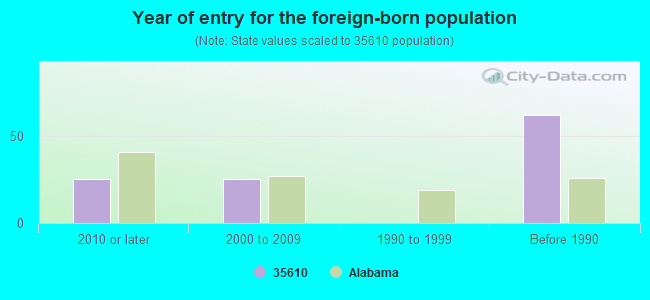
Foreign born population: 49 (2.8%) (49.7% of them are naturalized citizens)
This zip code:
2.8%
Whole state:
3.8%
41%Czechoslovakia (includes Czech Republic and Slovakia)
39%Bhutan
11%Kazakhstan
4%Mexico
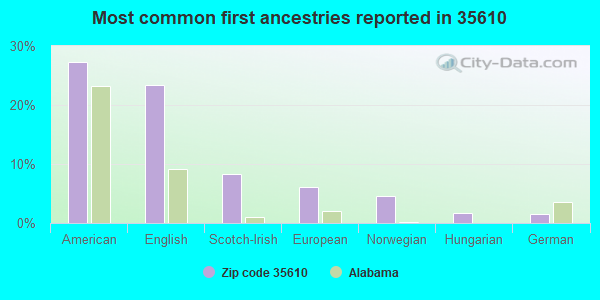
27%American
23%English
8%Scotch-Irish
6%European
5%Norwegian
2%Hungarian
1%German
Year of entry for the foreign-born population
252010 or later
252000 to 2009
01990 to 1999
62Before 1990
Facilities with environmental interests located in this zip code:
ANDERSON JUNIOR HIGH SCHOOL (201 BAYLES ST in ANDERSON, AL)
(Geographic Names Information System) (National Center for Education Statistics) - STATE ID-0010 Organizations: LAUDERDALE COUNTY (SCHOOL DISTRICT)
ANDERSON JUNIOR HIGH SCH WWTP (LAUDERDALE CO BD OF EDUCATION in ANDERSON, AL)
National Pollutant Discharge Elimination System NON-MAJOR (Tracking pollutant discharge elimination systems) - permit Business SIC classification: ELEMENTARY AND SECONDARY SCHOOLS Alternative names: LAUDERDALE CO BOE ANDERSON SCH, LAUDERDALE CNTY BOARD OF ED
ROGERS HIGH SCHOOL LAGOON (LAUDERDALE COUNTY BOARD OF ED in ANDERSON, AL)
National Pollutant Discharge Elimination System NON-MAJOR (Tracking pollutant discharge elimination systems) - permit Business SIC classification: ELEMENTARY AND SECONDARY SCHOOLS Alternative names: LAUDERDALE BOE ROGERS HS LAGON, LAUDERDALE COUNTY BOARD OF ED
MOSLEY FARM (ROGER MOSLEY in ANDERSON, AL)
National Pollutant Discharge Elimination System NON-MAJOR (Tracking pollutant discharge elimination systems) - permit Business SIC classification: NONCLASSIFIABLE ESTABLISHMENTS
BILLY SHELTON USED CARS & PART (7108 SHELTON ROAD W in ANDERSON, AL)
National Pollutant Discharge Elimination System NON-MAJOR (Tracking pollutant discharge elimination systems) - permit Business SIC classification: MOTOR VEHICLE PARTS, USED Organizations: BILLY SHELTON USED CARS & PTS (CONTACT/OWNER)
Housing units lacking complete plumbing facilities: 5.4% Housing units lacking complete kitchen facilities: 1.8%
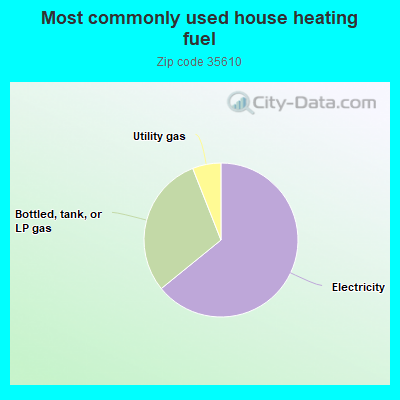
64.4%Electricity
30.0%Bottled, tank, or LP gas
6.0%Utility gas
Population in 1990: 2,039. Population change in the 1990s: +64 (+3.1%).
Place of birth for U.S.-born residents:
This state: 1,322
Northeast: 25
Midwest: 71
South: 201
West: 6
69% of the 35610 zip code residents lived in the same house 5 years ago. Out of people who lived in different houses, 74% lived in this county. Out of people who lived in different counties, 50% lived in Alabama.
89% of the 35610 zip code residents lived in the same house 1 year ago. Out of people who lived in different houses, 77% moved from this county. Out of people who lived in different houses, 3% moved from different county within same state. Out of people who lived in different houses, 14% moved from different state.
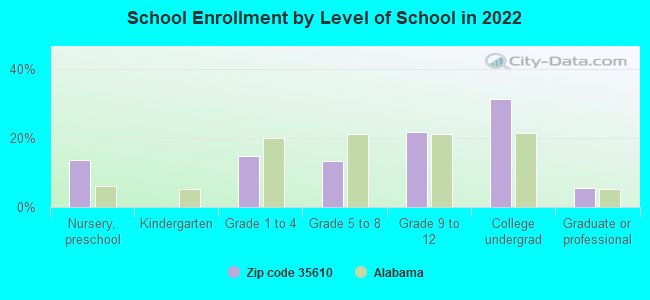
Private vs. public school enrollment:
Students in private schools in grades 1 to 8 (elementary and middle school): 15
Here:
21.3%
Alabama:
14.7%
Students in private schools in grades 9 to 12 (high school): 16
Here:
28.3%
Alabama:
16.3%
Students in private undergraduate colleges:
Here:
0.0%
Alabama:
14.6%
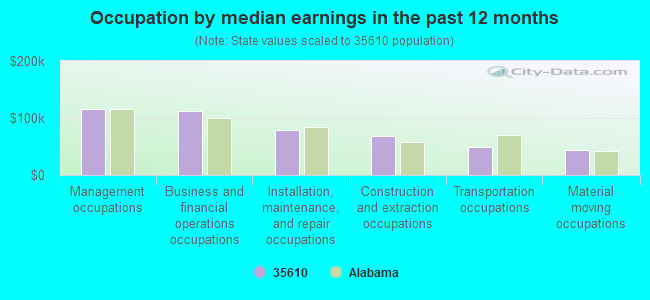
Occupation by median earnings in the past 12 months ($)
115,651Management occupations
111,891Business and financial operations occupations
78,804Installation, maintenance, and repair occupations
69,225Construction and extraction occupations
48,537Transportation occupations
43,218Material moving occupations
Top industries in this zip code by the number of employees in 2005:
Other Services (except Public Administration): Automotive Body, Paint, and Interior Repair and Maintenance (5-9 employees: 1 establishment)
Accommodation and Food Services: Full-Service Restaurants (5-9: 1)
Construction: Drywall and Insulation Contractors (1-4: 2)
Arts, Entertainment, and Recreation: Golf Courses and Country Clubs (1-4: 1)
Wholesale Trade: Wholesale Trade Agents and Brokers (1-4: 1)
Construction: Structural Steel and Precast Concrete Contractors (1-4: 1)
Fatal accident statistics in 2014:
Fatal accident count: 2
Vehicles involved in fatal accidents: 2
Fatal accidents caused by drunken drivers: 1
Fatalities: 3
Persons involved in fatal accidents: 3
Pedestrians involved in fatal accidents: 2
Fatal accident statistics in 2012:
Fatal accident count: 1
Vehicles involved in fatal accidents: 1
Fatal accidents caused by drunken drivers: 1
Fatalities: 1
Persons involved in fatal accidents: 1
Pedestrians involved in fatal accidents: 0
Home Mortgage Disclosure Act Aggregated Statistics For Year 2009 (Based on 2 partial tracts)
A) FHA, FSA/RHS & VA Home Purchase Loans
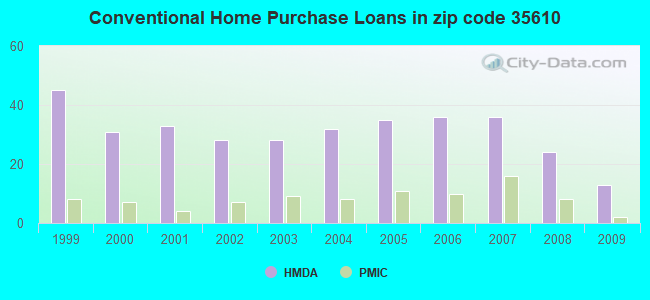
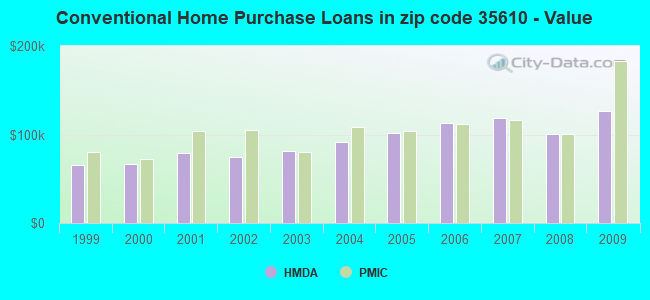
B) Conventional Home Purchase Loans
C) Refinancings
D) Home Improvement Loans
F) Non-occupant Loans on < 5 Family Dwellings (A B C & D)
G) Loans On Manufactured Home Dwelling (A B C & D)
Number
Average Value
Number
Average Value
Number
Average Value
Number
Average Value
Number
Average Value
Number
Average Value
LOANS ORIGINATED
7
$132,651
13
$126,261
64
$142,125
9
$26,746
13
$143,650
6
$29,873
APPLICATIONS APPROVED, NOT ACCEPTED
1
$58,310
2
$61,820
3
$121,413
1
$1,760
0
$0
1
$46,390
APPLICATIONS DENIED
1
$194,090
4
$90,980
22
$112,674
3
$28,117
1
$115,320
4
$57,108
APPLICATIONS WITHDRAWN
1
$184,000
0
$0
11
$128,578
1
$40,980
1
$95,500
0
$0
FILES CLOSED FOR INCOMPLETENESS
0
$0
0
$0
4
$124,330
0
$0
0
$0
0
$0
Aggregated Statistics For Year 2008 (Based on 2 partial tracts)
A) FHA, FSA/RHS & VA Home Purchase Loans
B) Conventional Home Purchase Loans
C) Refinancings
D) Home Improvement Loans
F) Non-occupant Loans on < 5 Family Dwellings (A B C & D)
G) Loans On Manufactured Home Dwelling (A B C & D)
Number
Average Value
Number
Average Value
Number
Average Value
Number
Average Value
Number
Average Value
Number
Average Value
LOANS ORIGINATED
6
$101,668
24
$100,740
55
$130,363
8
$28,236
12
$122,622
8
$38,390
APPLICATIONS APPROVED, NOT ACCEPTED
1
$97,630
3
$65,183
5
$122,240
1
$39,070
1
$58,600
3
$54,387
APPLICATIONS DENIED
1
$91,890
4
$83,278
25
$116,357
5
$45,296
1
$62,020
4
$42,100
APPLICATIONS WITHDRAWN
0
$0
1
$157,630
9
$133,858
0
$0
0
$0
0
$0
FILES CLOSED FOR INCOMPLETENESS
0
$0
1
$117,390
3
$153,733
0
$0
0
$0
0
$0
Aggregated Statistics For Year 2007 (Based on 2 partial tracts)
A) FHA, FSA/RHS & VA Home Purchase Loans
B) Conventional Home Purchase Loans
C) Refinancings
D) Home Improvement Loans
F) Non-occupant Loans on < 5 Family Dwellings (A B C & D)
G) Loans On Manufactured Home Dwelling (A B C & D)
Number
Average Value
Number
Average Value
Number
Average Value
Number
Average Value
Number
Average Value
Number
Average Value
LOANS ORIGINATED
1
$186,950
36
$118,463
46
$113,463
11
$29,711
11
$101,005
8
$32,900
APPLICATIONS APPROVED, NOT ACCEPTED
1
$19,040
2
$102,430
4
$89,188
2
$70,155
1
$21,530
2
$38,870
APPLICATIONS DENIED
1
$73,490
6
$68,823
24
$96,935
9
$31,869
2
$83,090
6
$41,205
APPLICATIONS WITHDRAWN
0
$0
4
$150,158
8
$122,469
1
$48,640
1
$107,870
0
$0
FILES CLOSED FOR INCOMPLETENESS
0
$0
1
$74,420
3
$101,183
0
$0
0
$0
0
$0
Aggregated Statistics For Year 2006 (Based on 2 partial tracts)
A) FHA, FSA/RHS & VA Home Purchase Loans
B) Conventional Home Purchase Loans
C) Refinancings
D) Home Improvement Loans
F) Non-occupant Loans on < 5 Family Dwellings (A B C & D)
G) Loans On Manufactured Home Dwelling (A B C & D)
Number
Average Value
Number
Average Value
Number
Average Value
Number
Average Value
Number
Average Value
Number
Average Value
LOANS ORIGINATED
3
$87,153
36
$112,501
53
$84,399
9
$42,086
13
$95,645
9
$31,477
APPLICATIONS APPROVED, NOT ACCEPTED
0
$0
3
$68,630
10
$79,584
2
$33,000
2
$68,485
2
$65,160
APPLICATIONS DENIED
0
$0
13
$73,332
33
$91,592
6
$32,568
3
$66,487
9
$41,252
APPLICATIONS WITHDRAWN
0
$0
2
$218,580
13
$111,075
2
$60,065
0
$0
0
$0
FILES CLOSED FOR INCOMPLETENESS
0
$0
1
$95,730
8
$108,730
0
$0
0
$0
0
$0
Aggregated Statistics For Year 2005 (Based on 2 partial tracts)
A) FHA, FSA/RHS & VA Home Purchase Loans
B) Conventional Home Purchase Loans
C) Refinancings
D) Home Improvement Loans
F) Non-occupant Loans on < 5 Family Dwellings (A B C & D)
G) Loans On Manufactured Home Dwelling (A B C & D)
Number
Average Value
Number
Average Value
Number
Average Value
Number
Average Value
Number
Average Value
Number
Average Value
LOANS ORIGINATED
2
$102,965
35
$101,517
43
$80,753
9
$29,623
13
$87,011
10
$27,924
APPLICATIONS APPROVED, NOT ACCEPTED
0
$0
5
$93,070
7
$78,876
2
$35,835
1
$117,790
3
$38,510
APPLICATIONS DENIED
1
$31,060
13
$63,945
33
$93,658
6
$38,297
2
$145,545
9
$42,114
APPLICATIONS WITHDRAWN
0
$0
4
$97,355
20
$103,500
2
$157,510
1
$137,530
2
$57,200
FILES CLOSED FOR INCOMPLETENESS
0
$0
1
$76,030
10
$115,195
0
$0
0
$0
0
$0
Aggregated Statistics For Year 2004 (Based on 2 partial tracts)
A) FHA, FSA/RHS & VA Home Purchase Loans
B) Conventional Home Purchase Loans
C) Refinancings
D) Home Improvement Loans
F) Non-occupant Loans on < 5 Family Dwellings (A B C & D)
G) Loans On Manufactured Home Dwelling (A B C & D)
Number
Average Value
Number
Average Value
Number
Average Value
Number
Average Value
Number
Average Value
Number
Average Value
LOANS ORIGINATED
3
$97,193
32
$91,039
54
$88,312
8
$19,392
9
$100,791
11
$29,375
APPLICATIONS APPROVED, NOT ACCEPTED
0
$0
5
$99,064
10
$79,168
1
$39,560
0
$0
2
$39,985
APPLICATIONS DENIED
1
$30,670
10
$68,064
30
$82,186
5
$32,356
1
$153,210
6
$37,812
APPLICATIONS WITHDRAWN
0
$0
2
$116,125
9
$103,836
1
$87,190
1
$111,720
0
$0
FILES CLOSED FOR INCOMPLETENESS
0
$0
1
$96,210
10
$99,312
0
$0
0
$0
0
$0
Aggregated Statistics For Year 2003 (Based on 2 partial tracts)
A) FHA, FSA/RHS & VA Home Purchase Loans
B) Conventional Home Purchase Loans
C) Refinancings
D) Home Improvement Loans
F) Non-occupant Loans on < 5 Family Dwellings (A B C & D)
Number
Average Value
Number
Average Value
Number
Average Value
Number
Average Value
Number
Average Value
LOANS ORIGINATED
3
$75,740
28
$81,047
99
$94,477
10
$17,905
13
$91,418
APPLICATIONS APPROVED, NOT ACCEPTED
0
$0
4
$65,685
12
$87,690
1
$18,710
1
$60,380
APPLICATIONS DENIED
1
$100,990
10
$58,343
38
$80,464
5
$26,648
3
$98,487
APPLICATIONS WITHDRAWN
0
$0
2
$115,065
12
$115,488
0
$0
0
$0
FILES CLOSED FOR INCOMPLETENESS
0
$0
1
$51,220
3
$83,370
0
$0
0
$0
Aggregated Statistics For Year 2002 (Based on 2 partial tracts)
A) FHA, FSA/RHS & VA Home Purchase Loans
B) Conventional Home Purchase Loans
C) Refinancings
D) Home Improvement Loans
F) Non-occupant Loans on < 5 Family Dwellings (A B C & D)
Number
Average Value
Number
Average Value
Number
Average Value
Number
Average Value
Number
Average Value
LOANS ORIGINATED
1
$128,080
28
$75,056
73
$84,503
13
$18,171
11
$71,056
APPLICATIONS APPROVED, NOT ACCEPTED
0
$0
5
$50,866
5
$69,942
1
$57,130
0
$0
APPLICATIONS DENIED
0
$0
11
$39,182
20
$85,278
3
$12,147
1
$36,450
APPLICATIONS WITHDRAWN
0
$0
2
$113,460
10
$86,311
0
$0
1
$75,010
FILES CLOSED FOR INCOMPLETENESS
0
$0
1
$28,690
4
$81,792
0
$0
0
$0
Aggregated Statistics For Year 2001 (Based on 2 partial tracts)
A) FHA, FSA/RHS & VA Home Purchase Loans
B) Conventional Home Purchase Loans
C) Refinancings
D) Home Improvement Loans
F) Non-occupant Loans on < 5 Family Dwellings (A B C & D)
Number
Average Value
Number
Average Value
Number
Average Value
Number
Average Value
Number
Average Value
LOANS ORIGINATED
2
$67,625
33
$78,759
66
$79,002
14
$15,564
9
$59,756
APPLICATIONS APPROVED, NOT ACCEPTED
0
$0
8
$37,081
5
$70,612
1
$14,630
0
$0
APPLICATIONS DENIED
1
$96,520
14
$40,241
21
$80,435
4
$17,448
2
$68,415
APPLICATIONS WITHDRAWN
0
$0
5
$60,830
10
$81,871
1
$36,010
1
$34,970
FILES CLOSED FOR INCOMPLETENESS
0
$0
0
$0
3
$114,810
0
$0
0
$0
Aggregated Statistics For Year 2000 (Based on 2 partial tracts)
A) FHA, FSA/RHS & VA Home Purchase Loans
B) Conventional Home Purchase Loans
C) Refinancings
D) Home Improvement Loans
F) Non-occupant Loans on < 5 Family Dwellings (A B C & D)
Number
Average Value
Number
Average Value
Number
Average Value
Number
Average Value
Number
Average Value
LOANS ORIGINATED
2
$61,175
31
$66,340
30
$66,618
14
$12,366
6
$81,192
APPLICATIONS APPROVED, NOT ACCEPTED
2
$34,135
9
$39,284
2
$45,985
1
$17,290
1
$18,990
APPLICATIONS DENIED
1
$73,360
24
$36,984
9
$59,303
4
$9,245
2
$31,830
APPLICATIONS WITHDRAWN
2
$38,070
4
$54,478
5
$62,456
0
$0
0
$0
FILES CLOSED FOR INCOMPLETENESS
0
$0
2
$61,890
5
$69,212
0
$0
0
$0
Aggregated Statistics For Year 1999 (Based on 2 partial tracts)
A) FHA, FSA/RHS & VA Home Purchase Loans
B) Conventional Home Purchase Loans
C) Refinancings
D) Home Improvement Loans
F) Non-occupant Loans on < 5 Family Dwellings (A B C & D)


 Nearest zip codes: 38457, 38473, 35652, 35647, 35648, 38460.