Estimated zip code population in 2022: 4,782 Zip code population in 2010: 5,135 Zip code population in 2000: 5,095
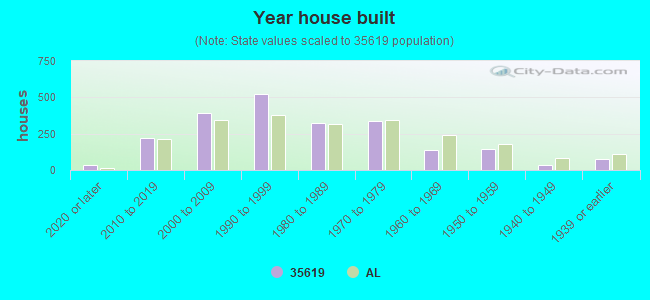
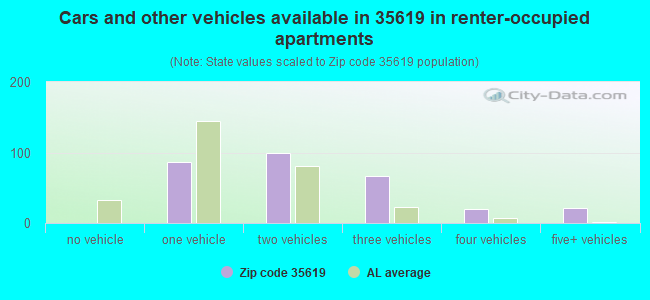
Houses and condos: 2,267 Renter-occupied apartments: 286
% of renters here:
15%
State:
30%
March 2022 cost of living index in zip code 35619: 82.0 (low, U.S. average is 100)
Land area: 130.1 sq. mi. Water area: 0.5 sq. mi.
Population density: 37 people per square mile
(very low).
OSM Map
General Map
Google Map
MSN Map
OSM Map
General Map
Google Map
MSN Map
OSM Map
General Map
Google Map
MSN Map
OSM Map
General Map
Google Map
MSN Map
Please wait while loading the map...
Real estate property taxes paid for housing units in 2022:
This zip code:
0.3% ($552)
Alabama:
0.4% ($718)
Median real estate property taxes paid for housing units with mortgages in 2022: $561 (0.3%) Median real estate property taxes paid for housing units with no mortgage in 2022: $550 (0.4%)
Business Search- 14 Million verified businesses
Males: 2,480
(51.9%)
Females: 2,301
(48.1%)
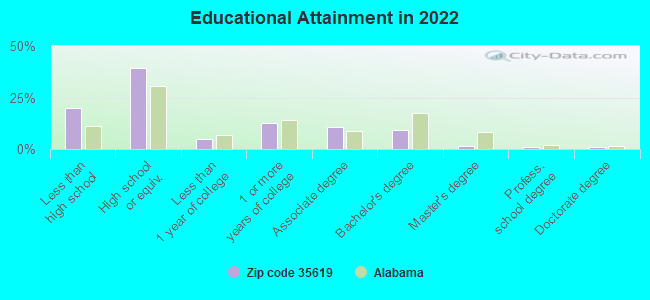
For population 25 years and over in 35619:
High school or higher: 79.0%
Bachelor's degree or higher: 12.3%
Graduate or professional degree: 2.9%
Unemployed: 3.5%
Mean travel time to work (commute): 31.2 minutes
For population 15 years and over in 35619:
Never married: 21.5%
Now married: 65.8%
Separated: 2.4%
Widowed: 4.0%
Divorced: 6.4%
Zip code 35619 compared to state average:
Black race population percentage significantly below state average.
Hispanic race population percentage below state average.
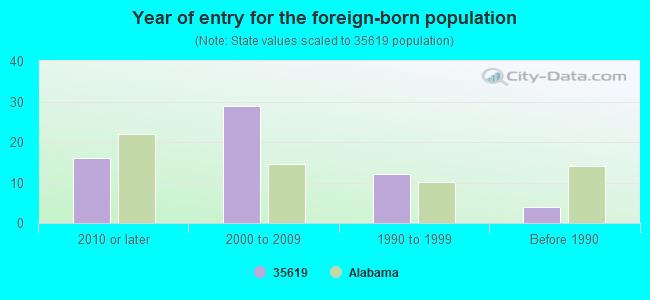
Foreign-born population percentage significantly below state average.
Renting percentage below state average.
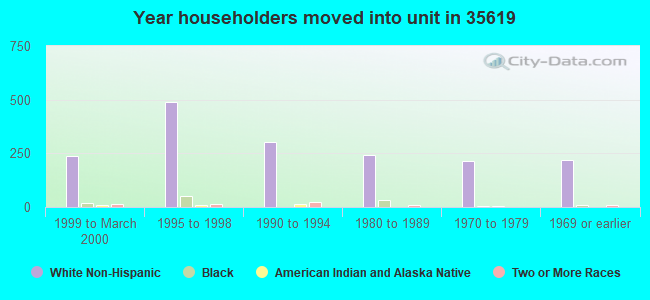
Length of stay since moving in significantly above state average.
Percentage of population with a bachelor's degree or higher significantly below state average.
Averages for the 2020 tax year for zip code 35619, filed in 2021:
Average Adjusted Gross Income (AGI) in 2020: $56,227 (Individual Income Tax Returns)
Here:
$56,227
State:
$63,984
Salary/wage: $49,760 (reported on 82.0% of returns)
Here:
$49,760
State:
$52,834
(% of AGI for various income ranges: 1120.5% for AGIs below $25k, 3506.9% for AGIs $25k-50k, 6711.2% for AGIs $50k-75k, 9755.9% for AGIs $75k-100k, 16700.0% for AGIs $100k-200k)
Taxable interest for individuals: $1,220 (reported on 27.2% of returns)
This zip code:
$1,220
Alabama:
$1,615
(% of AGI for various income ranges: 6.7% for AGIs below $25k, 25.6% for AGIs $25k-50k, 63.6% for AGIs $50k-75k, 75.9% for AGIs $75k-100k, 61.9% for AGIs $100k-200k)
Ordinary dividends: $2,067 (reported on 9.7% of returns)
Here:
$2,067
State:
$7,660
(% of AGI for various income ranges: 12.9% for AGIs below $25k, 14.9% for AGIs $25k-50k, 12.8% for AGIs $50k-75k, 33.5% for AGIs $75k-100k, 129.4% for AGIs $100k-200k)
Net capital gain/loss in AGI: +$4,215 (reported on 9.2% of returns)
Here:
+$4,215
State:
+$23,528
(% of AGI for various income ranges: 12.0% for AGIs below $25k, 10.0% for AGIs $25k-50k, 10.0% for AGIs $50k-75k, 121.2% for AGIs $75k-100k, 313.1% for AGIs $100k-200k)
Profit/loss from business: +$8,742 (reported on 17.5% of returns)
Here:
+$8,742
State:
+$9,534
(% of AGI for various income ranges: 220.5% for AGIs below $25k, 144.4% for AGIs $25k-50k, 164.8% for AGIs $50k-75k, 120.6% for AGIs $75k-100k, 526.2% for AGIs $100k-200k)
Taxable individual retirement arrangement distribution: $17,731 (reported on 7.4% of returns)
35619:
$17,731
Alabama:
$19,004
(% of AGI for various income ranges: 44.7% for AGIs below $25k, 122.2% for AGIs $25k-50k, 170.4% for AGIs $50k-75k, 274.1% for AGIs $75k-100k, 718.1% for AGIs $100k-200k)
Total itemized deductions: $27,312 (reported on 3.7% of returns)
Here:
$27,312
State:
$37,338
(% of AGI for various income ranges: 302.0% for AGIs $50k-75k, 893.8% for AGIs $100k-200k)
Charity contributions: $14,643 (reported on 3.2% of returns)
Here:
$14,643
State:
$18,005
(% of AGI for various income ranges: 118.8% for AGIs $50k-75k, 455.0% for AGIs $100k-200k)
Taxes paid: $5,138 (reported on 3.7% of returns)
35619:
$5,138
State:
$6,484
(% of AGI for various income ranges: 40.8% for AGIs $50k-75k, 193.1% for AGIs $100k-200k)
Earned income credit: $2,444 (reported on 20.7% of returns)
Here:
$2,444
State:
$2,628
(% of AGI for various income ranges: 122.2% for AGIs below $25k, 95.1% for AGIs $25k-50k)
Percentage of individuals using paid preparers for their 2020 taxes: 95.4%
Here:
95%
State:
93%
(% for various income ranges: 93.2% for AGIs below $25k, 94.7% for AGIs $25k-50k, 97.0% for AGIs $50k-75k, 95.8% for AGIs $75k-100k, 100.0% for AGIs $100k-200k, 100.0% for AGIs over 200k)
Averages for the 2012 tax year for zip code 35619, filed in 2013:
Average Adjusted Gross Income (AGI) in 2012: $43,820 (Individual Income Tax Returns)
Here:
$43,820
State:
$52,001
Salary/wage: $40,008 (reported on 82.9% of returns)
Here:
$40,008
State:
$43,822
(% of AGI for various income ranges: 72.0% for AGIs below $25k, 78.3% for AGIs $25k-50k, 84.0% for AGIs $50k-75k, 81.1% for AGIs $75k-100k, 64.8% for AGIs $100k-200k)
Taxable interest for individuals: $776 (reported on 26.3% of returns)
This zip code:
$776
Alabama:
$1,592
(% of AGI for various income ranges: 0.8% for AGIs below $25k, 0.6% for AGIs $25k-50k, 0.3% for AGIs $50k-75k, 0.4% for AGIs $75k-100k, 0.4% for AGIs $100k-200k)
Ordinary dividends: $1,581 (reported on 10.2% of returns)
Here:
$1,581
State:
$5,697
(% of AGI for various income ranges: 0.3% for AGIs below $25k, 0.3% for AGIs $25k-50k, 0.1% for AGIs $50k-75k, 0.6% for AGIs $75k-100k, 0.5% for AGIs $100k-200k)
Net capital gain/loss in AGI: +$2,571 (reported on 6.8% of returns)
Here:
+$2,571
State:
+$13,286
(% of AGI for various income ranges: 0.3% for AGIs $75k-100k, 1.2% for AGIs $100k-200k)
Profit/loss from business: +$9,176 (reported on 16.1% of returns)
Here:
+$9,176
State:
+$9,151
(% of AGI for various income ranges: 13.7% for AGIs below $25k, 3.2% for AGIs $25k-50k, 1.7% for AGIs $50k-75k, 1.6% for AGIs $75k-100k, 1.2% for AGIs $100k-200k)
Taxable individual retirement arrangement distribution: $13,388 (reported on 7.8% of returns)
35619:
$13,388
Alabama:
$14,992
(% of AGI for various income ranges: 2.5% for AGIs below $25k, 2.8% for AGIs $25k-50k, 2.5% for AGIs $50k-75k, 5.2% for AGIs $75k-100k)
Total itemized deductions: $17,866 (21% of AGI, reported on 20.0% of returns)
Here:
$17,866
State:
$21,388
Here:
21.3% of AGI
State:
20.1% of AGI
(% of AGI for various income ranges: 5.4% for AGIs below $25k, 8.1% for AGIs $25k-50k, 8.1% for AGIs $50k-75k, 8.0% for AGIs $75k-100k, 9.7% for AGIs $100k-200k)
Charity contributions: $4,974 (reported on 18.5% of returns)
Here:
$4,974
State:
$5,925
(% of AGI for various income ranges: 0.9% for AGIs below $25k, 1.7% for AGIs $25k-50k, 2.0% for AGIs $50k-75k, 2.3% for AGIs $75k-100k, 3.1% for AGIs $100k-200k)
Taxes paid: $3,649 (reported on 20.0% of returns)
35619:
$3,649
State:
$5,272
(% of AGI for various income ranges: 0.6% for AGIs below $25k, 1.1% for AGIs $25k-50k, 1.4% for AGIs $50k-75k, 1.7% for AGIs $75k-100k, 2.9% for AGIs $100k-200k)
Earned income credit: $2,460 (reported on 24.4% of returns)
Here:
$2,460
State:
$2,646
(% of AGI for various income ranges: 8.9% for AGIs below $25k, 1.2% for AGIs $25k-50k)
Percentage of individuals using paid preparers for their 2012 taxes: 73.2%
Here:
73%
State:
60%
(% for various income ranges: 69.8% for AGIs below $25k, 74.1% for AGIs $25k-50k, 75.0% for AGIs $50k-75k, 83.3% for AGIs $75k-100k, 73.3% for AGIs $100k-200k)
Averages for the 2004 tax year for zip code 35619, filed in 2005:
Average Adjusted Gross Income (AGI) in 2004: $34,042 (Individual Income Tax Returns)
Here:
$34,042
State:
$42,302
Salary/wage: $33,747 (reported on 87.9% of returns)
Here:
$33,747
State:
$36,626
(% of AGI for various income ranges: 156.5% for AGIs below $10k, 83.0% for AGIs $10k-25k, 88.3% for AGIs $25k-50k, 90.0% for AGIs $50k-75k, 90.0% for AGIs $75k-100k, 69.0% for AGIs over 100k)
Taxable interest for individuals: $850 (reported on 31.8% of returns)
This zip code:
$850
Alabama:
$1,827
(% of AGI for various income ranges: 5.3% for AGIs below $10k, 1.0% for AGIs $10k-25k, 1.0% for AGIs $25k-50k, 0.5% for AGIs $50k-75k, 0.5% for AGIs $75k-100k, 0.7% for AGIs over 100k)
Taxable dividends: $560 (reported on 11.6% of returns)
Here:
$560
State:
$4,206
(% of AGI for various income ranges: 0.8% for AGIs below $10k, 0.2% for AGIs $10k-25k, 0.2% for AGIs $25k-50k, 0.1% for AGIs $50k-75k, 0.1% for AGIs $75k-100k, 0.2% for AGIs over 100k)
Net capital gain/loss: +$1,923 (reported on 7.9% of returns)
Here:
+$1,923
State:
+$13,031
(% of AGI for various income ranges: 1.0% for AGIs below $10k, 0.5% for AGIs $10k-25k, 0.4% for AGIs $25k-50k, 0.4% for AGIs $50k-75k, 0.4% for AGIs $75k-100k, 0.6% for AGIs over 100k)
Profit/loss from business: +$4,459 (reported on 16.4% of returns)
Here:
+$4,459
State:
+$8,302
(% of AGI for various income ranges: 34.5% for AGIs below $10k, 5.3% for AGIs $10k-25k, 0.9% for AGIs $25k-50k, 2.5% for AGIs $50k-75k, -0.9% for AGIs $75k-100k)
IRA payment deduction: $2,095 (reported on 2.0% of returns)
35619:
$2,095
Alabama:
$3,006
Total itemized deductions: $14,246 (24% of AGI, reported on 22.7% of returns)
Here:
$14,246
State:
$17,623
Here:
24.1% of AGI
State:
20.8% of AGI
(% of AGI for various income ranges: 11.2% for AGIs below $10k, 5.9% for AGIs $10k-25k, 8.2% for AGIs $25k-50k, 9.9% for AGIs $50k-75k, 9.7% for AGIs $75k-100k, 15.8% for AGIs over 100k)
Charity contributions deductions: $2,977 (5% of AGI, reported on 20.2% of returns)
Here:
$2,977
State:
$4,768
Here:
4.9% of AGI
State:
5.4% of AGI
(% of AGI for various income ranges: 1.1% for AGIs $10k-25k, 1.4% for AGIs $25k-50k, 2.2% for AGIs $50k-75k, 2.2% for AGIs $75k-100k, 2.1% for AGIs over 100k)
Total tax: $3,750 (reported on 71.9% of returns)
35619:
$3,750
State:
$6,905
(% of AGI for various income ranges: 6.4% for AGIs below $10k, 3.7% for AGIs $10k-25k, 5.6% for AGIs $25k-50k, 7.8% for AGIs $50k-75k, 10.9% for AGIs $75k-100k, 15.6% for AGIs over 100k)
Earned income credit: $1,832 (reported on 23.9% of returns)
Here:
$1,832
State:
$2,048
Percentage of individuals using paid preparers for their 2004 taxes: 76.0%
Here:
76%
State:
65%
(% for various income ranges: 67.4% for AGIs below $10k, 76.4% for AGIs $10k-25k, 77.3% for AGIs $25k-50k, 82.2% for AGIs $50k-75k, 78.8% for AGIs $75k-100k, 77.6% for AGIs over 100k)
Household received Food Stamps/SNAP in the past 12 months: 240 Household did not receive Food Stamps/SNAP in the past 12 months: 1,614
Women who had a birth in the past 12 months: 106 (114 now married, 4 unmarried) Women who did not have a birth in the past 12 months: 956 (521 now married, 433 unmarried)
Housing units in zip code 35619 with a mortgage: 770 (15 second mortgage, 16 both second mortgage and home equity loan) Houses without a mortgage: 21
Median monthly owner costs for units with a mortgage: $1,037 Median monthly owner costs for units without a mortgage: $369
Residents with income below the poverty level in 2022:
This zip code:
10.4%
Whole state:
16.2%
Residents with income below 50% of the poverty level in 2022:
This zip code:
4.9%
Whole state:
8.6%
Median number of rooms in houses and condos:
Here:
6.3
State:
6.5
Median number of rooms in apartments:
Here:
6.1
State:
4.7
Notable locations in this zip code not listed on our city pages
Notable locations in zip code 35619: Moulton Speedway (A), Alabama Sheriffs Boys Ranch (B), Owl Creek Horse Camp (C), Punkin Center Volunteer Fire Department (D), Danville Volunteer Fire Department Station 1 (E), Neel Volunteer Fire Department (F), Speake Volunteer Fire Department (G), Danville Volunteer Fire Department Station 2 (H). Display/hide their locations on the map
Churches in zip code 35619 include: Danville Baptist Church (A), Danville Church (B), Pumpkin Center Church (C), Piney Grove Church (D), Valley Grove Church (E), Upton Chapel (F), Shady Grove Baptist Church (G), Provident Church (H), Oakville Church (I). Display/hide their locations on the map
Cemeteries: Center Cemetery (1), Johnson Chapel Cemetery (2), Thompson Cemetery (3), Watkins Cemetery (4), Stover Cemetery (5), Stroup Cemetery (6), Stover Cemetery (7). Display/hide their locations on the map
Streams, rivers, and creeks: Mud Tavern Creek (A), Mill Branch (B), Herrin Creek (C), Indian Creek (D), Lee Creek (E), Lindsey Branch (F), McDaniel Creek (G), Orr Creek (H), Owl Creek (I). Display/hide their locations on the map
In group quarters: 12 (-1 institutionalized population)
Size of family households: 688 2-persons, 273 3-persons, 313 4-persons, 84 5-persons, 45 6-persons, 3 7-or-more-persons
Size of nonfamily households: 384 1-person, 54 2-persons
697 married couples with children.
243 single-parent households (71 men, 172 women).
98.5% of residents of 35619 zip code speak English at home.
0.9% of residents speak Spanish at home (83% very well, 7% well, 10% not well).
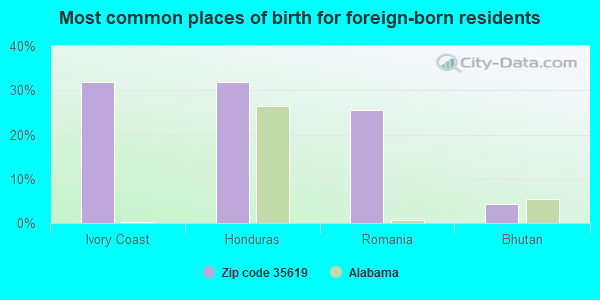
Foreign born population: 50 (1.1%) (76.4% of them are naturalized citizens)
This zip code:
1.1%
Whole state:
3.8%
32%Ivory Coast
32%Honduras
26%Romania
4%Bhutan
30%American
25%English
9%Irish
4%German
4%Scottish
1%Russian
1%Scandinavian
Year of entry for the foreign-born population
162010 or later
292000 to 2009
121990 to 1999
4Before 1990
Facilities with environmental interests located in this zip code:
ADOT MGF ACNHF 0157 500 (ALABAMA DEPARTMENT OF TRANSPOR in DANVILLE, AL)
National Pollutant Discharge Elimination System NON-MAJOR (Tracking pollutant discharge elimination systems) - permit Business SIC classification: HIGHWAY AND STREET CONSTRUCTION, EXCEPT ELEVATED HIGHWAYS
Housing units lacking complete plumbing facilities: 5.3% Housing units lacking complete kitchen facilities: 5.0%
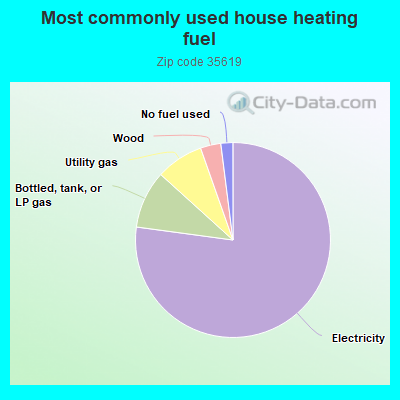
77.3%Electricity
9.6%Bottled, tank, or LP gas
7.9%Utility gas
3.4%Wood
2.0%No fuel used
Population in 1990: 4,614. Population change in the 1990s: +481 (+10.4%).
Place of birth for U.S.-born residents:
This state: 3,464
Northeast: 38
Midwest: 263
South: 867
West: 71
67% of the 35619 zip code residents lived in the same house 5 years ago. Out of people who lived in different houses, 68% lived in this county. Out of people who lived in different counties, 50% lived in Alabama.
91% of the 35619 zip code residents lived in the same house 1 year ago. Out of people who lived in different houses, 39% moved from this county. Out of people who lived in different houses, 27% moved from different county within same state. Out of people who lived in different houses, 38% moved from different state.
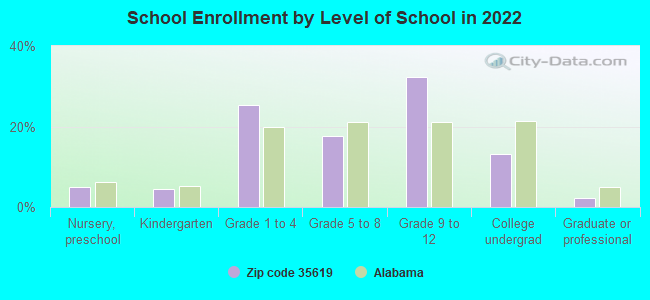
Private vs. public school enrollment:
Students in private schools in grades 1 to 8 (elementary and middle school): 7
Here:
1.8%
Alabama:
14.7%
Students in private schools in grades 9 to 12 (high school): 64
Here:
19.2%
Alabama:
16.3%
Students in private undergraduate colleges: 8
Here:
6.2%
Alabama:
14.6%
Occupation by median earnings in the past 12 months ($)
90,069Transportation occupations
74,948Business and financial operations occupations
67,955Management occupations
58,250Health technologists and technicians
57,497Health diagnosing and treating practitioners and other technical occupations
56,384Building and grounds cleaning and maintenance occupations
Top industries in this zip code by the number of employees in 2005:
Other Services (except Public Administration): Religious Organizations (20-49 employees: 1 establishment, 1-4 employees: 3 establishments)
Health Care and Social Assistance: Other Residential Care Facilities (10-19: 1)
Accommodation and Food Services: Full-Service Restaurants (10-19: 1)
Health Care and Social Assistance: Offices of Physical, Occupational and Speech Therapists, and Audiologists (10-19: 1)
Wholesale Trade: Sporting and Recreational Goods and Supplies Merchant Wholesalers (5-9: 1)
People in group quarters in 2010:
24 people in group homes for juveniles (non-correctional)
2 people in workers' group living quarters and job corps centers
People in group quarters in 2000:
11 people in other noninstitutional group quarters
Fatal accident statistics in 2014:
Fatal accident count: 2
Vehicles involved in fatal accidents: 2
Fatal accidents caused by drunken drivers: 1
Fatalities: 2
Persons involved in fatal accidents: 2
Pedestrians involved in fatal accidents: 1
Fatal accident statistics in 2013:
Fatal accident count: 1
Vehicles involved in fatal accidents: 2
Fatal accidents caused by drunken drivers: 0
Fatalities: 1
Persons involved in fatal accidents: 3
Pedestrians involved in fatal accidents: 0
Home Mortgage Disclosure Act Aggregated Statistics For Year 2009 (Based on 1 full and 2 partial tracts)
A) FHA, FSA/RHS & VA Home Purchase Loans
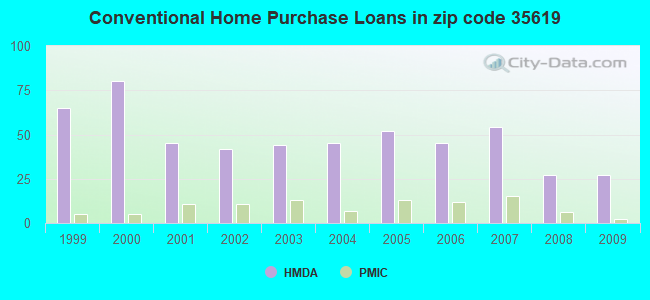
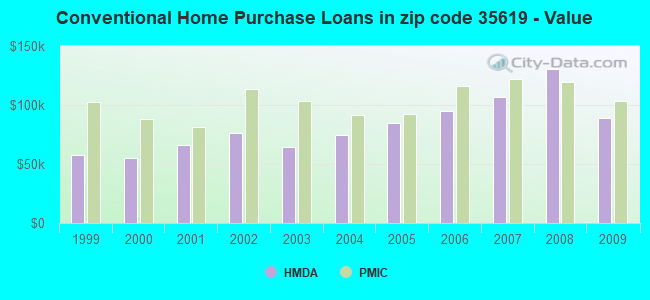
B) Conventional Home Purchase Loans
C) Refinancings
D) Home Improvement Loans
F) Non-occupant Loans on < 5 Family Dwellings (A B C & D)
G) Loans On Manufactured Home Dwelling (A B C & D)
Number
Average Value
Number
Average Value
Number
Average Value
Number
Average Value
Number
Average Value
Number
Average Value
LOANS ORIGINATED
11
$129,750
27
$89,339
85
$124,993
9
$31,621
7
$52,026
18
$29,500
APPLICATIONS APPROVED, NOT ACCEPTED
1
$74,680
5
$62,048
8
$78,552
1
$122,910
0
$0
5
$32,710
APPLICATIONS DENIED
4
$112,192
17
$51,029
36
$101,766
8
$51,612
2
$147,560
21
$50,892
APPLICATIONS WITHDRAWN
1
$112,590
1
$111,530
29
$134,644
2
$104,695
0
$0
0
$0
FILES CLOSED FOR INCOMPLETENESS
1
$121,760
1
$49,980
9
$160,760
2
$54,435
0
$0
1
$28,440
Aggregated Statistics For Year 2008 (Based on 1 full and 2 partial tracts)
A) FHA, FSA/RHS & VA Home Purchase Loans
B) Conventional Home Purchase Loans
C) Refinancings
D) Home Improvement Loans
E) Loans on Dwellings For 5+ Families
F) Non-occupant Loans on < 5 Family Dwellings (A B C & D)
G) Loans On Manufactured Home Dwelling (A B C & D)
Number
Average Value
Number
Average Value
Number
Average Value
Number
Average Value
Number
Average Value
Number
Average Value
Number
Average Value
LOANS ORIGINATED
14
$136,954
27
$130,600
72
$133,281
20
$24,577
0
$0
2
$99,055
15
$42,168
APPLICATIONS APPROVED, NOT ACCEPTED
0
$0
3
$56,093
8
$95,871
1
$9,810
0
$0
1
$83,010
1
$54,230
APPLICATIONS DENIED
3
$97,587
13
$69,687
43
$107,721
12
$59,712
1
$75,590
3
$89,670
10
$41,597
APPLICATIONS WITHDRAWN
2
$128,650
3
$84,983
15
$129,233
0
$0
0
$0
2
$73,560
0
$0
FILES CLOSED FOR INCOMPLETENESS
1
$90,410
2
$84,140
6
$102,875
0
$0
0
$0
0
$0
3
$46,873
Aggregated Statistics For Year 2007 (Based on 1 full and 2 partial tracts)
A) FHA, FSA/RHS & VA Home Purchase Loans
B) Conventional Home Purchase Loans
C) Refinancings
D) Home Improvement Loans
F) Non-occupant Loans on < 5 Family Dwellings (A B C & D)
G) Loans On Manufactured Home Dwelling (A B C & D)
Number
Average Value
Number
Average Value
Number
Average Value
Number
Average Value
Number
Average Value
Number
Average Value
LOANS ORIGINATED
14
$124,257
54
$107,137
71
$103,859
18
$20,572
7
$107,317
22
$30,857
APPLICATIONS APPROVED, NOT ACCEPTED
0
$0
9
$61,078
7
$82,307
2
$15,290
1
$27,980
5
$50,064
APPLICATIONS DENIED
0
$0
11
$43,613
41
$97,439
20
$51,587
2
$72,265
12
$42,808
APPLICATIONS WITHDRAWN
1
$84,330
5
$114,198
17
$105,349
2
$136,400
0
$0
1
$65,370
FILES CLOSED FOR INCOMPLETENESS
1
$71,360
1
$162,900
10
$127,458
1
$77,570
1
$183,630
1
$16,400
Aggregated Statistics For Year 2006 (Based on 1 full and 2 partial tracts)
A) FHA, FSA/RHS & VA Home Purchase Loans
B) Conventional Home Purchase Loans
C) Refinancings
D) Home Improvement Loans
F) Non-occupant Loans on < 5 Family Dwellings (A B C & D)
G) Loans On Manufactured Home Dwelling (A B C & D)
Number
Average Value
Number
Average Value
Number
Average Value
Number
Average Value
Number
Average Value
Number
Average Value
LOANS ORIGINATED
5
$94,708
45
$94,558
80
$90,886
21
$30,289
12
$78,096
17
$53,851
APPLICATIONS APPROVED, NOT ACCEPTED
0
$0
13
$73,336
15
$90,795
1
$13,270
0
$0
8
$51,952
APPLICATIONS DENIED
0
$0
22
$59,844
62
$101,226
13
$42,457
1
$10,750
17
$40,024
APPLICATIONS WITHDRAWN
0
$0
10
$81,131
30
$103,084
5
$101,090
0
$0
1
$42,970
FILES CLOSED FOR INCOMPLETENESS
0
$0
3
$52,430
13
$115,783
1
$126,060
0
$0
0
$0
Aggregated Statistics For Year 2005 (Based on 1 full and 2 partial tracts)
A) FHA, FSA/RHS & VA Home Purchase Loans
B) Conventional Home Purchase Loans
C) Refinancings
D) Home Improvement Loans
F) Non-occupant Loans on < 5 Family Dwellings (A B C & D)
G) Loans On Manufactured Home Dwelling (A B C & D)
Number
Average Value
Number
Average Value
Number
Average Value
Number
Average Value
Number
Average Value
Number
Average Value
LOANS ORIGINATED
11
$85,479
52
$84,580
81
$88,821
14
$26,092
13
$61,189
21
$39,812
APPLICATIONS APPROVED, NOT ACCEPTED
1
$57,380
22
$63,293
20
$98,732
2
$27,305
2
$46,135
9
$48,244
APPLICATIONS DENIED
2
$51,020
23
$45,518
71
$82,464
16
$30,929
3
$36,263
20
$39,834
APPLICATIONS WITHDRAWN
0
$0
9
$87,834
35
$93,535
3
$126,283
2
$158,845
3
$67,243
FILES CLOSED FOR INCOMPLETENESS
0
$0
1
$22,500
24
$101,402
1
$113,320
0
$0
0
$0
Aggregated Statistics For Year 2004 (Based on 1 full and 2 partial tracts)
A) FHA, FSA/RHS & VA Home Purchase Loans
B) Conventional Home Purchase Loans
C) Refinancings
D) Home Improvement Loans
F) Non-occupant Loans on < 5 Family Dwellings (A B C & D)
G) Loans On Manufactured Home Dwelling (A B C & D)
Number
Average Value
Number
Average Value
Number
Average Value
Number
Average Value
Number
Average Value
Number
Average Value
LOANS ORIGINATED
15
$74,794
45
$74,796
94
$92,846
15
$24,756
10
$47,147
23
$35,262
APPLICATIONS APPROVED, NOT ACCEPTED
2
$24,900
12
$66,824
19
$85,942
3
$34,107
1
$53,390
6
$38,720
APPLICATIONS DENIED
1
$59,880
25
$60,361
64
$87,327
9
$31,321
3
$56,153
22
$37,995
APPLICATIONS WITHDRAWN
3
$102,357
4
$93,010
20
$93,514
5
$22,668
0
$0
2
$49,690
FILES CLOSED FOR INCOMPLETENESS
1
$134,230
2
$65,470
27
$98,473
0
$0
1
$110,780
2
$49,175
Aggregated Statistics For Year 2003 (Based on 1 full and 2 partial tracts)
A) FHA, FSA/RHS & VA Home Purchase Loans
B) Conventional Home Purchase Loans
C) Refinancings
D) Home Improvement Loans
F) Non-occupant Loans on < 5 Family Dwellings (A B C & D)
Number
Average Value
Number
Average Value
Number
Average Value
Number
Average Value
Number
Average Value
LOANS ORIGINATED
12
$79,296
44
$64,617
156
$87,497
11
$18,818
10
$36,273
APPLICATIONS APPROVED, NOT ACCEPTED
1
$93,810
7
$29,673
25
$112,766
0
$0
1
$70,360
APPLICATIONS DENIED
2
$70,600
28
$38,369
79
$88,289
10
$45,358
2
$38,290
APPLICATIONS WITHDRAWN
1
$83,830
3
$84,347
48
$95,362
0
$0
1
$117,800
FILES CLOSED FOR INCOMPLETENESS
0
$0
1
$34,330
14
$79,486
1
$66,690
0
$0
Aggregated Statistics For Year 2002 (Based on 1 full and 2 partial tracts)
A) FHA, FSA/RHS & VA Home Purchase Loans
B) Conventional Home Purchase Loans
C) Refinancings
D) Home Improvement Loans
F) Non-occupant Loans on < 5 Family Dwellings (A B C & D)
Number
Average Value
Number
Average Value
Number
Average Value
Number
Average Value
Number
Average Value
LOANS ORIGINATED
8
$85,016
42
$76,327
124
$85,032
7
$18,259
3
$136,213
APPLICATIONS APPROVED, NOT ACCEPTED
1
$101,970
16
$39,551
13
$62,243
1
$19,290
1
$64,180
APPLICATIONS DENIED
0
$0
31
$47,085
57
$83,036
7
$30,304
1
$4,440
APPLICATIONS WITHDRAWN
0
$0
8
$116,478
18
$69,878
1
$83,730
2
$38,740
FILES CLOSED FOR INCOMPLETENESS
1
$75,520
4
$69,755
12
$64,602
0
$0
0
$0
Aggregated Statistics For Year 2001 (Based on 1 full and 2 partial tracts)
A) FHA, FSA/RHS & VA Home Purchase Loans
B) Conventional Home Purchase Loans
C) Refinancings
D) Home Improvement Loans
F) Non-occupant Loans on < 5 Family Dwellings (A B C & D)
Number
Average Value
Number
Average Value
Number
Average Value
Number
Average Value
Number
Average Value
LOANS ORIGINATED
15
$74,291
45
$66,358
129
$79,943
17
$16,494
7
$56,600
APPLICATIONS APPROVED, NOT ACCEPTED
0
$0
18
$29,149
10
$47,995
1
$15,470
0
$0
APPLICATIONS DENIED
2
$71,730
48
$36,230
52
$64,700
6
$16,583
4
$31,018
APPLICATIONS WITHDRAWN
0
$0
2
$53,890
20
$68,415
2
$26,460
0
$0
FILES CLOSED FOR INCOMPLETENESS
0
$0
1
$71,170
8
$71,526
0
$0
0
$0
Aggregated Statistics For Year 2000 (Based on 1 full and 2 partial tracts)
A) FHA, FSA/RHS & VA Home Purchase Loans
B) Conventional Home Purchase Loans
C) Refinancings
D) Home Improvement Loans
F) Non-occupant Loans on < 5 Family Dwellings (A B C & D)
Number
Average Value
Number
Average Value
Number
Average Value
Number
Average Value
Number
Average Value
LOANS ORIGINATED
13
$64,728
80
$54,996
57
$69,441
21
$18,683
11
$36,985
APPLICATIONS APPROVED, NOT ACCEPTED
2
$57,375
18
$40,308
3
$51,397
2
$16,190
2
$37,195
APPLICATIONS DENIED
1
$60,780
85
$33,391
25
$52,692
8
$9,908
2
$17,260
APPLICATIONS WITHDRAWN
1
$108,090
3
$74,507
11
$51,628
0
$0
0
$0
FILES CLOSED FOR INCOMPLETENESS
0
$0
0
$0
8
$68,176
0
$0
0
$0
Aggregated Statistics For Year 1999 (Based on 1 full and 2 partial tracts)
A) FHA, FSA/RHS & VA Home Purchase Loans
B) Conventional Home Purchase Loans
C) Refinancings
D) Home Improvement Loans
F) Non-occupant Loans on < 5 Family Dwellings (A B C & D)

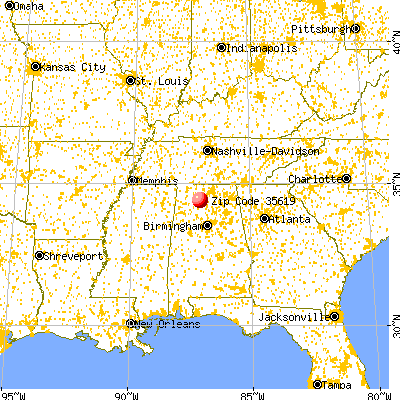


 Nearest zip codes: 35540, 35650, 35673, 35179, 35640, 35572.