Estimated zip code population in 2022: 5,436 Zip code population in 2010: 6,445 Zip code population in 2000: 6,568
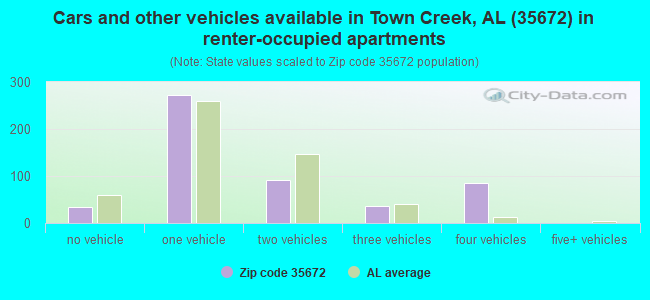
Houses and condos: 2,757 Renter-occupied apartments: 510
% of renters here:
23%
State:
30%
March 2022 cost of living index in zip code 35672: 80.4 (low, U.S. average is 100)
Land area: 132.2 sq. mi. Water area: 7.8 sq. mi.
Population density: 41 people per square mile
(very low).
OSM Map
General Map
Google Map
MSN Map
OSM Map
General Map
Google Map
MSN Map
OSM Map
General Map
Google Map
MSN Map
OSM Map
General Map
Google Map
MSN Map
Please wait while loading the map...
Real estate property taxes paid for housing units in 2022:
This zip code:
0.3% ($377)
Alabama:
0.4% ($718)
Median real estate property taxes paid for housing units with mortgages in 2022: $388 (0.3%) Median real estate property taxes paid for housing units with no mortgage in 2022: $360 (0.3%)
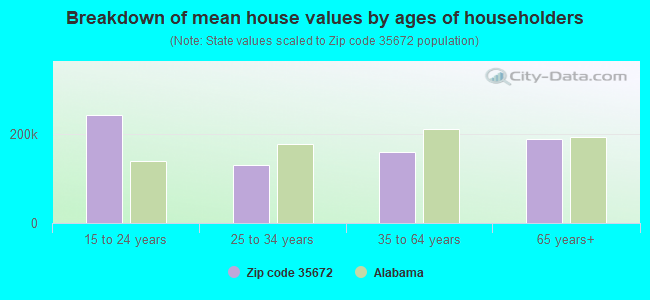
Estimated median house/condo value in 2022: $135,949
35672:
$135,949
Alabama:
$200,900
According to our research of Alabama and other state lists, there were 13 registered sex offenders living in 35672 zip code as of May 28, 2024. The ratio of all residents to sex offenders in zip code 35672 is 472 to 1. The ratio of registered sex offenders to all residents in this zip code is near the state average.
Median resident age:
This zip code:
39.4 years
Alabama median age:
39.6 years
Average household size:
This zip code:
2.4 people
Alabama:
2.5 people
Averages for the 2020 tax year for zip code 35672, filed in 2021:
Average Adjusted Gross Income (AGI) in 2020: $51,678 (Individual Income Tax Returns)
Here:
$51,678
State:
$63,984
Salary/wage: $50,174 (reported on 81.1% of returns)
Here:
$50,174
State:
$52,834
(% of AGI for various income ranges: 1098.4% for AGIs below $25k, 3754.2% for AGIs $25k-50k, 7016.8% for AGIs $50k-75k, 10001.7% for AGIs $75k-100k, 16033.6% for AGIs $100k-200k)
Taxable interest for individuals: $677 (reported on 27.2% of returns)
This zip code:
$677
Alabama:
$1,615
(% of AGI for various income ranges: 15.3% for AGIs below $25k, 17.7% for AGIs $25k-50k, 43.2% for AGIs $50k-75k, 33.9% for AGIs $75k-100k, 44.1% for AGIs $100k-200k)
Ordinary dividends: $1,741 (reported on 8.7% of returns)
Here:
$1,741
State:
$7,660
(% of AGI for various income ranges: 7.4% for AGIs below $25k, 8.5% for AGIs $25k-50k, 8.8% for AGIs $50k-75k, 19.4% for AGIs $75k-100k, 104.1% for AGIs $100k-200k)
Net capital gain/loss in AGI: +$5,058 (reported on 7.5% of returns)
Here:
+$5,058
State:
+$23,528
(% of AGI for various income ranges: 3.7% for AGIs below $25k, 13.0% for AGIs $25k-50k, 18.0% for AGIs $50k-75k, 28.3% for AGIs $75k-100k, 350.0% for AGIs $100k-200k)
Profit/loss from business: +$2,613 (reported on 15.0% of returns)
Here:
+$2,613
State:
+$9,534
(% of AGI for various income ranges: 154.4% for AGIs below $25k, 9.4% for AGIs $25k-50k, 29.1% for AGIs $100k-200k)
Taxable individual retirement arrangement distribution: $15,389 (reported on 7.1% of returns)
35672:
$15,389
Alabama:
$19,004
(% of AGI for various income ranges: 57.1% for AGIs below $25k, 90.9% for AGIs $25k-50k, 183.2% for AGIs $50k-75k, 341.7% for AGIs $75k-100k, 370.5% for AGIs $100k-200k)
Total itemized deductions: $22,550 (reported on 3.1% of returns)
Here:
$22,550
State:
$37,338
(% of AGI for various income ranges: 145.1% for AGIs $25k-50k, 470.5% for AGIs $100k-200k)
Charity contributions: $8,386 (reported on 2.8% of returns)
Here:
$8,386
State:
$18,005
(% of AGI for various income ranges: 33.2% for AGIs $25k-50k, 186.8% for AGIs $100k-200k)
Taxes paid: $4,538 (reported on 3.1% of returns)
35672:
$4,538
State:
$6,484
(% of AGI for various income ranges: 20.0% for AGIs $25k-50k, 116.8% for AGIs $100k-200k)
Earned income credit: $2,624 (reported on 21.7% of returns)
Here:
$2,624
State:
$2,628
(% of AGI for various income ranges: 133.9% for AGIs below $25k, 95.5% for AGIs $25k-50k)
Percentage of individuals using paid preparers for their 2020 taxes: 95.3%
Here:
95%
State:
93%
(% for various income ranges: 94.5% for AGIs below $25k, 94.1% for AGIs $25k-50k, 97.1% for AGIs $50k-75k, 96.0% for AGIs $75k-100k, 97.0% for AGIs $100k-200k, 100.0% for AGIs over 200k)
Averages for the 2012 tax year for zip code 35672, filed in 2013:
Average Adjusted Gross Income (AGI) in 2012: $43,225 (Individual Income Tax Returns)
Here:
$43,225
State:
$52,001
Salary/wage: $40,438 (reported on 84.7% of returns)
Here:
$40,438
State:
$43,822
(% of AGI for various income ranges: 74.6% for AGIs below $25k, 83.6% for AGIs $25k-50k, 82.9% for AGIs $50k-75k, 85.0% for AGIs $75k-100k, 71.8% for AGIs $100k-200k)
Taxable interest for individuals: $799 (reported on 28.6% of returns)
This zip code:
$799
Alabama:
$1,592
(% of AGI for various income ranges: 0.8% for AGIs below $25k, 0.6% for AGIs $25k-50k, 0.8% for AGIs $50k-75k, 0.4% for AGIs $75k-100k, 0.3% for AGIs $100k-200k)
Ordinary dividends: $918 (reported on 8.6% of returns)
Here:
$918
State:
$5,697
(% of AGI for various income ranges: 0.2% for AGIs below $25k, 0.2% for AGIs $50k-75k, 0.3% for AGIs $75k-100k, 0.2% for AGIs $100k-200k)
Net capital gain/loss in AGI: +$4,507 (reported on 5.9% of returns)
Here:
+$4,507
State:
+$13,286
(% of AGI for various income ranges: 0.2% for AGIs below $25k, 0.2% for AGIs $25k-50k, 0.4% for AGIs $50k-75k, 0.1% for AGIs $75k-100k, 1.5% for AGIs $100k-200k)
Profit/loss from business: +$3,879 (reported on 14.9% of returns)
Here:
+$3,879
State:
+$9,151
(% of AGI for various income ranges: 7.9% for AGIs below $25k, 0.4% for AGIs $25k-50k, 0.6% for AGIs $50k-75k, 0.3% for AGIs $75k-100k, 0.3% for AGIs $100k-200k)
Taxable individual retirement arrangement distribution: $11,767 (reported on 7.1% of returns)
35672:
$11,767
Alabama:
$14,992
(% of AGI for various income ranges: 1.8% for AGIs below $25k, 1.8% for AGIs $25k-50k, 2.8% for AGIs $50k-75k, 4.2% for AGIs $75k-100k)
Total itemized deductions: $17,690 (23% of AGI, reported on 23.1% of returns)
Here:
$17,690
State:
$21,388
Here:
22.9% of AGI
State:
20.1% of AGI
(% of AGI for various income ranges: 7.2% for AGIs below $25k, 9.9% for AGIs $25k-50k, 10.0% for AGIs $50k-75k, 9.1% for AGIs $75k-100k, 10.1% for AGIs $100k-200k)
Charity contributions: $4,878 (reported on 19.6% of returns)
Here:
$4,878
State:
$5,925
(% of AGI for various income ranges: 1.1% for AGIs below $25k, 1.8% for AGIs $25k-50k, 2.0% for AGIs $50k-75k, 2.3% for AGIs $75k-100k, 3.2% for AGIs $100k-200k)
Taxes paid: $3,477 (reported on 23.5% of returns)
35672:
$3,477
State:
$5,272
(% of AGI for various income ranges: 0.6% for AGIs below $25k, 1.2% for AGIs $25k-50k, 1.8% for AGIs $50k-75k, 1.9% for AGIs $75k-100k, 3.1% for AGIs $100k-200k)
Earned income credit: $2,454 (reported on 27.1% of returns)
Here:
$2,454
State:
$2,646
(% of AGI for various income ranges: 9.5% for AGIs below $25k, 1.5% for AGIs $25k-50k)
Percentage of individuals using paid preparers for their 2012 taxes: 78.4%
Here:
78%
State:
60%
(% for various income ranges: 76.9% for AGIs below $25k, 80.3% for AGIs $25k-50k, 77.1% for AGIs $50k-75k, 79.2% for AGIs $75k-100k, 81.8% for AGIs $100k-200k)
Averages for the 2004 tax year for zip code 35672, filed in 2005:
Average Adjusted Gross Income (AGI) in 2004: $33,403 (Individual Income Tax Returns)
Here:
$33,403
State:
$42,302
Salary/wage: $33,765 (reported on 86.0% of returns)
Here:
$33,765
State:
$36,626
(% of AGI for various income ranges: 84.8% for AGIs below $10k, 80.7% for AGIs $10k-25k, 89.7% for AGIs $25k-50k, 89.2% for AGIs $50k-75k, 88.2% for AGIs $75k-100k, 83.9% for AGIs over 100k)
Taxable interest for individuals: $987 (reported on 38.2% of returns)
This zip code:
$987
Alabama:
$1,827
(% of AGI for various income ranges: 4.2% for AGIs below $10k, 1.3% for AGIs $10k-25k, 0.9% for AGIs $25k-50k, 1.3% for AGIs $50k-75k, 0.9% for AGIs $75k-100k, 0.5% for AGIs over 100k)
Taxable dividends: $843 (reported on 11.3% of returns)
Here:
$843
State:
$4,206
(% of AGI for various income ranges: 1.3% for AGIs below $10k, 0.1% for AGIs $10k-25k, 0.1% for AGIs $25k-50k, 0.1% for AGIs $50k-75k, 0.2% for AGIs $75k-100k, 1.2% for AGIs over 100k)
Net capital gain/loss: +$86 (reported on 6.5% of returns)
Here:
+$86
State:
+$13,031
(% of AGI for various income ranges: -0.6% for AGIs below $10k, -0.2% for AGIs $10k-25k, 0.1% for AGIs $25k-50k, 0.2% for AGIs $50k-75k, -0.1% for AGIs $75k-100k, 0.1% for AGIs over 100k)
Profit/loss from business: +$1,187 (reported on 13.7% of returns)
Here:
+$1,187
State:
+$8,302
(% of AGI for various income ranges: 10.8% for AGIs below $10k, 4.3% for AGIs $10k-25k, -1.3% for AGIs $25k-50k, -0.6% for AGIs $50k-75k, -0.1% for AGIs $75k-100k)
IRA payment deduction: $2,824 (reported on 1.3% of returns)
35672:
$2,824
Alabama:
$3,006
Total itemized deductions: $14,225 (24% of AGI, reported on 21.9% of returns)
Here:
$14,225
State:
$17,623
Here:
24.2% of AGI
State:
20.8% of AGI
(% of AGI for various income ranges: 7.5% for AGIs below $10k, 6.0% for AGIs $10k-25k, 9.3% for AGIs $25k-50k, 9.2% for AGIs $50k-75k, 10.3% for AGIs $75k-100k, 12.8% for AGIs over 100k)
Charity contributions deductions: $3,736 (6% of AGI, reported on 19.4% of returns)
Here:
$3,736
State:
$4,768
Here:
6.1% of AGI
State:
5.4% of AGI
(% of AGI for various income ranges: 0.9% for AGIs $10k-25k, 1.6% for AGIs $25k-50k, 2.3% for AGIs $50k-75k, 3.1% for AGIs $75k-100k, 3.8% for AGIs over 100k)
Total tax: $3,828 (reported on 69.0% of returns)
35672:
$3,828
State:
$6,905
(% of AGI for various income ranges: 3.2% for AGIs below $10k, 3.3% for AGIs $10k-25k, 5.7% for AGIs $25k-50k, 8.5% for AGIs $50k-75k, 10.8% for AGIs $75k-100k, 14.2% for AGIs over 100k)
Earned income credit: $2,017 (reported on 24.9% of returns)
Here:
$2,017
State:
$2,048
Percentage of individuals using paid preparers for their 2004 taxes: 78.4%
Here:
78%
State:
65%
(% for various income ranges: 68.5% for AGIs below $10k, 82.4% for AGIs $10k-25k, 78.4% for AGIs $25k-50k, 80.6% for AGIs $50k-75k, 81.5% for AGIs $75k-100k, 82.2% for AGIs over 100k)
Household received Food Stamps/SNAP in the past 12 months: 389 Household did not receive Food Stamps/SNAP in the past 12 months: 1,853
Women who had a birth in the past 12 months: 86 (98 now married, 0 unmarried) Women who did not have a birth in the past 12 months: 1,024 (439 now married, 585 unmarried)
Housing units in zip code 35672 with a mortgage: 824 (50 second mortgage, 2 home equity loan, 44 both second mortgage and home equity loan) Houses without a mortgage: 5
Median monthly owner costs for units with a mortgage: $1,038 Median monthly owner costs for units without a mortgage: $383
Residents with income below the poverty level in 2022:
This zip code:
17.7%
Whole state:
16.2%
Residents with income below 50% of the poverty level in 2022:
This zip code:
11.8%
Whole state:
8.6%
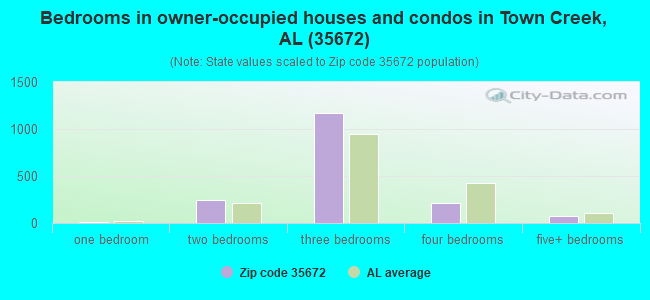
Median number of rooms in houses and condos:
Here:
6.4
State:
6.5
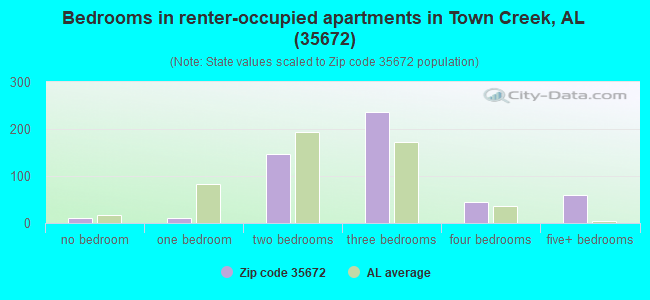
Median number of rooms in apartments:
Here:
5.4
State:
4.7
Notable locations in this zip code not listed on our city pages
Notable locations in zip code 35672: Sherrod Quarters (A), Wheeler Dam Subdivision (B), Lawrence County Associaton Church Camp (C), Wheeler Dam Subdivision (D), Beavers Cross (E), Jones Hunting and Fishing Club (F), Flat Rock Community Center (G), Town Creek Volunteer Fire Department (H), Hatton Volunteer Fire Department (I), Red Bank Fire Department (J). Display/hide their locations on the map
Churches in zip code 35672 include: Providence Baptist Church (A), Okolona Baptist Church (B), Mount Zion Missionary Baptist Church (C), Mount Zion Church (D), Wolfe Spring Church (E), Mount Zion Church (F), Hatton Church of Christ (G), Friendship Church (H), First Baptist Church (I). Display/hide their locations on the map
Cemeteries: String Cemetery (1), Conner Cemetery (2), Midway Cemetery (3), Houston Cemetery (4), Davenport Cemetery (5), Rocky Hill Cemetery (6), Dobbins Cemetery (7). Display/hide their locations on the map
Lakes, reservoirs, and swamps: Pooles Pond (A), Stovall Pond (B), Rock Pond (C), Boatwright Slough (D), Taylors Pond (E), Knoff Lake (F), Rocky Hill Pond (G), Tupelo Bottoms (H). Display/hide their locations on the map
Streams, rivers, and creeks: Shaw Branch (A), Parker Branch (B), Oliver Creek (C), Midway Branch (D), Meadow Branch (E), Watches Creek (F), Wolf Creek (G), Hogwood Branch (H), Goode Branch (I). Display/hide their locations on the map
Size of family households: 800 2-persons, 182 3-persons, 354 4-persons, 77 5-persons, 45 6-persons
Size of nonfamily households: 724 1-person, 36 2-persons
863 married couples with children.
241 single-parent households (41 men, 200 women).
98.6% of residents of 35672 zip code speak English at home.
0.4% of residents speak Spanish at home (100% well).
0.7% of residents speak Asian or Pacific Island language at home (100% very well).
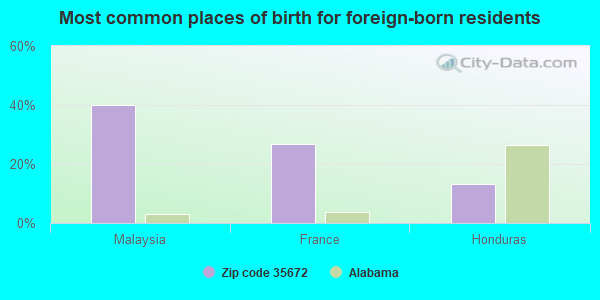
Foreign born population: 16 (0.3%) (33.1% of them are naturalized citizens)
This zip code:
0.3%
Whole state:
3.8%
40%Malaysia
27%France
13%Honduras
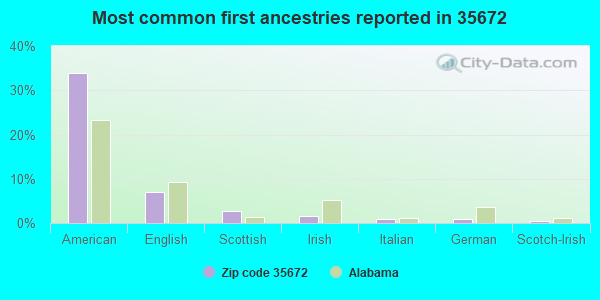
34%American
7%English
3%Scottish
2%Irish
1%Italian
1%German
0%Scotch-Irish
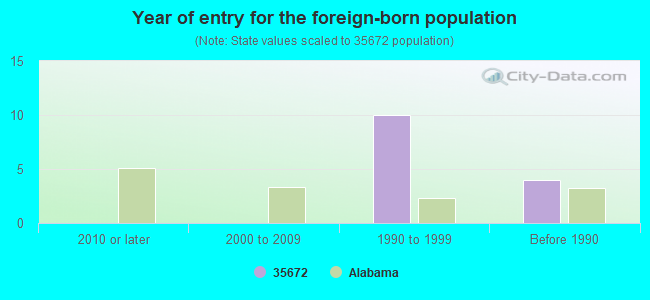
Year of entry for the foreign-born population
02010 or later
02000 to 2009
101990 to 1999
4Before 1990
Facilities with environmental interests located in this zip code:
ALABAMA STATE HWY 157 R.O.W. (AL HWY 157 AND AL HWY 101 INT in TOWN CREEK, AL)
(Resource Conservation and Recovery Act (tracking hazardous waste)) Organizations: STATE OF ALABAMA (CONTACT/OPERATOR)
, ALA DEPT OF TRANSPORTATION (CONTACT/OWNER)
RUTHERFORD RODRICK FARM (RODRICK RUTHERFORD in TOWN CREEK, AL)
National Pollutant Discharge Elimination System NON-MAJOR (Tracking pollutant discharge elimination systems) - permit Business SIC classification: NONCLASSIFIABLE ESTABLISHMENTS Alternative names: RODRICK RUTHERFORD FARM, RUTHERFORD FM POULTRY BROILER
K AND L FARM (KEITH AND LYNN THRASHER in TOWN CREEK, AL)
National Pollutant Discharge Elimination System NON-MAJOR (Tracking pollutant discharge elimination systems) - permit Business SIC classification: NONCLASSIFIABLE ESTABLISHMENTS
LOVELADY FARM (CHAD AND NIKILOVELADY in TOWN CREEK, AL)
National Pollutant Discharge Elimination System NON-MAJOR (Tracking pollutant discharge elimination systems) - permit Business SIC classification: NONCLASSIFIABLE ESTABLISHMENTS
ALLEN'S CLEANERS (16034 MAIN STREET in TOWN CREEK, AL)
(Resource Conservation and Recovery Act (tracking hazardous waste))
ADOT BRF 0398 052 (ALABAMA DEPARTMENT OF TRANSPOR in TOWN CREEK, AL)
National Pollutant Discharge Elimination System NON-MAJOR (Tracking pollutant discharge elimination systems) - permit Business SIC classification: HIGHWAY AND STREET CONSTRUCTION, EXCEPT ELEVATED HIGHWAYS
ALABAMA PALLET COMPANY (135 WATER STREET in TOWN CREEK, AL)
AIR MINOR (AIRS/AFS) Business SIC classification: WOOD PALLETS AND SKIDS Alternative names: ALABAMA PALLETT CO INC
Housing units lacking complete plumbing facilities: 10.1% Housing units lacking complete kitchen facilities: 7.4%
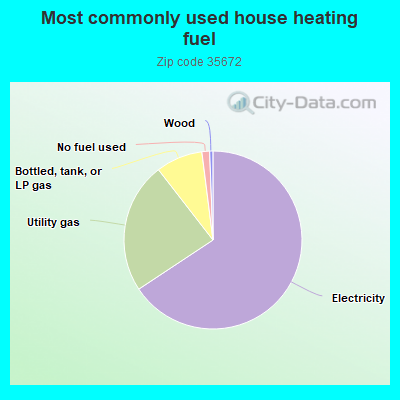
65.7%Electricity
23.8%Utility gas
8.5%Bottled, tank, or LP gas
1.4%No fuel used
0.6%Wood
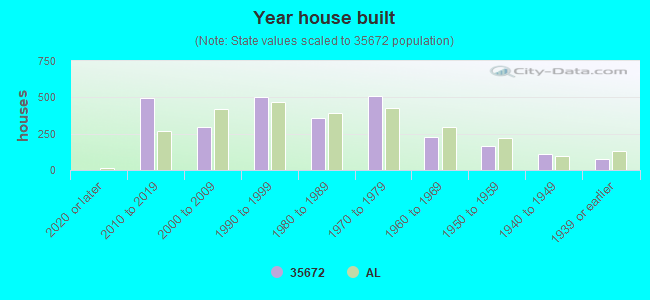
Population in 1990: 9,049.
Place of birth for U.S.-born residents:
This state: 4,844
Northeast: 20
Midwest: 148
South: 307
West: 42
74% of the 35672 zip code residents lived in the same house 5 years ago. Out of people who lived in different houses, 69% lived in this county. Out of people who lived in different counties, 50% lived in Alabama.
95% of the 35672 zip code residents lived in the same house 1 year ago. Out of people who lived in different houses, 9% moved from this county. Out of people who lived in different houses, 41% moved from different county within same state. Out of people who lived in different houses, 47% moved from different state. Out of people who lived in different houses, 16% moved from abroad.
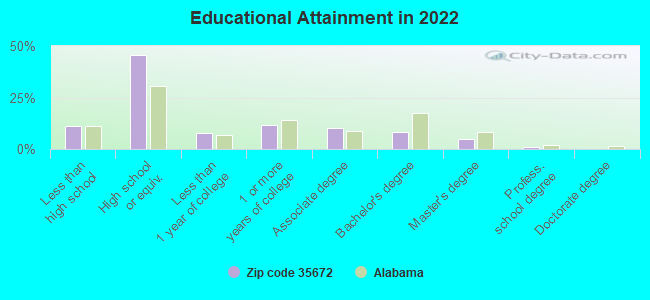
Private vs. public school enrollment:
Students in private schools in grades 1 to 8 (elementary and middle school):
Here:
0.0%
Alabama:
14.7%
Students in private schools in grades 9 to 12 (high school):
Here:
0.0%
Alabama:
16.3%
Students in private undergraduate colleges:
Here:
0.0%
Alabama:
14.6%
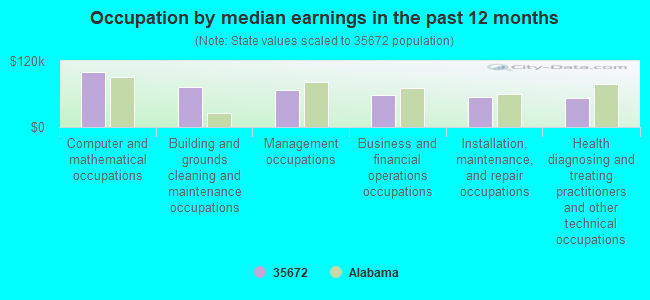
Occupation by median earnings in the past 12 months ($)
100,587Computer and mathematical occupations
71,932Building and grounds cleaning and maintenance occupations
66,455Management occupations
58,976Business and financial operations occupations
54,596Installation, maintenance, and repair occupations
53,614Health diagnosing and treating practitioners and other technical occupations
Top industries in this zip code by the number of employees in 2005:
Accommodation and Food Services: Limited-Service Restaurants (20-49 employees: 1 establishment)
Accommodation and Food Services: All Other Traveler Accommodation (20-49: 1)
Other Services (except Public Administration): Religious Organizations (5-9: 2, 1-4: 4)
Accommodation and Food Services: Caterers (10-19: 1)
Fatal accident statistics in 2014:
Fatal accident count: 3
Vehicles involved in fatal accidents: 3
Fatal accidents caused by drunken drivers: 1
Fatalities: 3
Persons involved in fatal accidents: 4
Pedestrians involved in fatal accidents: 0
Fatal accident statistics in 2013:
Fatal accident count: 3
Vehicles involved in fatal accidents: 5
Fatal accidents caused by drunken drivers: 1
Fatalities: 3
Persons involved in fatal accidents: 7
Pedestrians involved in fatal accidents: 0
Home Mortgage Disclosure Act Aggregated Statistics For Year 2009 (Based on 2 partial tracts)
A) FHA, FSA/RHS & VA Home Purchase Loans
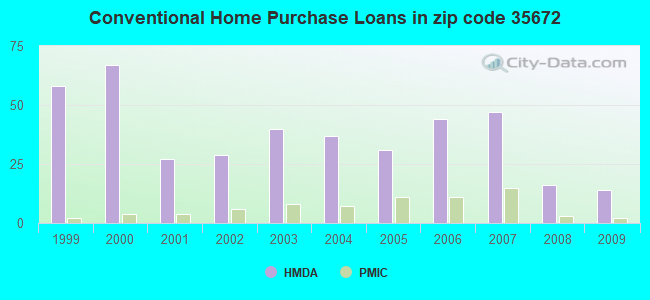
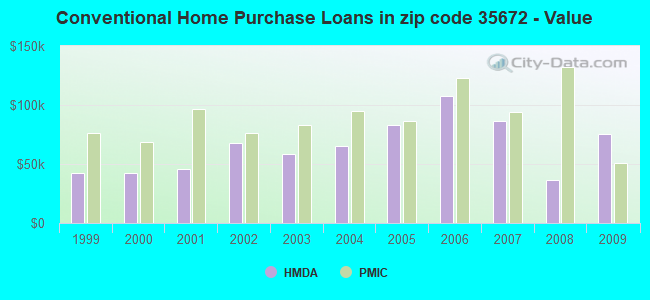
B) Conventional Home Purchase Loans
C) Refinancings
D) Home Improvement Loans
F) Non-occupant Loans on < 5 Family Dwellings (A B C & D)
G) Loans On Manufactured Home Dwelling (A B C & D)
Number
Average Value
Number
Average Value
Number
Average Value
Number
Average Value
Number
Average Value
Number
Average Value
LOANS ORIGINATED
7
$104,829
14
$75,489
69
$115,728
17
$24,669
9
$85,182
8
$37,994
APPLICATIONS APPROVED, NOT ACCEPTED
3
$69,500
2
$27,590
7
$111,597
1
$46,790
0
$0
2
$27,590
APPLICATIONS DENIED
4
$59,512
13
$47,500
38
$108,801
4
$15,145
2
$158,555
11
$33,146
APPLICATIONS WITHDRAWN
2
$56,390
2
$41,300
21
$120,304
0
$0
2
$231,345
1
$23,400
FILES CLOSED FOR INCOMPLETENESS
1
$58,790
2
$30,595
7
$124,706
0
$0
1
$167,080
2
$30,595
Aggregated Statistics For Year 2008 (Based on 2 partial tracts)
A) FHA, FSA/RHS & VA Home Purchase Loans
B) Conventional Home Purchase Loans
C) Refinancings
D) Home Improvement Loans
F) Non-occupant Loans on < 5 Family Dwellings (A B C & D)
G) Loans On Manufactured Home Dwelling (A B C & D)
Number
Average Value
Number
Average Value
Number
Average Value
Number
Average Value
Number
Average Value
Number
Average Value
LOANS ORIGINATED
13
$106,969
16
$36,633
46
$97,903
22
$21,340
10
$55,104
19
$32,234
APPLICATIONS APPROVED, NOT ACCEPTED
1
$67,350
3
$76,323
6
$86,692
2
$51,290
1
$24,600
3
$54,843
APPLICATIONS DENIED
4
$92,232
19
$50,982
42
$95,808
18
$39,198
2
$27,595
17
$35,718
APPLICATIONS WITHDRAWN
2
$90,105
4
$124,510
11
$119,480
2
$49,315
1
$23,130
0
$0
FILES CLOSED FOR INCOMPLETENESS
0
$0
2
$95,940
5
$131,942
1
$43,700
1
$169,140
1
$49,440
Aggregated Statistics For Year 2007 (Based on 2 partial tracts)
A) FHA, FSA/RHS & VA Home Purchase Loans
B) Conventional Home Purchase Loans
C) Refinancings
D) Home Improvement Loans
F) Non-occupant Loans on < 5 Family Dwellings (A B C & D)
G) Loans On Manufactured Home Dwelling (A B C & D)
Number
Average Value
Number
Average Value
Number
Average Value
Number
Average Value
Number
Average Value
Number
Average Value
LOANS ORIGINATED
6
$86,622
47
$86,713
60
$92,781
27
$17,192
13
$127,429
24
$29,711
APPLICATIONS APPROVED, NOT ACCEPTED
1
$88,270
6
$47,773
12
$106,410
3
$45,703
1
$68,730
5
$48,124
APPLICATIONS DENIED
4
$73,440
17
$55,827
46
$100,902
15
$63,165
3
$94,607
14
$52,061
APPLICATIONS WITHDRAWN
2
$55,790
2
$128,800
18
$111,756
2
$77,370
0
$0
2
$61,825
FILES CLOSED FOR INCOMPLETENESS
0
$0
1
$31,870
7
$98,693
0
$0
0
$0
0
$0
Aggregated Statistics For Year 2006 (Based on 2 partial tracts)
A) FHA, FSA/RHS & VA Home Purchase Loans
B) Conventional Home Purchase Loans
C) Refinancings
D) Home Improvement Loans
F) Non-occupant Loans on < 5 Family Dwellings (A B C & D)
G) Loans On Manufactured Home Dwelling (A B C & D)
Number
Average Value
Number
Average Value
Number
Average Value
Number
Average Value
Number
Average Value
Number
Average Value
LOANS ORIGINATED
2
$64,145
44
$107,894
69
$71,654
28
$21,255
16
$163,416
25
$30,340
APPLICATIONS APPROVED, NOT ACCEPTED
1
$59,390
13
$94,649
15
$90,071
3
$43,077
1
$161,430
8
$61,634
APPLICATIONS DENIED
1
$51,160
29
$67,748
46
$78,272
17
$47,729
4
$92,048
28
$49,074
APPLICATIONS WITHDRAWN
0
$0
6
$139,602
23
$96,045
4
$81,435
4
$116,315
2
$19,625
FILES CLOSED FOR INCOMPLETENESS
0
$0
3
$71,777
9
$98,564
1
$48,330
0
$0
1
$21,600
Aggregated Statistics For Year 2005 (Based on 2 partial tracts)
A) FHA, FSA/RHS & VA Home Purchase Loans
B) Conventional Home Purchase Loans
C) Refinancings
D) Home Improvement Loans
F) Non-occupant Loans on < 5 Family Dwellings (A B C & D)
G) Loans On Manufactured Home Dwelling (A B C & D)
Number
Average Value
Number
Average Value
Number
Average Value
Number
Average Value
Number
Average Value
Number
Average Value
LOANS ORIGINATED
6
$87,783
31
$83,179
67
$71,844
22
$11,362
11
$68,505
17
$33,495
APPLICATIONS APPROVED, NOT ACCEPTED
1
$47,810
13
$56,220
16
$67,681
0
$0
1
$18,510
11
$47,386
APPLICATIONS DENIED
1
$43,180
30
$51,851
77
$82,349
19
$52,271
3
$58,527
27
$38,754
APPLICATIONS WITHDRAWN
1
$23,130
3
$82,350
31
$99,778
8
$77,702
0
$0
2
$47,385
FILES CLOSED FOR INCOMPLETENESS
0
$0
1
$41,130
20
$97,490
0
$0
1
$78,590
0
$0
Aggregated Statistics For Year 2004 (Based on 2 partial tracts)
A) FHA, FSA/RHS & VA Home Purchase Loans
B) Conventional Home Purchase Loans
C) Refinancings
D) Home Improvement Loans
F) Non-occupant Loans on < 5 Family Dwellings (A B C & D)
G) Loans On Manufactured Home Dwelling (A B C & D)
Number
Average Value
Number
Average Value
Number
Average Value
Number
Average Value
Number
Average Value
Number
Average Value
LOANS ORIGINATED
7
$66,707
37
$64,931
66
$78,355
19
$16,159
7
$60,043
15
$41,899
APPLICATIONS APPROVED, NOT ACCEPTED
0
$0
14
$60,777
21
$66,004
2
$51,885
1
$31,790
7
$43,337
APPLICATIONS DENIED
3
$42,843
20
$63,272
85
$79,260
7
$53,187
3
$83,773
27
$34,706
APPLICATIONS WITHDRAWN
1
$21,080
7
$51,247
23
$77,313
1
$30,590
3
$41,963
3
$44,303
FILES CLOSED FOR INCOMPLETENESS
0
$0
4
$76,332
24
$95,164
0
$0
0
$0
2
$36,375
Aggregated Statistics For Year 2003 (Based on 2 partial tracts)
A) FHA, FSA/RHS & VA Home Purchase Loans
B) Conventional Home Purchase Loans
C) Refinancings
D) Home Improvement Loans
F) Non-occupant Loans on < 5 Family Dwellings (A B C & D)
Number
Average Value
Number
Average Value
Number
Average Value
Number
Average Value
Number
Average Value
LOANS ORIGINATED
4
$66,650
40
$58,361
111
$83,172
20
$11,606
7
$45,450
APPLICATIONS APPROVED, NOT ACCEPTED
0
$0
9
$35,922
20
$74,184
0
$0
0
$0
APPLICATIONS DENIED
0
$0
38
$36,792
80
$74,576
11
$37,367
4
$34,680
APPLICATIONS WITHDRAWN
0
$0
4
$79,888
44
$86,365
0
$0
3
$43,647
FILES CLOSED FOR INCOMPLETENESS
0
$0
1
$104,980
11
$75,905
1
$17,990
0
$0
Aggregated Statistics For Year 2002 (Based on 2 partial tracts)
A) FHA, FSA/RHS & VA Home Purchase Loans
B) Conventional Home Purchase Loans
C) Refinancings
D) Home Improvement Loans
F) Non-occupant Loans on < 5 Family Dwellings (A B C & D)
Number
Average Value
Number
Average Value
Number
Average Value
Number
Average Value
Number
Average Value
LOANS ORIGINATED
5
$64,150
29
$67,474
75
$79,507
16
$7,648
2
$91,685
APPLICATIONS APPROVED, NOT ACCEPTED
0
$0
8
$65,309
20
$65,242
1
$1,800
1
$41,130
APPLICATIONS DENIED
1
$42,160
29
$45,846
61
$67,526
5
$25,812
3
$60,410
APPLICATIONS WITHDRAWN
1
$76,790
4
$63,178
15
$68,601
2
$60,375
0
$0
FILES CLOSED FOR INCOMPLETENESS
0
$0
0
$0
16
$67,003
1
$27,760
0
$0
Aggregated Statistics For Year 2001 (Based on 2 partial tracts)
A) FHA, FSA/RHS & VA Home Purchase Loans
B) Conventional Home Purchase Loans
C) Refinancings
D) Home Improvement Loans
F) Non-occupant Loans on < 5 Family Dwellings (A B C & D)
Number
Average Value
Number
Average Value
Number
Average Value
Number
Average Value
Number
Average Value
LOANS ORIGINATED
6
$70,195
27
$45,882
86
$79,302
23
$8,345
3
$26,993
APPLICATIONS APPROVED, NOT ACCEPTED
0
$0
13
$39,952
8
$74,536
1
$23,130
1
$29,390
APPLICATIONS DENIED
0
$0
40
$37,310
47
$68,141
5
$4,936
6
$24,623
APPLICATIONS WITHDRAWN
0
$0
4
$46,060
15
$77,315
2
$34,495
0
$0
FILES CLOSED FOR INCOMPLETENESS
0
$0
1
$16,450
9
$67,078
0
$0
0
$0
Aggregated Statistics For Year 2000 (Based on 2 partial tracts)
A) FHA, FSA/RHS & VA Home Purchase Loans
B) Conventional Home Purchase Loans
C) Refinancings
D) Home Improvement Loans
F) Non-occupant Loans on < 5 Family Dwellings (A B C & D)
Number
Average Value
Number
Average Value
Number
Average Value
Number
Average Value
Number
Average Value
LOANS ORIGINATED
9
$47,378
67
$42,129
54
$61,856
31
$10,520
9
$35,598
APPLICATIONS APPROVED, NOT ACCEPTED
7
$39,699
19
$32,856
8
$77,409
2
$8,010
2
$38,865
APPLICATIONS DENIED
4
$42,910
111
$31,128
33
$55,129
10
$8,226
5
$22,864
APPLICATIONS WITHDRAWN
4
$66,795
4
$48,968
15
$64,897
1
$1,030
1
$48,330
FILES CLOSED FOR INCOMPLETENESS
0
$0
2
$56,040
14
$54,241
0
$0
1
$55,530
Aggregated Statistics For Year 1999 (Based on 2 partial tracts)
A) FHA, FSA/RHS & VA Home Purchase Loans
B) Conventional Home Purchase Loans
C) Refinancings
D) Home Improvement Loans
F) Non-occupant Loans on < 5 Family Dwellings (A B C & D)

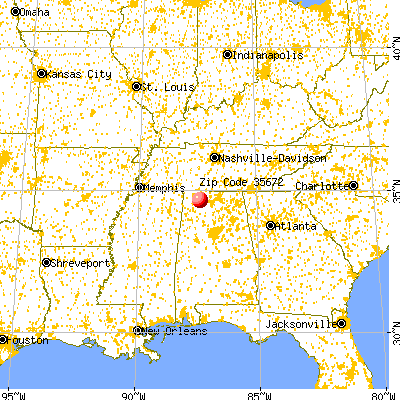


 Nearest zip codes: 35618, 35646, 35661, 35651, 35643, 35652.