Averages for the 2020 tax year for zip code 35775, filed in 2021:
Average Adjusted Gross Income (AGI) in 2020: $41,803 (Individual Income Tax Returns)
Here:
$41,803
State:
$63,984
Salary/wage: $41,978 (reported on 79.3% of returns)
Here:
$41,978
State:
$52,834
(% of AGI for various income ranges: 1012.5% for AGIs below $25k, 6525.0% for AGIs $25k-50k, 3652.5% for AGIs $50k-75k, 15500.0% for AGIs $100k-200k)
Taxable interest for individuals: $343 (reported on 24.1% of returns)
This zip code:
$343
Alabama:
$1,615
(% of AGI for various income ranges: 16.2% for AGIs below $25k)
Profit/loss from business: +$4,150 (reported on 13.8% of returns)
Here:
+$4,150
State:
+$9,534
(% of AGI for various income ranges: 207.5% for AGIs below $25k)
Earned income credit: $2,340 (reported on 17.2% of returns)
Here:
$2,340
State:
$2,628
(% of AGI for various income ranges: 146.2% for AGIs below $25k)
Percentage of individuals using paid preparers for their 2020 taxes: 86.2%
Here:
86%
State:
93%
(% for various income ranges: 83.3% for AGIs below $25k, 87.5% for AGIs $25k-50k, 75.0% for AGIs $50k-75k, 100.0% for AGIs $75k-100k, 100.0% for AGIs $100k-200k)
Averages for the 2012 tax year for zip code 35775, filed in 2013:
Average Adjusted Gross Income (AGI) in 2012: $38,785 (Individual Income Tax Returns)
Here:
$38,785
State:
$52,001
Salary/wage: $34,782 (reported on 81.5% of returns)
Here:
$34,782
State:
$43,822
(% of AGI for various income ranges: 71.0% for AGIs below $25k, 85.5% for AGIs $25k-50k, 73.8% for AGIs $50k-75k, 64.0% for AGIs $100k-200k)
Taxable interest for individuals: $283 (reported on 22.2% of returns)
This zip code:
$283
Alabama:
$1,592
Profit/loss from business: +$4,600 (reported on 11.1% of returns)
Here:
+$4,600
State:
+$9,151
Total itemized deductions: $15,860 (22% of AGI, reported on 18.5% of returns)
Here:
$15,860
State:
$21,388
Here:
21.6% of AGI
State:
20.1% of AGI
Charity contributions: $4,120 (reported on 18.5% of returns)
Here:
$4,120
State:
$5,925
Taxes paid: $3,080 (reported on 18.5% of returns)
35775:
$3,080
State:
$5,272
Earned income credit: $2,083 (reported on 22.2% of returns)
Here:
$2,083
State:
$2,646
(% of AGI for various income ranges: 6.5% for AGIs below $25k)
Percentage of individuals using paid preparers for their 2012 taxes: 70.4%
Here:
70%
State:
60%
(% for various income ranges: 64.3% for AGIs below $25k, 66.7% for AGIs $25k-50k, 120.0% for AGIs $50k-75k)
Averages for the 2004 tax year for zip code 35775, filed in 2005:
Average Adjusted Gross Income (AGI) in 2004: $33,041 (Individual Income Tax Returns)
Here:
$33,041
State:
$42,302
Salary/wage: $29,959 (reported on 82.8% of returns)
Here:
$29,959
State:
$36,626
(% of AGI for various income ranges: 69.2% for AGIs below $10k, 83.1% for AGIs $10k-25k, 81.2% for AGIs $25k-50k, 84.8% for AGIs $50k-75k, 54.1% for AGIs $75k-100k)
Taxable interest for individuals: $637 (reported on 30.7% of returns)
This zip code:
$637
Alabama:
$1,827
(% of AGI for various income ranges: 2.8% for AGIs below $10k, 0.5% for AGIs $10k-25k, 0.8% for AGIs $25k-50k, 0.3% for AGIs $50k-75k, 0.5% for AGIs $75k-100k)
Taxable dividends: $364 (reported on 11.1% of returns)
Here:
$364
State:
$4,206
Net capital gain/loss: +$500 (reported on 5.4% of returns)
Here:
+$500
State:
+$13,031
Profit/loss from business: +$2,245 (reported on 16.6% of returns)
Here:
+$2,245
State:
+$8,302
Total itemized deductions: $12,471 (23% of AGI, reported on 23.6% of returns)
Here:
$12,471
State:
$17,623
Here:
22.9% of AGI
State:
20.8% of AGI
(% of AGI for various income ranges: 8.1% for AGIs $10k-25k, 9.5% for AGIs $25k-50k, 10.0% for AGIs $50k-75k, 8.6% for AGIs $75k-100k)
Charity contributions deductions: $4,559 (8% of AGI, reported on 19.9% of returns)
Here:
$4,559
State:
$4,768
Here:
8.1% of AGI
State:
5.4% of AGI
(% of AGI for various income ranges: 5.9% for AGIs below $10k, 1.7% for AGIs $25k-50k, 4.2% for AGIs $50k-75k, 3.5% for AGIs $75k-100k)
Total tax: $4,063 (reported on 69.9% of returns)
35775:
$4,063
State:
$6,905
(% of AGI for various income ranges: 3.5% for AGIs below $10k, 2.9% for AGIs $10k-25k, 6.3% for AGIs $25k-50k, 9.1% for AGIs $50k-75k, 14.4% for AGIs $75k-100k)
Earned income credit: $1,831 (reported on 26.0% of returns)
Here:
$1,831
State:
$2,048
Percentage of individuals using paid preparers for their 2004 taxes: 73.6%
Here:
74%
State:
65%
(% for various income ranges: 66.7% for AGIs below $10k, 74.4% for AGIs $10k-25k, 76.3% for AGIs $25k-50k, 75.0% for AGIs $50k-75k, 78.3% for AGIs $75k-100k)
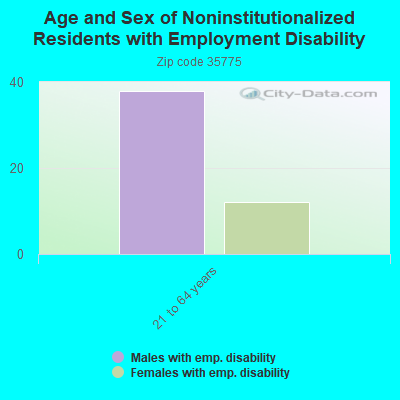
Household received Food Stamps/SNAP in the past 12 months: 11 Household did not receive Food Stamps/SNAP in the past 12 months: 221
Women who did not have a birth in the past 12 months: 63 (18 now married, 45 unmarried)
Housing units in zip code 35775 with a mortgage: 49 (32 second mortgage, 34 both second mortgage and home equity loan) Residents with income below the poverty level in 2022:
This zip code:
2.5%
Whole state:
16.2%
Residents with income below 50% of the poverty level in 2022:
This zip code:
0.2%
Whole state:
8.6%
Median number of rooms in houses and condos:
Here:
6.6
State:
6.5
Notable locations in this zip code not listed on our city pages
Notable locations in zip code 35775: Johnson Landing (A), Abercrombie Dairy Farm (B), Slaughter Landing (C), Sunnyside Landing (D), Talucah Volunteer Fire Department (E). Display/hide their locations on the map
Churches in zip code 35775 include: Mount Pleasant Church (A), Mount Mariah Church (B), Leadus Chapel (C), First Church of Jesus Christ (D), Valhermoso Spring Church (E), Talucah Church (F). Display/hide their locations on the map
Cemeteries: Chunns Cemetery (1), Valermosos Cemetery (2), Draper Cemetery (3), Ballinger Cemetery (4), Lyle Cemetery (5). Display/hide their locations on the map
In group quarters: 5 (-1 institutionalized population)
Size of family households: 94 2-persons, 48 5-persons, 5 6-persons
Size of nonfamily households: 83 1-person
99.5% of residents of 35775 zip code speak English at home.
Foreign born population: 0 (0.0%)
:
0.0%
Whole state:
3.8%
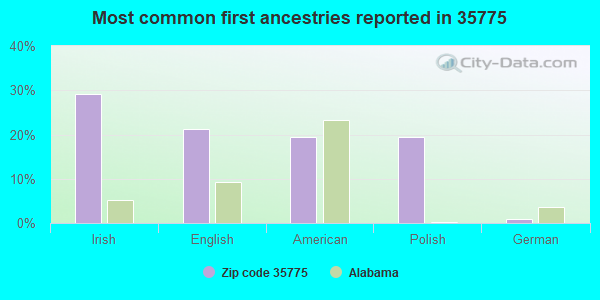
29%Irish
21%English
19%American
19%Polish
1%German
Housing units lacking complete plumbing facilities: 17.4%
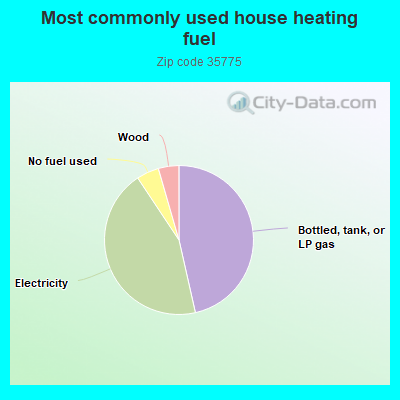
46.8%Bottled, tank, or LP gas
44.5%Electricity
4.9%No fuel used
4.5%Wood
Population in 1990: 667.
Place of birth for U.S.-born residents:
This state: 512
South: 40
West: 1
81% of the 35775 zip code residents lived in the same house 5 years ago. Out of people who lived in different houses, 51% lived in this county. Out of people who lived in different counties, 50% lived in Alabama.
98% of the 35775 zip code residents lived in the same house 1 year ago. Out of people who lived in different houses, 100% moved from different county within same state. Out of people who lived in different houses, 14% moved from different state.
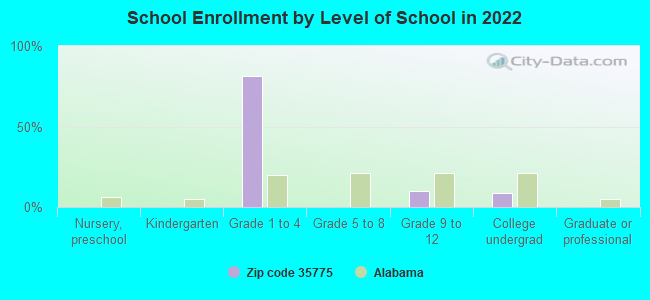
Private vs. public school enrollment:
Students in private schools in grades 1 to 8 (elementary and middle school):
Here:
0.0%
Alabama:
14.7%
Students in private schools in grades 9 to 12 (high school):
Here:
0.0%
Alabama:
16.3%
Students in private undergraduate colleges:
Here:
0.0%
Alabama:
14.6%
Top industries in this zip code by the number of employees in 2005:
Other Services (except Public Administration): Religious Organizations (5-9 employees: 1 establishment)
Construction: Other Building Equipment Contractors (1-4: 1)
Fatal accident statistics in 2011:
Fatal accident count: 1
Vehicles involved in fatal accidents: 1
Fatal accidents caused by drunken drivers: 0
Fatalities: 1
Persons involved in fatal accidents: 1
Pedestrians involved in fatal accidents: 0
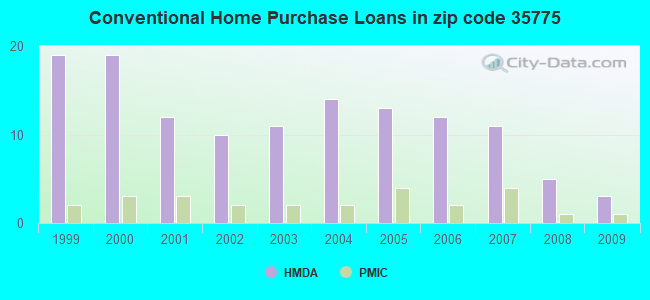
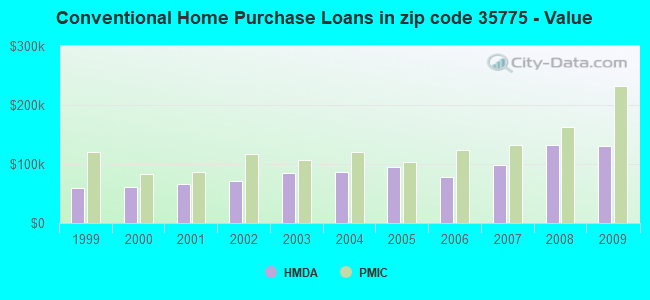
Home Mortgage Disclosure Act Aggregated Statistics For Year 2009 (Based on 2 partial tracts)
A) FHA, FSA/RHS & VA Home Purchase Loans
B) Conventional Home Purchase Loans
C) Refinancings
D) Home Improvement Loans
F) Non-occupant Loans on < 5 Family Dwellings (A B C & D)
G) Loans On Manufactured Home Dwelling (A B C & D)
Number
Average Value
Number
Average Value
Number
Average Value
Number
Average Value
Number
Average Value
Number
Average Value
LOANS ORIGINATED
3
$140,830
3
$129,710
16
$156,189
5
$21,974
1
$57,740
3
$33,363
APPLICATIONS APPROVED, NOT ACCEPTED
0
$0
1
$79,240
1
$137,940
0
$0
0
$0
1
$32,720
APPLICATIONS DENIED
1
$99,290
4
$65,282
10
$129,314
3
$24,433
0
$0
4
$47,318
APPLICATIONS WITHDRAWN
1
$148,850
0
$0
5
$143,622
0
$0
0
$0
0
$0
FILES CLOSED FOR INCOMPLETENESS
0
$0
0
$0
1
$153,820
0
$0
0
$0
0
$0
Aggregated Statistics For Year 2008 (Based on 2 partial tracts)
A) FHA, FSA/RHS & VA Home Purchase Loans
B) Conventional Home Purchase Loans
C) Refinancings
D) Home Improvement Loans
F) Non-occupant Loans on < 5 Family Dwellings (A B C & D)
G) Loans On Manufactured Home Dwelling (A B C & D)
Number
Average Value
Number
Average Value
Number
Average Value
Number
Average Value
Number
Average Value
Number
Average Value
LOANS ORIGINATED
3
$106,880
5
$131,688
15
$104,945
3
$34,807
2
$79,560
4
$44,390
APPLICATIONS APPROVED, NOT ACCEPTED
0
$0
1
$14,440
2
$100,090
0
$0
0
$0
1
$26,150
APPLICATIONS DENIED
0
$0
2
$64,000
11
$128,028
4
$65,002
1
$90,140
4
$55,820
APPLICATIONS WITHDRAWN
0
$0
1
$103,780
4
$115,008
1
$66,080
0
$0
0
$0
FILES CLOSED FOR INCOMPLETENESS
0
$0
0
$0
2
$172,510
0
$0
0
$0
0
$0
Aggregated Statistics For Year 2007 (Based on 2 partial tracts)
A) FHA, FSA/RHS & VA Home Purchase Loans
B) Conventional Home Purchase Loans
C) Refinancings
D) Home Improvement Loans
F) Non-occupant Loans on < 5 Family Dwellings (A B C & D)
G) Loans On Manufactured Home Dwelling (A B C & D)
Number
Average Value
Number
Average Value
Number
Average Value
Number
Average Value
Number
Average Value
Number
Average Value
LOANS ORIGINATED
2
$129,120
11
$98,879
14
$99,299
4
$15,920
2
$79,560
6
$40,313
APPLICATIONS APPROVED, NOT ACCEPTED
0
$0
1
$89,020
2
$131,690
0
$0
0
$0
1
$28,230
APPLICATIONS DENIED
0
$0
4
$81,162
11
$110,515
6
$49,537
1
$44,270
4
$49,845
APPLICATIONS WITHDRAWN
0
$0
1
$94,150
4
$136,340
2
$39,300
0
$0
1
$48,280
FILES CLOSED FOR INCOMPLETENESS
0
$0
0
$0
1
$202,910
0
$0
0
$0
0
$0
Aggregated Statistics For Year 2006 (Based on 2 partial tracts)
A) FHA, FSA/RHS & VA Home Purchase Loans
B) Conventional Home Purchase Loans
C) Refinancings
D) Home Improvement Loans
F) Non-occupant Loans on < 5 Family Dwellings (A B C & D)
G) Loans On Manufactured Home Dwelling (A B C & D)
Number
Average Value
Number
Average Value
Number
Average Value
Number
Average Value
Number
Average Value
Number
Average Value
LOANS ORIGINATED
1
$135,220
12
$78,703
16
$99,699
2
$43,950
2
$53,175
5
$40,518
APPLICATIONS APPROVED, NOT ACCEPTED
0
$0
2
$74,345
3
$102,337
1
$32,880
0
$0
1
$62,240
APPLICATIONS DENIED
0
$0
4
$64,683
11
$102,656
3
$51,650
1
$52,770
3
$53,627
APPLICATIONS WITHDRAWN
0
$0
3
$100,730
6
$97,015
0
$0
0
$0
1
$34,810
FILES CLOSED FOR INCOMPLETENESS
0
$0
1
$58,060
4
$137,542
0
$0
0
$0
0
$0
Aggregated Statistics For Year 2005 (Based on 2 partial tracts)
A) FHA, FSA/RHS & VA Home Purchase Loans
B) Conventional Home Purchase Loans
C) Refinancings
D) Home Improvement Loans
F) Non-occupant Loans on < 5 Family Dwellings (A B C & D)
G) Loans On Manufactured Home Dwelling (A B C & D)
Number
Average Value
Number
Average Value
Number
Average Value
Number
Average Value
Number
Average Value
Number
Average Value
LOANS ORIGINATED
3
$86,990
13
$94,118
17
$99,552
3
$69,187
3
$72,713
5
$38,592
APPLICATIONS APPROVED, NOT ACCEPTED
0
$0
4
$59,428
5
$89,150
0
$0
0
$0
3
$51,113
APPLICATIONS DENIED
0
$0
4
$70,455
20
$91,468
4
$56,220
1
$57,100
4
$63,558
APPLICATIONS WITHDRAWN
0
$0
3
$91,963
11
$103,225
2
$53,495
0
$0
1
$54,220
FILES CLOSED FOR INCOMPLETENESS
0
$0
0
$0
6
$81,723
0
$0
0
$0
0
$0
Aggregated Statistics For Year 2004 (Based on 2 partial tracts)
A) FHA, FSA/RHS & VA Home Purchase Loans
B) Conventional Home Purchase Loans
C) Refinancings
D) Home Improvement Loans
F) Non-occupant Loans on < 5 Family Dwellings (A B C & D)
G) Loans On Manufactured Home Dwelling (A B C & D)
Number
Average Value
Number
Average Value
Number
Average Value
Number
Average Value
Number
Average Value
Number
Average Value
LOANS ORIGINATED
2
$102,335
14
$85,917
19
$92,053
2
$38,815
3
$47,370
6
$35,957
APPLICATIONS APPROVED, NOT ACCEPTED
0
$0
3
$66,083
4
$110,958
1
$52,610
0
$0
2
$51,330
APPLICATIONS DENIED
0
$0
4
$64,842
18
$93,228
5
$50,108
0
$0
4
$61,915
APPLICATIONS WITHDRAWN
0
$0
2
$80,040
5
$102,976
0
$0
1
$35,450
0
$0
FILES CLOSED FOR INCOMPLETENESS
0
$0
0
$0
6
$112,922
0
$0
0
$0
1
$39,620
Aggregated Statistics For Year 2003 (Based on 2 partial tracts)
A) FHA, FSA/RHS & VA Home Purchase Loans
B) Conventional Home Purchase Loans
C) Refinancings
D) Home Improvement Loans
F) Non-occupant Loans on < 5 Family Dwellings (A B C & D)
Number
Average Value
Number
Average Value
Number
Average Value
Number
Average Value
Number
Average Value
LOANS ORIGINATED
2
$120,300
11
$84,516
39
$101,015
2
$35,045
2
$57,825
APPLICATIONS APPROVED, NOT ACCEPTED
0
$0
2
$99,045
5
$80,392
0
$0
0
$0
APPLICATIONS DENIED
0
$0
5
$50,142
20
$82,814
2
$38,015
1
$55,660
APPLICATIONS WITHDRAWN
0
$0
1
$173,870
9
$89,967
0
$0
0
$0
FILES CLOSED FOR INCOMPLETENESS
0
$0
0
$0
2
$80,040
0
$0
0
$0
Aggregated Statistics For Year 2002 (Based on 2 partial tracts)
A) FHA, FSA/RHS & VA Home Purchase Loans
B) Conventional Home Purchase Loans
C) Refinancings
D) Home Improvement Loans
F) Non-occupant Loans on < 5 Family Dwellings (A B C & D)
Number
Average Value
Number
Average Value
Number
Average Value
Number
Average Value
Number
Average Value
LOANS ORIGINATED
2
$103,300
10
$70,640
26
$98,436
2
$25,745
1
$51,330
APPLICATIONS APPROVED, NOT ACCEPTED
0
$0
2
$52,770
6
$61,005
0
$0
0
$0
APPLICATIONS DENIED
0
$0
10
$29,048
12
$62,609
2
$15,080
1
$26,790
APPLICATIONS WITHDRAWN
0
$0
2
$84,530
5
$83,696
0
$0
0
$0
FILES CLOSED FOR INCOMPLETENESS
0
$0
0
$0
3
$95,063
0
$0
0
$0
Aggregated Statistics For Year 2001 (Based on 2 partial tracts)
A) FHA, FSA/RHS & VA Home Purchase Loans
B) Conventional Home Purchase Loans
C) Refinancings
D) Home Improvement Loans
F) Non-occupant Loans on < 5 Family Dwellings (A B C & D)
Number
Average Value
Number
Average Value
Number
Average Value
Number
Average Value
Number
Average Value
LOANS ORIGINATED
3
$72,553
12
$66,205
20
$89,944
1
$15,400
1
$104,100
APPLICATIONS APPROVED, NOT ACCEPTED
0
$0
3
$47,800
2
$70,495
1
$14,760
0
$0
APPLICATIONS DENIED
0
$0
13
$46,837
11
$62,366
2
$11,150
0
$0
APPLICATIONS WITHDRAWN
0
$0
1
$72,500
5
$92,070
0
$0
0
$0
FILES CLOSED FOR INCOMPLETENESS
0
$0
0
$0
3
$93,407
0
$0
0
$0
Aggregated Statistics For Year 2000 (Based on 2 partial tracts)
A) FHA, FSA/RHS & VA Home Purchase Loans
B) Conventional Home Purchase Loans
C) Refinancings
D) Home Improvement Loans
F) Non-occupant Loans on < 5 Family Dwellings (A B C & D)
Number
Average Value
Number
Average Value
Number
Average Value
Number
Average Value
Number
Average Value
LOANS ORIGINATED
2
$96,560
19
$61,788
8
$68,952
3
$20,800
0
$0
APPLICATIONS APPROVED, NOT ACCEPTED
0
$0
3
$32,667
1
$62,070
1
$29,510
0
$0
APPLICATIONS DENIED
0
$0
13
$41,322
5
$59,476
2
$11,470
1
$29,670
APPLICATIONS WITHDRAWN
0
$0
0
$0
3
$64,587
0
$0
0
$0
FILES CLOSED FOR INCOMPLETENESS
0
$0
0
$0
2
$79,720
0
$0
0
$0
Aggregated Statistics For Year 1999 (Based on 2 partial tracts)
A) FHA, FSA/RHS & VA Home Purchase Loans
B) Conventional Home Purchase Loans
C) Refinancings
D) Home Improvement Loans
F) Non-occupant Loans on < 5 Family Dwellings (A B C & D)

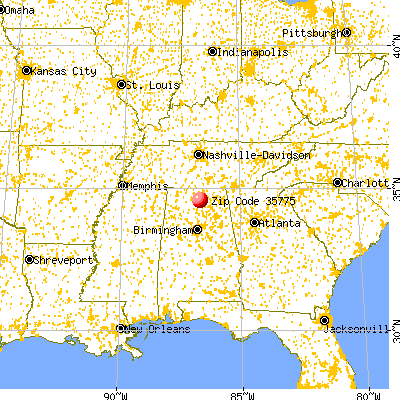


 Nearest zip codes: 35670, 35808, 35754, 35824, 35756, 35758.