Estimated zip code population in 2022: 6,328 Zip code population in 2010: 6,514 Zip code population in 2000: 5,950
Houses and condos: 2,642 Renter-occupied apartments: 593
% of renters here:
28%
State:
30%
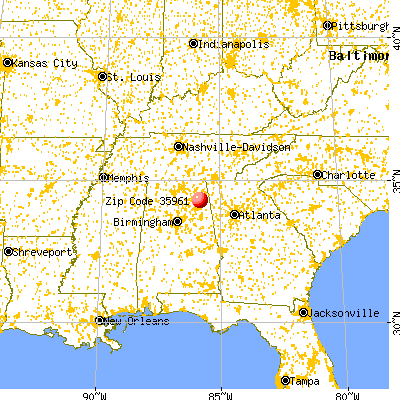
March 2022 cost of living index in zip code 35961: 79.9 (low, U.S. average is 100)
Land area: 127.9 sq. mi. Water area: 0.5 sq. mi.
Population density: 49 people per square mile
(very low).
OSM Map
General Map
Google Map
MSN Map
OSM Map
General Map
Google Map
MSN Map
OSM Map
General Map
Google Map
MSN Map
OSM Map
General Map
Google Map
MSN Map
Please wait while loading the map...
Real estate property taxes paid for housing units in 2022:
This zip code:
0.3% ($323)
Alabama:
0.4% ($718)
Median real estate property taxes paid for housing units with mortgages in 2022: $532 (0.4%) Median real estate property taxes paid for housing units with no mortgage in 2022: $272 (0.5%)
Estimated median house/condo value in 2022: $95,187
35961:
$95,187
Alabama:
$200,900
According to our research of Alabama and other state lists, there were 17 registered sex offenders living in 35961 zip code as of May 28, 2024. The ratio of all residents to sex offenders in zip code 35961 is 416 to 1. The ratio of registered sex offenders to all residents in this zip code is near the state average.
Median resident age:
This zip code:
35.8 years
Alabama median age:
39.6 years
Average household size:
This zip code:
2.9 people
Alabama:
2.5 people
Averages for the 2020 tax year for zip code 35961, filed in 2021:
Average Adjusted Gross Income (AGI) in 2020: $39,300 (Individual Income Tax Returns)
Here:
$39,300
State:
$63,984
Salary/wage: $37,626 (reported on 83.3% of returns)
Here:
$37,626
State:
$52,834
(% of AGI for various income ranges: 1277.6% for AGIs below $25k, 3962.0% for AGIs $25k-50k, 6571.8% for AGIs $50k-75k, 9041.8% for AGIs $75k-100k, 18580.0% for AGIs $100k-200k)
Taxable interest for individuals: $552 (reported on 20.9% of returns)
This zip code:
$552
Alabama:
$1,615
(% of AGI for various income ranges: 15.3% for AGIs below $25k, 7.0% for AGIs $25k-50k, 19.1% for AGIs $50k-75k, 24.5% for AGIs $75k-100k, 54.4% for AGIs $100k-200k)
Ordinary dividends: $2,239 (reported on 7.5% of returns)
Here:
$2,239
State:
$7,660
(% of AGI for various income ranges: 14.9% for AGIs below $25k, 13.1% for AGIs $25k-50k, 10.5% for AGIs $50k-75k, 19.1% for AGIs $75k-100k, 185.6% for AGIs $100k-200k)
Net capital gain/loss in AGI: +$5,344 (reported on 6.7% of returns)
Here:
+$5,344
State:
+$23,528
(% of AGI for various income ranges: 4.7% for AGIs below $25k, 31.1% for AGIs $25k-50k, 57.3% for AGIs $50k-75k, 73.6% for AGIs $75k-100k, 470.0% for AGIs $100k-200k)
Profit/loss from business: +$6,981 (reported on 15.5% of returns)
Here:
+$6,981
State:
+$9,534
(% of AGI for various income ranges: 155.9% for AGIs below $25k, 98.0% for AGIs $25k-50k, 128.6% for AGIs $50k-75k, 645.6% for AGIs $100k-200k)
Taxable individual retirement arrangement distribution: $13,622 (reported on 3.8% of returns)
35961:
$13,622
Alabama:
$19,004
(% of AGI for various income ranges: 35.7% for AGIs below $25k, 30.0% for AGIs $25k-50k, 352.3% for AGIs $50k-75k)
Total itemized deductions: $29,360 (reported on 2.1% of returns)
Here:
$29,360
State:
$37,338
(% of AGI for various income ranges: 62.9% for AGIs below $25k, 1106.7% for AGIs $100k-200k)
Charity contributions: $11,875 (reported on 1.7% of returns)
Here:
$11,875
State:
$18,005
(% of AGI for various income ranges: 527.8% for AGIs $100k-200k)
Taxes paid: $5,400 (reported on 2.1% of returns)
35961:
$5,400
State:
$6,484
(% of AGI for various income ranges: 300.0% for AGIs $100k-200k)
Earned income credit: $2,582 (reported on 27.2% of returns)
Here:
$2,582
State:
$2,628
(% of AGI for various income ranges: 140.7% for AGIs below $25k, 102.1% for AGIs $25k-50k)
Percentage of individuals using paid preparers for their 2020 taxes: 95.8%
Here:
96%
State:
93%
(% for various income ranges: 95.1% for AGIs below $25k, 97.4% for AGIs $25k-50k, 96.6% for AGIs $50k-75k, 92.9% for AGIs $75k-100k, 92.3% for AGIs $100k-200k, 100.0% for AGIs over 200k)
Averages for the 2012 tax year for zip code 35961, filed in 2013:
Average Adjusted Gross Income (AGI) in 2012: $33,437 (Individual Income Tax Returns)
Here:
$33,437
State:
$52,001
Salary/wage: $31,208 (reported on 86.2% of returns)
Here:
$31,208
State:
$43,822
(% of AGI for various income ranges: 82.4% for AGIs below $25k, 85.8% for AGIs $25k-50k, 86.8% for AGIs $50k-75k, 77.6% for AGIs $75k-100k, 64.6% for AGIs $100k-200k)
Taxable interest for individuals: $768 (reported on 22.2% of returns)
This zip code:
$768
Alabama:
$1,592
(% of AGI for various income ranges: 0.7% for AGIs below $25k, 0.5% for AGIs $25k-50k, 0.4% for AGIs $50k-75k, 0.5% for AGIs $75k-100k, 0.4% for AGIs $100k-200k)
Ordinary dividends: $2,641 (reported on 7.6% of returns)
Here:
$2,641
State:
$5,697
(% of AGI for various income ranges: 0.2% for AGIs below $25k, 0.3% for AGIs $25k-50k, 0.2% for AGIs $50k-75k, 0.3% for AGIs $75k-100k, 2.3% for AGIs $100k-200k)
Net capital gain/loss in AGI: +$4,558 (reported on 5.3% of returns)
Here:
+$4,558
State:
+$13,286
(% of AGI for various income ranges: 0.3% for AGIs $25k-50k, 0.6% for AGIs $50k-75k, 3.1% for AGIs $100k-200k)
Profit/loss from business: +$6,334 (reported on 15.6% of returns)
Here:
+$6,334
State:
+$9,151
(% of AGI for various income ranges: 8.8% for AGIs below $25k, 2.1% for AGIs $25k-50k, 0.5% for AGIs $50k-75k, 1.4% for AGIs $75k-100k)
Taxable individual retirement arrangement distribution: $11,257 (reported on 6.2% of returns)
35961:
$11,257
Alabama:
$14,992
(% of AGI for various income ranges: 1.2% for AGIs below $25k, 3.2% for AGIs $25k-50k, 7.4% for AGIs $75k-100k)
Total itemized deductions: $17,759 (22% of AGI, reported on 12.9% of returns)
Here:
$17,759
State:
$21,388
Here:
22.4% of AGI
State:
20.1% of AGI
(% of AGI for various income ranges: 3.0% for AGIs below $25k, 5.2% for AGIs $25k-50k, 8.2% for AGIs $50k-75k, 8.7% for AGIs $75k-100k, 12.2% for AGIs $100k-200k)
Charity contributions: $4,233 (reported on 10.7% of returns)
Here:
$4,233
State:
$5,925
(% of AGI for various income ranges: 0.4% for AGIs below $25k, 0.9% for AGIs $25k-50k, 1.4% for AGIs $50k-75k, 2.0% for AGIs $75k-100k, 2.9% for AGIs $100k-200k)
Taxes paid: $3,793 (reported on 12.9% of returns)
35961:
$3,793
State:
$5,272
(% of AGI for various income ranges: 0.3% for AGIs below $25k, 0.8% for AGIs $25k-50k, 1.7% for AGIs $50k-75k, 2.1% for AGIs $75k-100k, 3.6% for AGIs $100k-200k)
Earned income credit: $2,679 (reported on 33.8% of returns)
Here:
$2,679
State:
$2,646
(% of AGI for various income ranges: 9.2% for AGIs below $25k, 1.8% for AGIs $25k-50k)
Percentage of individuals using paid preparers for their 2012 taxes: 84.9%
Here:
85%
State:
60%
(% for various income ranges: 84.6% for AGIs below $25k, 84.1% for AGIs $25k-50k, 86.4% for AGIs $50k-75k, 90.0% for AGIs $75k-100k, 85.7% for AGIs $100k-200k)
Averages for the 2004 tax year for zip code 35961, filed in 2005:
Average Adjusted Gross Income (AGI) in 2004: $26,692 (Individual Income Tax Returns)
Here:
$26,692
State:
$42,302
Salary/wage: $26,760 (reported on 86.0% of returns)
Here:
$26,760
State:
$36,626
(% of AGI for various income ranges: 106.0% for AGIs below $10k, 88.4% for AGIs $10k-25k, 87.7% for AGIs $25k-50k, 88.1% for AGIs $50k-75k, 84.3% for AGIs $75k-100k, 62.3% for AGIs over 100k)
Taxable interest for individuals: $1,209 (reported on 28.5% of returns)
This zip code:
$1,209
Alabama:
$1,827
(% of AGI for various income ranges: 5.8% for AGIs below $10k, 1.2% for AGIs $10k-25k, 1.6% for AGIs $25k-50k, 0.7% for AGIs $50k-75k, 1.0% for AGIs $75k-100k, 0.6% for AGIs over 100k)
Taxable dividends: $958 (reported on 9.1% of returns)
Here:
$958
State:
$4,206
(% of AGI for various income ranges: 2.8% for AGIs below $10k, 0.2% for AGIs $10k-25k, 0.2% for AGIs $25k-50k, 0.2% for AGIs $50k-75k, 0.1% for AGIs $75k-100k, 0.7% for AGIs over 100k)
Net capital gain/loss: +$4,168 (reported on 7.1% of returns)
Here:
+$4,168
State:
+$13,031
(% of AGI for various income ranges: 0.0% for AGIs below $10k, 0.4% for AGIs $10k-25k, 1.2% for AGIs $25k-50k, 2.6% for AGIs $50k-75k, 0.4% for AGIs over 100k)
Profit/loss from business: +$4,103 (reported on 14.3% of returns)
Here:
+$4,103
State:
+$8,302
(% of AGI for various income ranges: 14.8% for AGIs below $10k, 3.2% for AGIs $10k-25k, 2.1% for AGIs $25k-50k, 1.2% for AGIs $50k-75k)
IRA payment deduction: $1,963 (reported on 1.3% of returns)
35961:
$1,963
Alabama:
$3,006
Total itemized deductions: $14,145 (28% of AGI, reported on 13.1% of returns)
Here:
$14,145
State:
$17,623
Here:
28.1% of AGI
State:
20.8% of AGI
(% of AGI for various income ranges: 13.9% for AGIs below $10k, 4.0% for AGIs $10k-25k, 6.2% for AGIs $25k-50k, 9.0% for AGIs $50k-75k, 10.2% for AGIs $75k-100k, 7.2% for AGIs over 100k)
Charity contributions deductions: $3,391 (6% of AGI, reported on 11.1% of returns)
Here:
$3,391
State:
$4,768
Here:
6.3% of AGI
State:
5.4% of AGI
(% of AGI for various income ranges: 0.8% for AGIs below $10k, 0.6% for AGIs $10k-25k, 1.0% for AGIs $25k-50k, 2.1% for AGIs $50k-75k, 2.5% for AGIs $75k-100k, 2.7% for AGIs over 100k)
Total tax: $3,043 (reported on 58.8% of returns)
35961:
$3,043
State:
$6,905
(% of AGI for various income ranges: 4.5% for AGIs below $10k, 2.5% for AGIs $10k-25k, 5.7% for AGIs $25k-50k, 7.9% for AGIs $50k-75k, 10.2% for AGIs $75k-100k, 18.5% for AGIs over 100k)
Earned income credit: $2,073 (reported on 34.4% of returns)
Here:
$2,073
State:
$2,048
Percentage of individuals using paid preparers for their 2004 taxes: 84.4%
Here:
84%
State:
65%
(% for various income ranges: 80.1% for AGIs below $10k, 87.9% for AGIs $10k-25k, 82.5% for AGIs $25k-50k, 87.6% for AGIs $50k-75k, 72.9% for AGIs $75k-100k, 85.2% for AGIs over 100k)
Household received Food Stamps/SNAP in the past 12 months: 476 Household did not receive Food Stamps/SNAP in the past 12 months: 1,670
Women who had a birth in the past 12 months: 86 (33 now married, 44 unmarried) Women who did not have a birth in the past 12 months: 1,516 (711 now married, 803 unmarried)
Housing units in zip code 35961 with a mortgage: 488 (8 second mortgage, 8 both second mortgage and home equity loan) Houses without a mortgage: 86
Median monthly owner costs for units with a mortgage: $1,042 Median monthly owner costs for units without a mortgage: $365
Residents with income below the poverty level in 2022:
This zip code:
23.4%
Whole state:
16.2%
Residents with income below 50% of the poverty level in 2022:
This zip code:
15.7%
Whole state:
8.6%
Median number of rooms in houses and condos:
Here:
6.0
State:
6.5
Median number of rooms in apartments:
Here:
5.5
State:
4.7
Notable locations in this zip code not listed on our city pages
Notable locations in zip code 35961: Walnut Creek Farms (A), Collinsville Industrial Park (B), Brown Fell Community Center (C), Collinsville Volunteer Fire Department (D), Mount Vera Volunteer Fire Department (E), Black Creek Volunteer Fire Department (F), Peeks Corner Fire Protection Authority (G), Hendrixville Volunteer Fire Department (H). Display/hide their locations on the map
Churches in zip code 35961 include: Pleasant Valley Baptist Church (A), New Bethel Church (B), Pine Grove Church (C), Pilgrims Rest Baptist Church (D), Hunt Chapel (E), Porterville Church (F), Pleasant Valley Church (G), Pleasant Hill Church (H), Collinsville Presbyterian Church (I). Display/hide their locations on the map
Cemeteries: Mount Lookout Cemetery (1), Harbour Cemetery (2), Hall Cemetery (3), Pleasant Valley Cemetery (4), Gilbreath Cemetery (5), Freeman Cemetery (6), New Bethel Cemetery (7). Display/hide their locations on the map
Lakes and reservoirs: Dry Pond (A), Mountain View Lake (B), Ray Smiths Lake (C), John Gilbreath Number 1 Lake (D), West Lake (E). Display/hide their locations on the map
Streams, rivers, and creeks: Lick Branch (A), Falls Branch (B), Big Branch (C), Spring Branch (D), Horton Branch (E), Indian Creek (F), Jacks Creek (G), Little Sand Valley Creek (H), Little Wills Creek (I). Display/hide their locations on the map
In group quarters: 229 (-1 institutionalized population)
Size of family households: 517 2-persons, 461 3-persons, 325 4-persons, 227 5-persons, 20 6-persons, 45 7-or-more-persons
Size of nonfamily households: 459 1-person, 61 2-persons, 17 3-persons
956 married couples with children.
499 single-parent households (88 men, 411 women).
74.0% of residents of 35961 zip code speak English at home.
25.3% of residents speak Spanish at home (55% very well, 8% well, 30% not well, 7% not at all).
0.1% of residents speak other language at home (57% well, 43% not well).
Foreign born population: 1,023 (16.2%) (4.0% of them are naturalized citizens)
This zip code:
16.2%
Whole state:
3.8%
56%Honduras
43%El Salvador
1%Sweden
1%United Kingdom, excluding England and Scotland
1%Costa Rica
18%American
9%Irish
8%English
4%German
3%Scottish
2%Scotch-Irish
1%Russian
Year of entry for the foreign-born population
2722010 or later
2752000 to 2009
4411990 to 1999
92Before 1990
Facilities with environmental interests located in this zip code:
CAGLES INCORPORATED (764 GEORGE CAGLE DRIVE in COLLINSVILLE, AL)
AIR MINOR (AIRS/AFS) CRITERIA AND HAZARDOUS AIR POLLUTANT INVENTORY (Inventory of air pollution sources) National Pollutant Discharge Elimination System NON-MAJOR (Tracking pollutant discharge elimination systems) - permit TRI REPORTER (Tracking of toxic chemicals releasing facilities) - ICIS-04-2004-2039, FORMAL ENFORCEMENT ACTION Business SIC classification: POULTRY SLAUGHTERING AND PROCESSING Business NAICS classification: POULTRY PROCESSING. Alternative names: CAGLES COLLINSVILLE
MILLER POULTRY FARM (JOHNNY MILLER in COLLINSVILLE, AL)
National Pollutant Discharge Elimination System NON-MAJOR (Tracking pollutant discharge elimination systems) - permit National Pollutant Discharge Elimination System NON-MAJOR (Tracking pollutant discharge elimination systems) - permit Business SIC classification: NONCLASSIFIABLE ESTABLISHMENTS Organizations: MILLER FARMS (CONTACT/OPERATOR)
Alternative names: MILLER FARMS
BFI (3345 COUNTY ROAD 209 in COLLINSVILLE, AL)
AIR MAJOR (AIRS/AFS) - ICIS-04-2005-1814, ENFORCEMENT/COMPLIANCE ACTIVITY CRITERIA AND HAZARDOUS AIR POLLUTANT INVENTORY (Inventory of air pollution sources) Business SIC classification: REFUSE SYSTEMS
BRENDA WEST FARM (BRENDA WEST in COLLINSVILLE, AL)
National Pollutant Discharge Elimination System NON-MAJOR (Tracking pollutant discharge elimination systems) - permit Business SIC classification: NONCLASSIFIABLE ESTABLISHMENTS
PAYTON FARMS (8612 COUNTY ROAD 51 in COLLINSVILLE, AL)
National Pollutant Discharge Elimination System NON-MAJOR (Tracking pollutant discharge elimination systems) - permit Business SIC classification: POULTRY AND POULTRY PRODUCTS Alternative names: PAYTON FARMS DW POULTRY FAC
BIG VALLEY RESTAURANT PARKING LOT (HIGHWAY 168 AT I-59 in COLLINSVILLE, AL)
(Resource Conservation and Recovery Act (tracking hazardous waste))
Housing units lacking complete plumbing facilities: 4.4% Housing units lacking complete kitchen facilities: 4.5%
65.0%Electricity
20.8%Utility gas
12.2%Bottled, tank, or LP gas
2.0%Wood
Population in 1990: 3,245. Population change in the 1990s: +2,705 (+83.4%).
Place of birth for U.S.-born residents:
This state: 4,182
Northeast: 31
Midwest: 295
South: 644
West: 112
58% of the 35961 zip code residents lived in the same house 5 years ago. Out of people who lived in different houses, 57% lived in this county. Out of people who lived in different counties, 50% lived in Alabama.
93% of the 35961 zip code residents lived in the same house 1 year ago. Out of people who lived in different houses, 38% moved from this county. Out of people who lived in different houses, 21% moved from different county within same state. Out of people who lived in different houses, 1% moved from different state. Out of people who lived in different houses, 40% moved from abroad.
Private vs. public school enrollment:
Students in private schools in grades 1 to 8 (elementary and middle school):
Here:
0.0%
Alabama:
14.7%
Students in private schools in grades 9 to 12 (high school): 82
Here:
17.1%
Alabama:
16.3%
Students in private undergraduate colleges: 12
Here:
5.1%
Alabama:
14.6%
Occupation by median earnings in the past 12 months ($)
235,555Business and financial operations occupations
138,815Transportation occupations
56,607Health diagnosing and treating practitioners and other technical occupations
49,900Material moving occupations
45,931Community and social service occupations
42,101Production occupations
Companies with federal contracts located in this zip code:
JTS CONSTRUCTION CO INC (1721 COUNTY RD 30 in COLLINSVILLE, AL; small business) 10 employees, $585512 revenue. Woman Owned Business
$830,000 with Tennessee Valley Authority for Survey Line Clearing Services. Signed on 2000-03-15. Completion date: 2003-09-15.
Top industries in this zip code by the number of employees in 2005:
Health Care and Social Assistance: Nursing Care Facilities (250-499 employees: 1 establishment)
Accommodation and Food Services: Limited-Service Restaurants (20-49: 1, 1-4: 1)
Mining: Clay and Ceramic and Refractory Minerals Mining (20-49: 1)
Construction: Structural Steel and Precast Concrete Contractors (10-19: 1)
People in group quarters in 2010:
183 people in nursing facilities/skilled-nursing facilities
People in group quarters in 2000:
166 people in nursing homes
Fatal accident statistics in 2014:
Fatal accident count: 3
Vehicles involved in fatal accidents: 6
Fatal accidents caused by drunken drivers: 2
Fatalities: 4
Persons involved in fatal accidents: 7
Pedestrians involved in fatal accidents: 0
Fatal accident statistics in 2013:
Fatal accident count: 3
Vehicles involved in fatal accidents: 4
Fatal accidents caused by drunken drivers: 2
Fatalities: 3
Persons involved in fatal accidents: 5
Pedestrians involved in fatal accidents: 0
Home Mortgage Disclosure Act Aggregated Statistics For Year 2009 (Based on 1 partial tract)
A) FHA, FSA/RHS & VA Home Purchase Loans
B) Conventional Home Purchase Loans
C) Refinancings
D) Home Improvement Loans
F) Non-occupant Loans on < 5 Family Dwellings (A B C & D)
G) Loans On Manufactured Home Dwelling (A B C & D)
Number
Average Value
Number
Average Value
Number
Average Value
Number
Average Value
Number
Average Value
Number
Average Value
LOANS ORIGINATED
2
$48,040
0
$0
8
$105,820
1
$13,180
1
$18,120
1
$26,540
APPLICATIONS APPROVED, NOT ACCEPTED
0
$0
0
$0
1
$72,650
0
$0
0
$0
0
$0
APPLICATIONS DENIED
0
$0
2
$40,350
5
$89,230
1
$47,210
0
$0
1
$60,390
APPLICATIONS WITHDRAWN
0
$0
1
$73,020
2
$123,985
0
$0
0
$0
0
$0
FILES CLOSED FOR INCOMPLETENESS
0
$0
0
$0
1
$44,470
0
$0
0
$0
0
$0
Aggregated Statistics For Year 2008 (Based on 1 partial tract)
A) FHA, FSA/RHS & VA Home Purchase Loans
B) Conventional Home Purchase Loans
C) Refinancings
D) Home Improvement Loans
F) Non-occupant Loans on < 5 Family Dwellings (A B C & D)
G) Loans On Manufactured Home Dwelling (A B C & D)
Number
Average Value
Number
Average Value
Number
Average Value
Number
Average Value
Number
Average Value
Number
Average Value
LOANS ORIGINATED
0
$0
2
$57,370
5
$91,902
2
$26,535
1
$27,080
2
$54,625
APPLICATIONS APPROVED, NOT ACCEPTED
0
$0
1
$36,780
1
$106,870
0
$0
0
$0
1
$54,530
APPLICATIONS DENIED
1
$50,140
1
$51,790
5
$81,618
2
$48,770
0
$0
1
$45,930
APPLICATIONS WITHDRAWN
0
$0
0
$0
2
$99,095
0
$0
0
$0
0
$0
FILES CLOSED FOR INCOMPLETENESS
0
$0
0
$0
0
$0
0
$0
0
$0
0
$0
Aggregated Statistics For Year 2007 (Based on 1 partial tract)
A) FHA, FSA/RHS & VA Home Purchase Loans
B) Conventional Home Purchase Loans
C) Refinancings
D) Home Improvement Loans
F) Non-occupant Loans on < 5 Family Dwellings (A B C & D)
G) Loans On Manufactured Home Dwelling (A B C & D)
Number
Average Value
Number
Average Value
Number
Average Value
Number
Average Value
Number
Average Value
Number
Average Value
LOANS ORIGINATED
1
$49,410
3
$76,067
5
$73,382
2
$44,010
1
$13,540
2
$42,545
APPLICATIONS APPROVED, NOT ACCEPTED
0
$0
1
$79,420
1
$106,510
0
$0
0
$0
1
$98,090
APPLICATIONS DENIED
0
$0
3
$40,503
7
$94,873
3
$51,790
0
$0
3
$41,603
APPLICATIONS WITHDRAWN
0
$0
1
$58,560
2
$101,290
0
$0
0
$0
0
$0
FILES CLOSED FOR INCOMPLETENESS
0
$0
0
$0
1
$91,870
0
$0
0
$0
0
$0
Aggregated Statistics For Year 2006 (Based on 1 partial tract)
B) Conventional Home Purchase Loans
C) Refinancings
D) Home Improvement Loans
F) Non-occupant Loans on < 5 Family Dwellings (A B C & D)
G) Loans On Manufactured Home Dwelling (A B C & D)
Number
Average Value
Number
Average Value
Number
Average Value
Number
Average Value
Number
Average Value
LOANS ORIGINATED
5
$75,688
6
$81,008
1
$41,360
1
$46,480
2
$59,750
APPLICATIONS APPROVED, NOT ACCEPTED
1
$65,330
1
$80,890
0
$0
0
$0
1
$77,590
APPLICATIONS DENIED
3
$58,437
5
$107,164
0
$0
0
$0
2
$52,795
APPLICATIONS WITHDRAWN
0
$0
3
$88,083
0
$0
0
$0
0
$0
FILES CLOSED FOR INCOMPLETENESS
0
$0
1
$79,060
0
$0
0
$0
0
$0
Aggregated Statistics For Year 2005 (Based on 1 partial tract)
B) Conventional Home Purchase Loans
C) Refinancings
D) Home Improvement Loans
G) Loans On Manufactured Home Dwelling (A B C & D)
Number
Average Value
Number
Average Value
Number
Average Value
Number
Average Value
LOANS ORIGINATED
5
$81,068
5
$106,798
2
$24,890
3
$32,513
APPLICATIONS APPROVED, NOT ACCEPTED
1
$57,640
3
$58,987
1
$52,160
1
$36,600
APPLICATIONS DENIED
3
$80,643
4
$102,618
2
$26,625
3
$51,363
APPLICATIONS WITHDRAWN
1
$65,330
2
$143,565
1
$176,780
0
$0
FILES CLOSED FOR INCOMPLETENESS
0
$0
1
$119,320
0
$0
0
$0
Aggregated Statistics For Year 2004 (Based on 1 partial tract)
B) Conventional Home Purchase Loans
C) Refinancings
D) Home Improvement Loans
G) Loans On Manufactured Home Dwelling (A B C & D)
Number
Average Value
Number
Average Value
Number
Average Value
Number
Average Value
LOANS ORIGINATED
5
$64,708
6
$90,067
1
$23,970
1
$21,230
APPLICATIONS APPROVED, NOT ACCEPTED
1
$64,050
2
$62,405
0
$0
1
$22,330
APPLICATIONS DENIED
2
$58,560
5
$63,244
2
$30,925
2
$32,300
APPLICATIONS WITHDRAWN
0
$0
2
$86,195
0
$0
0
$0
FILES CLOSED FOR INCOMPLETENESS
0
$0
2
$76,495
0
$0
0
$0
Aggregated Statistics For Year 2003 (Based on 1 partial tract)
B) Conventional Home Purchase Loans
C) Refinancings
D) Home Improvement Loans
Number
Average Value
Number
Average Value
Number
Average Value
LOANS ORIGINATED
5
$59,768
12
$84,867
1
$51,610
APPLICATIONS APPROVED, NOT ACCEPTED
1
$53,070
2
$60,390
0
$0
APPLICATIONS DENIED
1
$81,070
7
$76,520
0
$0
APPLICATIONS WITHDRAWN
1
$19,580
2
$90,130
0
$0
FILES CLOSED FOR INCOMPLETENESS
0
$0
1
$43,010
0
$0
Aggregated Statistics For Year 2002 (Based on 1 partial tract)
B) Conventional Home Purchase Loans
C) Refinancings
D) Home Improvement Loans
Number
Average Value
Number
Average Value
Number
Average Value
LOANS ORIGINATED
3
$57,827
9
$67,974
1
$21,410
APPLICATIONS APPROVED, NOT ACCEPTED
2
$40,625
2
$54,440
0
$0
APPLICATIONS DENIED
1
$71,190
3
$71,737
0
$0
APPLICATIONS WITHDRAWN
0
$0
1
$61,670
0
$0
FILES CLOSED FOR INCOMPLETENESS
0
$0
1
$72,830
0
$0
Aggregated Statistics For Year 2001 (Based on 1 partial tract)
B) Conventional Home Purchase Loans
C) Refinancings
D) Home Improvement Loans
Number
Average Value
Number
Average Value
Number
Average Value
LOANS ORIGINATED
2
$64,965
8
$68,282
0
$0
APPLICATIONS APPROVED, NOT ACCEPTED
1
$40,990
1
$62,040
0
$0
APPLICATIONS DENIED
3
$58,073
3
$56,243
1
$10,250
APPLICATIONS WITHDRAWN
0
$0
0
$0
0
$0
FILES CLOSED FOR INCOMPLETENESS
0
$0
1
$22,330
0
$0
Aggregated Statistics For Year 2000 (Based on 1 partial tract)
A) FHA, FSA/RHS & VA Home Purchase Loans
B) Conventional Home Purchase Loans
C) Refinancings
Number
Average Value
Number
Average Value
Number
Average Value
LOANS ORIGINATED
1
$36,050
4
$49,730
3
$54,047
APPLICATIONS APPROVED, NOT ACCEPTED
0
$0
1
$63,130
1
$53,620
APPLICATIONS DENIED
0
$0
5
$29,060
3
$46,970
APPLICATIONS WITHDRAWN
0
$0
1
$42,460
1
$38,980
FILES CLOSED FOR INCOMPLETENESS
0
$0
0
$0
0
$0
Aggregated Statistics For Year 1999 (Based on 1 partial tract)
Detailed PMIC statistics for the following Tracts:0108.00
2004 - 2018 National Fire Incident Reporting System (NFIRS) incidents
Based on the data from the years 2004 - 2018 the average number of fires per year is 10. The highest number of reported fires - 55 took place in 2010, and the least - 0 in 2005. The data has a growing trend.
When looking into fire subcategories, the most reports belonged to: Outside Fires (43.0%), and Structure Fires (40.4%).
Fire incident types reported to NFIRS in Zip Code 35961


 Nearest zip codes: 35963, 35983, 35974, 35971, 35967, 35962.


 Based on the data from the years 2004 - 2018 the average number of fires per year is 10. The highest number of reported fires - 55 took place in 2010, and the least - 0 in 2005. The data has a growing trend.
 When looking into fire subcategories, the most reports belonged to: Outside Fires (43.0%), and Structure Fires (40.4%).