Estimated zip code population in 2022: 1,304 Zip code population in 2010: 1,139 Zip code population in 2000: 885
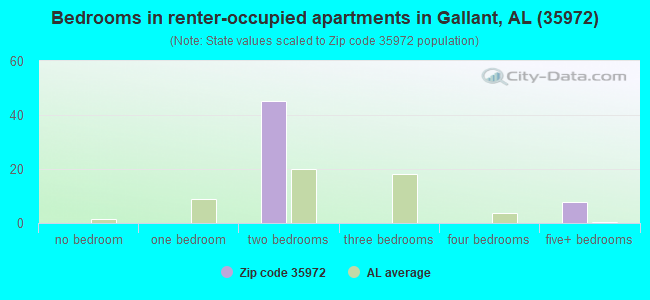
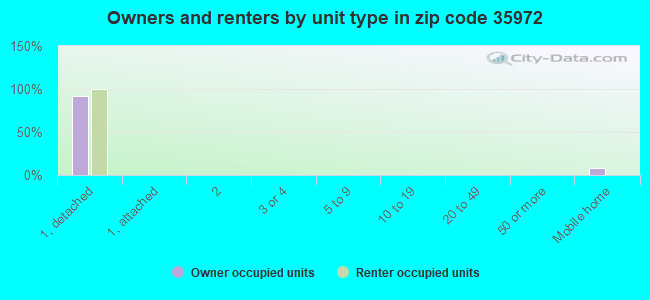
Houses and condos: 703 Renter-occupied apartments: 53
% of renters here:
9%
State:
30%
March 2022 cost of living index in zip code 35972: 80.2 (low, U.S. average is 100)
Land area: 24.4 sq. mi. Water area: 0.1 sq. mi.
Population density: 53 people per square mile
(very low).
OSM Map
General Map
Google Map
MSN Map
OSM Map
General Map
Google Map
MSN Map
OSM Map
General Map
Google Map
MSN Map
OSM Map
General Map
Google Map
MSN Map
Please wait while loading the map...
Real estate property taxes paid for housing units in 2022:
This zip code:
0.5% ($508)
Alabama:
0.4% ($718)
Median real estate property taxes paid for housing units with mortgages in 2022: $689 (0.4%) Median real estate property taxes paid for housing units with no mortgage in 2022: $466 (0.5%)
Business Search- 14 Million verified businesses
Males: 672
(51.5%)
Females: 632
(48.5%)
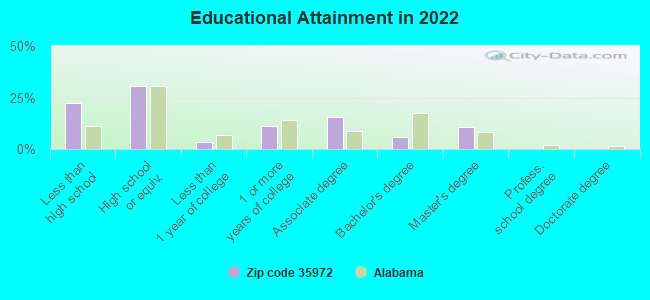
For population 25 years and over in 35972:
High school or higher: 76.5%
Bachelor's degree or higher: 16.2%
Graduate or professional degree: 10.4%
Unemployed: 2.6%
Mean travel time to work (commute): 28.2 minutes
For population 15 years and over in 35972:
Never married: 23.1%
Now married: 52.9%
Separated: 0.0%
Widowed: 21.2%
Divorced: 2.8%
Zip code 35972 compared to state average:
Median household income significantly below state average.
Median house value below state average.
Black race population percentage significantly below state average.
Hispanic race population percentage significantly below state average.
Median age above state average.
Foreign-born population percentage significantly below state average.
Renting percentage significantly below state average.
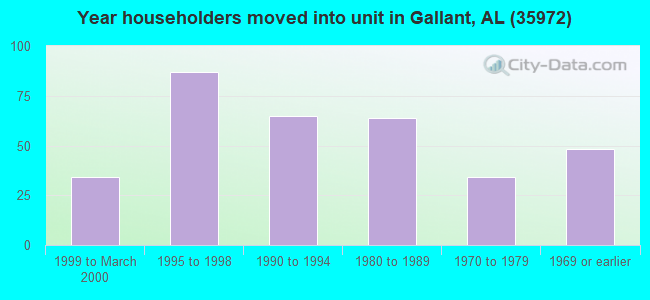
Length of stay since moving in significantly above state average.
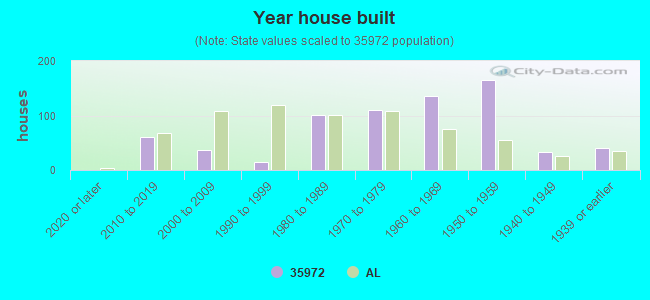
House age above state average.
Percentage of population with a bachelor's degree or higher below state average.
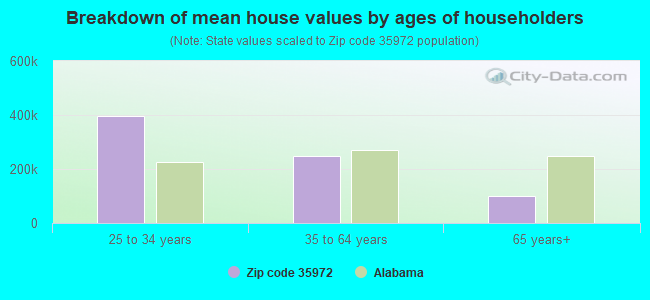
Estimated median house/condo value in 2022: $99,106
35972:
$99,106
Alabama:
$200,900
According to our research of Alabama and other state lists, there were 3 registered sex offenders living in 35972 zip code as of May 28, 2024. The ratio of all residents to sex offenders in zip code 35972 is 435 to 1. The ratio of registered sex offenders to all residents in this zip code is near the state average.
Median resident age:
This zip code:
44.6 years
Alabama median age:
39.6 years
Average household size:
This zip code:
2.3 people
Alabama:
2.5 people
Averages for the 2020 tax year for zip code 35972, filed in 2021:
Average Adjusted Gross Income (AGI) in 2020: $54,491 (Individual Income Tax Returns)
Here:
$54,491
State:
$63,984
Salary/wage: $50,710 (reported on 75.5% of returns)
Here:
$50,710
State:
$52,834
(% of AGI for various income ranges: 1073.3% for AGIs below $25k, 3454.5% for AGIs $25k-50k, 6674.0% for AGIs $50k-75k, 7270.0% for AGIs $75k-100k, 17902.0% for AGIs $100k-200k)
Taxable interest for individuals: $627 (reported on 28.3% of returns)
This zip code:
$627
Alabama:
$1,615
(% of AGI for various income ranges: 30.0% for AGIs below $25k, 18.2% for AGIs $25k-50k, 46.0% for AGIs $50k-75k, 10.0% for AGIs $75k-100k, 22.0% for AGIs $100k-200k)
Ordinary dividends: $650 (reported on 7.5% of returns)
Here:
$650
State:
$7,660
(% of AGI for various income ranges: 11.7% for AGIs below $25k, 30.0% for AGIs $75k-100k)
Net capital gain/loss in AGI: +$3,025 (reported on 7.5% of returns)
Here:
+$3,025
State:
+$23,528
(% of AGI for various income ranges: 242.0% for AGIs $50k-75k)
Profit/loss from business: +$11,862 (reported on 15.1% of returns)
Here:
+$11,862
State:
+$9,534
(% of AGI for various income ranges: 160.8% for AGIs below $25k, 337.3% for AGIs $25k-50k, 962.5% for AGIs $75k-100k)
Taxable individual retirement arrangement distribution: $14,340 (reported on 9.4% of returns)
35972:
$14,340
Alabama:
$19,004
(% of AGI for various income ranges: 145.8% for AGIs below $25k, 1084.0% for AGIs $50k-75k)
Earned income credit: $2,322 (reported on 17.0% of returns)
Here:
$2,322
State:
$2,628
(% of AGI for various income ranges: 115.0% for AGIs below $25k, 64.5% for AGIs $25k-50k)
Percentage of individuals using paid preparers for their 2020 taxes: 90.6%
Here:
91%
State:
93%
(% for various income ranges: 88.9% for AGIs below $25k, 100.0% for AGIs $25k-50k, 87.5% for AGIs $50k-75k, 80.0% for AGIs $75k-100k, 87.5% for AGIs $100k-200k)
Averages for the 2012 tax year for zip code 35972, filed in 2013:
Average Adjusted Gross Income (AGI) in 2012: $43,282 (Individual Income Tax Returns)
Here:
$43,282
State:
$52,001
Salary/wage: $39,997 (reported on 80.0% of returns)
Here:
$39,997
State:
$43,822
(% of AGI for various income ranges: 65.4% for AGIs below $25k, 74.3% for AGIs $25k-50k, 83.9% for AGIs $50k-75k, 82.4% for AGIs $75k-100k, 60.1% for AGIs $100k-200k)
Taxable interest for individuals: $900 (reported on 31.1% of returns)
This zip code:
$900
Alabama:
$1,592
(% of AGI for various income ranges: 2.2% for AGIs below $25k, 0.8% for AGIs $25k-50k, 0.4% for AGIs $50k-75k, 0.4% for AGIs $75k-100k)
Ordinary dividends: $1,400 (reported on 8.9% of returns)
Here:
$1,400
State:
$5,697
Net capital gain/loss in AGI: +$4,450 (reported on 4.4% of returns)
Here:
+$4,450
State:
+$13,286
Profit/loss from business: +$4,388 (reported on 17.8% of returns)
Here:
+$4,388
State:
+$9,151
Taxable individual retirement arrangement distribution: $12,225 (reported on 8.9% of returns)
35972:
$12,225
Alabama:
$14,992
Total itemized deductions: $17,230 (22% of AGI, reported on 22.2% of returns)
Here:
$17,230
State:
$21,388
Here:
21.9% of AGI
State:
20.1% of AGI
(% of AGI for various income ranges: 9.7% for AGIs $25k-50k, 17.7% for AGIs $50k-75k, 11.4% for AGIs $100k-200k)
Charity contributions: $4,222 (reported on 20.0% of returns)
Here:
$4,222
State:
$5,925
(% of AGI for various income ranges: 3.6% for AGIs below $25k, 3.4% for AGIs $50k-75k, 3.2% for AGIs $100k-200k)
Taxes paid: $3,564 (reported on 24.4% of returns)
35972:
$3,564
State:
$5,272
(% of AGI for various income ranges: 1.3% for AGIs $25k-50k, 3.9% for AGIs $50k-75k, 3.6% for AGIs $100k-200k)
Earned income credit: $2,340 (reported on 22.2% of returns)
Here:
$2,340
State:
$2,646
(% of AGI for various income ranges: 7.0% for AGIs below $25k, 1.3% for AGIs $25k-50k)
Percentage of individuals using paid preparers for their 2012 taxes: 71.1%
Here:
71%
State:
60%
(% for various income ranges: 68.4% for AGIs below $25k, 75.0% for AGIs $25k-50k, 71.4% for AGIs $50k-75k, 75.0% for AGIs $75k-100k, 66.7% for AGIs $100k-200k)
Averages for the 2004 tax year for zip code 35972, filed in 2005:
Average Adjusted Gross Income (AGI) in 2004: $36,122 (Individual Income Tax Returns)
Here:
$36,122
State:
$42,302
Salary/wage: $34,336 (reported on 82.8% of returns)
Here:
$34,336
State:
$36,626
(% of AGI for various income ranges: 96.1% for AGIs below $10k, 67.0% for AGIs $10k-25k, 82.9% for AGIs $25k-50k, 85.9% for AGIs $50k-75k, 96.1% for AGIs $75k-100k, 43.9% for AGIs over 100k)
Taxable interest for individuals: $1,159 (reported on 47.6% of returns)
This zip code:
$1,159
Alabama:
$1,827
(% of AGI for various income ranges: 15.1% for AGIs below $10k, 4.5% for AGIs $10k-25k, 0.9% for AGIs $25k-50k, 0.8% for AGIs $50k-75k, 0.3% for AGIs $75k-100k, 1.0% for AGIs over 100k)
Taxable dividends: $308 (reported on 9.0% of returns)
Here:
$308
State:
$4,206
Net capital gain/loss: +$3,296 (reported on 6.2% of returns)
Here:
+$3,296
State:
+$13,031
Profit/loss from business: +$2,605 (reported on 18.6% of returns)
Here:
+$2,605
State:
+$8,302
(% of AGI for various income ranges: 2.6% for AGIs below $10k, 7.3% for AGIs $10k-25k, 1.4% for AGIs $25k-50k, -0.2% for AGIs $50k-75k)
Total itemized deductions: $15,686 (26% of AGI, reported on 27.1% of returns)
Here:
$15,686
State:
$17,623
Here:
26.4% of AGI
State:
20.8% of AGI
(% of AGI for various income ranges: 8.7% for AGIs $10k-25k, 12.0% for AGIs $25k-50k, 15.5% for AGIs $50k-75k, 10.8% for AGIs $75k-100k, 10.5% for AGIs over 100k)
Charity contributions deductions: $4,085 (7% of AGI, reported on 24.4% of returns)
Here:
$4,085
State:
$4,768
Here:
6.7% of AGI
State:
5.4% of AGI
(% of AGI for various income ranges: 15.8% for AGIs below $10k, 2.2% for AGIs $25k-50k, 3.6% for AGIs $50k-75k, 2.2% for AGIs $75k-100k, 4.0% for AGIs over 100k)
Total tax: $4,022 (reported on 73.8% of returns)
35972:
$4,022
State:
$6,905
(% of AGI for various income ranges: 5.8% for AGIs below $10k, 3.8% for AGIs $10k-25k, 5.7% for AGIs $25k-50k, 7.5% for AGIs $50k-75k, 10.7% for AGIs $75k-100k, 16.1% for AGIs over 100k)
Earned income credit: $2,081 (reported on 19.8% of returns)
Here:
$2,081
State:
$2,048
Percentage of individuals using paid preparers for their 2004 taxes: 70.1%
Here:
70%
State:
65%
(% for various income ranges: 61.0% for AGIs below $10k, 68.3% for AGIs $10k-25k, 73.4% for AGIs $25k-50k, 71.9% for AGIs $50k-75k, 75.0% for AGIs $75k-100k, 85.7% for AGIs over 100k)
Household received Food Stamps/SNAP in the past 12 months: 52 Household did not receive Food Stamps/SNAP in the past 12 months: 509
Women who did not have a birth in the past 12 months: 224 (97 now married, 126 unmarried)
Housing units in zip code 35972 with a mortgage: 130 (10 second mortgage, 11 both second mortgage and home equity loan) Median monthly owner costs for units with a mortgage: $1,265 Median monthly owner costs for units without a mortgage: $346
Residents with income below the poverty level in 2022:
This zip code:
17.5%
Whole state:
16.2%
Residents with income below 50% of the poverty level in 2022:
This zip code:
8.1%
Whole state:
8.6%
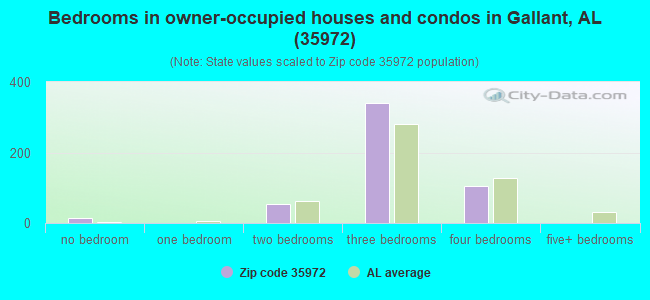
Median number of rooms in houses and condos:
Here:
5.9
State:
6.5
Median number of rooms in apartments:
Here:
5.9
State:
4.7
Notable locations in this zip code not listed on our city pages
Notable locations in zip code 35972: Brasher Spring Camp (A), Gallant Volunteer Fire Department (B), Gallant Volunteer Fire Department Greasey Cove Station (C). Display/hide their locations on the map
Churches in zip code 35972 include: Bethlehem Primitive Baptist Church (A), Sweet Home Church (B), Pleasant Valley Church (C), Gallant Road Independent Baptist Church (D), Gallant Missionary Baptist Church (E), Clear Creek Methodist Church (F), Bethlehem Independent Baptist Church (G). Display/hide their locations on the map
Size of family households: 156 2-persons, 55 3-persons, 66 4-persons, 35 5-persons, 21 6-persons
Size of nonfamily households: 225 1-person
267 married couples with children.
53 single-parent households (53 women).
100.2% of residents of 35972 zip code speak English at home.
Foreign born population: 0 (0.0%)
:
0.0%
Whole state:
3.8%
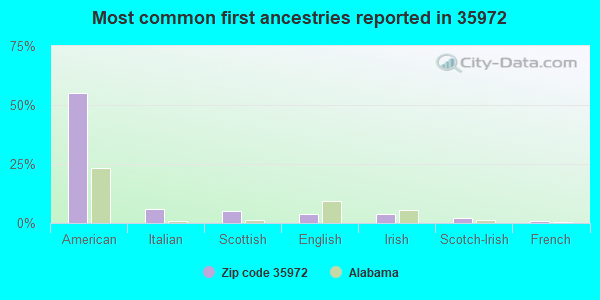
55%American
6%Italian
5%Scottish
4%English
4%Irish
2%Scotch-Irish
1%French
Facilities with environmental interests located in this zip code:
CAMP SUMATAMGA WWTP (CAMP AND ASSEMBLY COMMISSION in GALLANT, AL)
National Pollutant Discharge Elimination System NON-MAJOR (Tracking pollutant discharge elimination systems) - permit Business SIC classification: SPORTING AND RECREATIONAL CAMPS Organizations: CAMP SUMATANGA WWTP (CONTACT/OPERATOR)
Alternative names: CAMP AND ASSEMBLY COMMISSION, CAMP AND ASSEMBLY SUMATANGA
Housing units lacking complete plumbing facilities: 14.0% Housing units lacking complete kitchen facilities: 13.2%
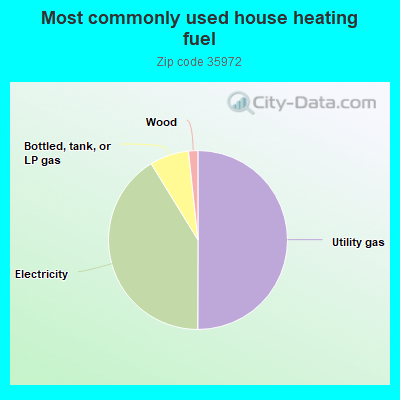
50.3%Utility gas
41.4%Electricity
7.1%Bottled, tank, or LP gas
1.7%Wood
Population in 1990: 337. Population change in the 1990s: +548 (+162.6%).
Place of birth for U.S.-born residents:
This state: 1,016
Midwest: 56
South: 214
West: 11
63% of the 35972 zip code residents lived in the same house 5 years ago. Out of people who lived in different houses, 50% lived in this county. Out of people who lived in different counties, 50% lived in Alabama.
92% of the 35972 zip code residents lived in the same house 1 year ago. Out of people who lived in different houses, 90% moved from this county.
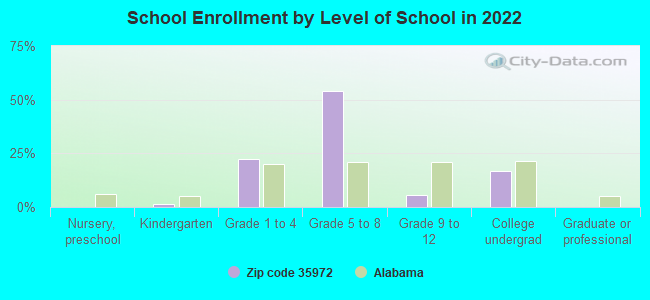
Private vs. public school enrollment:
Students in private schools in grades 1 to 8 (elementary and middle school): 64
Here:
29.6%
Alabama:
14.7%
Students in private schools in grades 9 to 12 (high school):
Here:
0.0%
Alabama:
16.3%
Students in private undergraduate colleges:
Here:
0.0%
Alabama:
14.6%
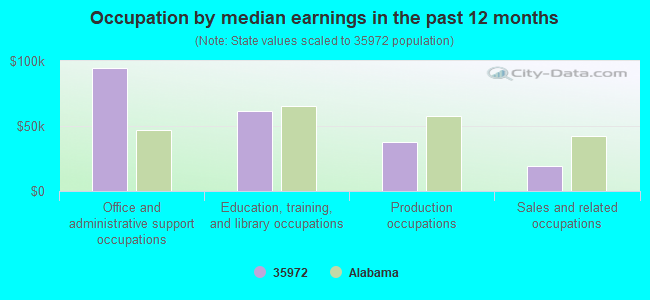
Occupation by median earnings in the past 12 months ($)
94,477Office and administrative support occupations
61,870Education, training, and library occupations
37,361Production occupations
19,378Sales and related occupations
Top industries in this zip code by the number of employees in 2005:
Other Services (except Public Administration): Religious Organizations (20-49 employees: 1 establishment, 1-4 employees: 1 establishment)
Finance and Insurance: Commercial Banking (1-4: 1)
Wholesale Trade: Other Grocery and Related Products Merchant Wholesalers (1-4: 1)
Fatal accident statistics in 2012:
Fatal accident count: 1
Vehicles involved in fatal accidents: 1
Fatal accidents caused by drunken drivers: 0
Fatalities: 1
Persons involved in fatal accidents: 1
Pedestrians involved in fatal accidents: 0
Fatal accident statistics in 2010:
Fatal accident count: 1
Vehicles involved in fatal accidents: 1
Fatal accidents caused by drunken drivers: 1
Fatalities: 1
Persons involved in fatal accidents: 2
Pedestrians involved in fatal accidents: 0
Home Mortgage Disclosure Act Aggregated Statistics For Year 2009 (Based on 1 partial tract)
A) FHA, FSA/RHS & VA Home Purchase Loans
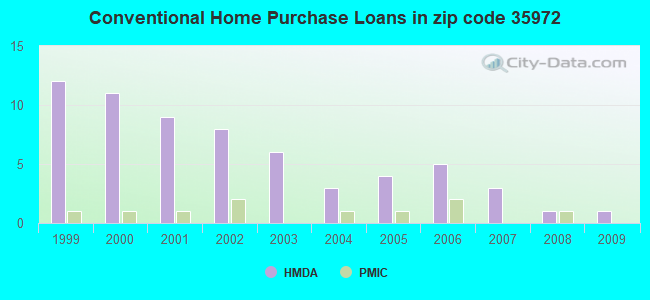
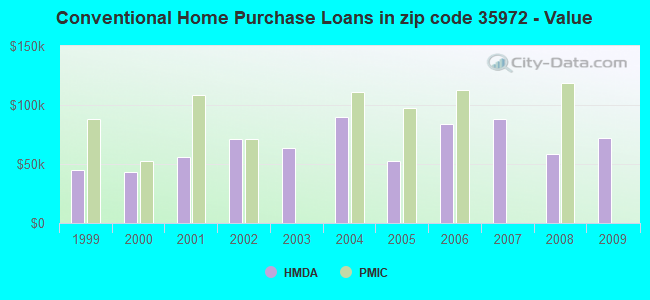
B) Conventional Home Purchase Loans
C) Refinancings
D) Home Improvement Loans
F) Non-occupant Loans on < 5 Family Dwellings (A B C & D)
G) Loans On Manufactured Home Dwelling (A B C & D)
Number
Average Value
Number
Average Value
Number
Average Value
Number
Average Value
Number
Average Value
Number
Average Value
LOANS ORIGINATED
1
$111,590
1
$71,770
8
$105,818
0
$0
1
$57,760
1
$34,170
APPLICATIONS APPROVED, NOT ACCEPTED
0
$0
0
$0
1
$72,510
0
$0
0
$0
0
$0
APPLICATIONS DENIED
0
$0
1
$96,350
3
$87,260
2
$50,635
0
$0
1
$36,870
APPLICATIONS WITHDRAWN
0
$0
0
$0
2
$261,160
0
$0
0
$0
0
$0
FILES CLOSED FOR INCOMPLETENESS
0
$0
0
$0
1
$53,340
0
$0
0
$0
0
$0
Aggregated Statistics For Year 2008 (Based on 1 partial tract)
B) Conventional Home Purchase Loans
C) Refinancings
D) Home Improvement Loans
F) Non-occupant Loans on < 5 Family Dwellings (A B C & D)
G) Loans On Manufactured Home Dwelling (A B C & D)
Number
Average Value
Number
Average Value
Number
Average Value
Number
Average Value
Number
Average Value
LOANS ORIGINATED
1
$58,250
7
$89,084
1
$50,390
1
$29,500
1
$38,100
APPLICATIONS APPROVED, NOT ACCEPTED
0
$0
0
$0
0
$0
0
$0
0
$0
APPLICATIONS DENIED
1
$66,860
5
$99,550
1
$25,070
0
$0
1
$43,510
APPLICATIONS WITHDRAWN
0
$0
1
$171,810
0
$0
0
$0
0
$0
FILES CLOSED FOR INCOMPLETENESS
0
$0
1
$144,780
0
$0
0
$0
0
$0
Aggregated Statistics For Year 2007 (Based on 1 partial tract)
B) Conventional Home Purchase Loans
C) Refinancings
D) Home Improvement Loans
F) Non-occupant Loans on < 5 Family Dwellings (A B C & D)
G) Loans On Manufactured Home Dwelling (A B C & D)
Number
Average Value
Number
Average Value
Number
Average Value
Number
Average Value
Number
Average Value
LOANS ORIGINATED
3
$88,160
7
$118,370
3
$27,610
2
$38,960
1
$63,170
APPLICATIONS APPROVED, NOT ACCEPTED
1
$48,420
1
$72,270
0
$0
0
$0
1
$40,800
APPLICATIONS DENIED
1
$82,590
5
$151,068
1
$43,750
0
$0
1
$47,690
APPLICATIONS WITHDRAWN
1
$31,950
2
$124,865
0
$0
0
$0
1
$33,670
FILES CLOSED FOR INCOMPLETENESS
0
$0
1
$163,460
0
$0
0
$0
0
$0
Aggregated Statistics For Year 2006 (Based on 1 partial tract)
B) Conventional Home Purchase Loans
C) Refinancings
D) Home Improvement Loans
F) Non-occupant Loans on < 5 Family Dwellings (A B C & D)
G) Loans On Manufactured Home Dwelling (A B C & D)
Number
Average Value
Number
Average Value
Number
Average Value
Number
Average Value
Number
Average Value
LOANS ORIGINATED
5
$84,212
9
$77,782
2
$20,155
1
$53,340
0
$0
APPLICATIONS APPROVED, NOT ACCEPTED
3
$56,453
2
$78,410
0
$0
0
$0
2
$61,205
APPLICATIONS DENIED
5
$48,030
7
$85,994
2
$57,885
0
$0
4
$40,742
APPLICATIONS WITHDRAWN
0
$0
3
$82,833
1
$29,990
0
$0
0
$0
FILES CLOSED FOR INCOMPLETENESS
0
$0
1
$105,940
0
$0
0
$0
0
$0
Aggregated Statistics For Year 2005 (Based on 1 partial tract)
B) Conventional Home Purchase Loans
C) Refinancings
D) Home Improvement Loans
F) Non-occupant Loans on < 5 Family Dwellings (A B C & D)
G) Loans On Manufactured Home Dwelling (A B C & D)
Number
Average Value
Number
Average Value
Number
Average Value
Number
Average Value
Number
Average Value
LOANS ORIGINATED
4
$52,848
11
$95,437
0
$0
1
$40,800
1
$53,580
APPLICATIONS APPROVED, NOT ACCEPTED
1
$59,730
2
$45,965
1
$47,690
1
$50,630
1
$48,180
APPLICATIONS DENIED
3
$71,527
6
$79,967
1
$24,090
0
$0
2
$67,595
APPLICATIONS WITHDRAWN
0
$0
2
$113,560
0
$0
0
$0
0
$0
FILES CLOSED FOR INCOMPLETENESS
0
$0
0
$0
0
$0
0
$0
0
$0
Aggregated Statistics For Year 2004 (Based on 1 partial tract)
B) Conventional Home Purchase Loans
C) Refinancings
D) Home Improvement Loans
F) Non-occupant Loans on < 5 Family Dwellings (A B C & D)
G) Loans On Manufactured Home Dwelling (A B C & D)
Number
Average Value
Number
Average Value
Number
Average Value
Number
Average Value
Number
Average Value
LOANS ORIGINATED
3
$89,963
8
$81,636
1
$52,600
2
$54,570
1
$48,420
APPLICATIONS APPROVED, NOT ACCEPTED
2
$59,115
3
$80,540
0
$0
0
$0
1
$56,530
APPLICATIONS DENIED
4
$43,938
8
$80,622
2
$49,530
0
$0
5
$48,914
APPLICATIONS WITHDRAWN
0
$0
2
$99,305
0
$0
0
$0
0
$0
FILES CLOSED FOR INCOMPLETENESS
0
$0
2
$78,780
0
$0
0
$0
0
$0
Aggregated Statistics For Year 2003 (Based on 1 partial tract)
B) Conventional Home Purchase Loans
C) Refinancings
D) Home Improvement Loans
F) Non-occupant Loans on < 5 Family Dwellings (A B C & D)
Number
Average Value
Number
Average Value
Number
Average Value
Number
Average Value
LOANS ORIGINATED
6
$63,375
15
$78,165
2
$27,160
1
$27,530
APPLICATIONS APPROVED, NOT ACCEPTED
1
$43,510
3
$74,230
0
$0
0
$0
APPLICATIONS DENIED
3
$36,050
7
$68,649
1
$57,030
0
$0
APPLICATIONS WITHDRAWN
0
$0
3
$72,593
0
$0
0
$0
FILES CLOSED FOR INCOMPLETENESS
0
$0
0
$0
0
$0
0
$0
Aggregated Statistics For Year 2002 (Based on 1 partial tract)
B) Conventional Home Purchase Loans
C) Refinancings
D) Home Improvement Loans
F) Non-occupant Loans on < 5 Family Dwellings (A B C & D)
Number
Average Value
Number
Average Value
Number
Average Value
Number
Average Value
LOANS ORIGINATED
8
$70,851
15
$80,508
2
$25,070
1
$110,360
APPLICATIONS APPROVED, NOT ACCEPTED
1
$94,630
4
$61,142
0
$0
0
$0
APPLICATIONS DENIED
3
$36,050
9
$54,759
1
$12,040
0
$0
APPLICATIONS WITHDRAWN
0
$0
1
$90,700
0
$0
0
$0
FILES CLOSED FOR INCOMPLETENESS
0
$0
1
$71,280
0
$0
0
$0
Aggregated Statistics For Year 2001 (Based on 1 partial tract)
B) Conventional Home Purchase Loans
C) Refinancings
D) Home Improvement Loans
F) Non-occupant Loans on < 5 Family Dwellings (A B C & D)
Number
Average Value
Number
Average Value
Number
Average Value
Number
Average Value
LOANS ORIGINATED
9
$55,714
17
$72,800
1
$13,760
2
$42,030
APPLICATIONS APPROVED, NOT ACCEPTED
3
$37,033
3
$61,940
0
$0
0
$0
APPLICATIONS DENIED
8
$33,705
7
$50,986
1
$32,450
1
$43,020
APPLICATIONS WITHDRAWN
0
$0
1
$153,870
0
$0
0
$0
FILES CLOSED FOR INCOMPLETENESS
0
$0
2
$69,440
0
$0
0
$0
Aggregated Statistics For Year 2000 (Based on 1 partial tract)
A) FHA, FSA/RHS & VA Home Purchase Loans
B) Conventional Home Purchase Loans
C) Refinancings
D) Home Improvement Loans
F) Non-occupant Loans on < 5 Family Dwellings (A B C & D)
Number
Average Value
Number
Average Value
Number
Average Value
Number
Average Value
Number
Average Value
LOANS ORIGINATED
1
$46,460
11
$43,105
6
$60,262
3
$23,760
1
$24,580
APPLICATIONS APPROVED, NOT ACCEPTED
0
$0
3
$38,590
2
$65,385
0
$0
0
$0
APPLICATIONS DENIED
0
$0
17
$35,974
6
$50,472
2
$22,120
1
$18,430
APPLICATIONS WITHDRAWN
0
$0
1
$70,300
3
$47,357
0
$0
0
$0
FILES CLOSED FOR INCOMPLETENESS
0
$0
0
$0
0
$0
0
$0
0
$0
Aggregated Statistics For Year 1999 (Based on 1 partial tract)
B) Conventional Home Purchase Loans
C) Refinancings
D) Home Improvement Loans
F) Non-occupant Loans on < 5 Family Dwellings (A B C & D)


 Nearest zip codes: 35987, 35952, 35990, 35906, 35956, 35953.