Estimated zip code population in 2022: 1,926 Zip code population in 2010: 1,313 Zip code population in 2000: 1,153
Houses and condos: 882 Renter-occupied apartments: 56
% of renters here:
7%
State:
30%
March 2022 cost of living index in zip code 36006: 83.7 (less than average, U.S. average is 100)
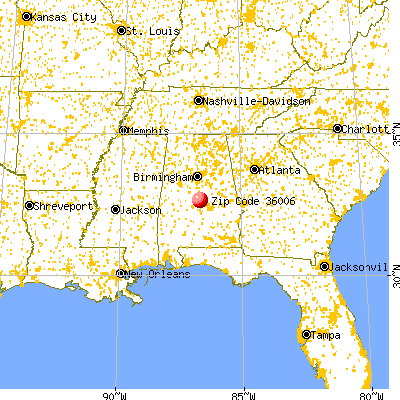
Land area: 71.5 sq. mi. Water area: 0.1 sq. mi.
Population density: 27 people per square mile
(very low).
OSM Map
General Map
Google Map
MSN Map
OSM Map
General Map
Google Map
MSN Map
OSM Map
General Map
Google Map
MSN Map
OSM Map
General Map
Google Map
MSN Map
Please wait while loading the map...
Real estate property taxes paid for housing units in 2022:
This zip code:
0.2% ($496)
Alabama:
0.4% ($718)
Median real estate property taxes paid for housing units with mortgages in 2022: $581 (0.2%) Median real estate property taxes paid for housing units with no mortgage in 2022: $446 (0.3%)
Business Search- 14 Million verified businesses
Males: 891
(46.3%)
Females: 1,035
(53.7%)
For population 25 years and over in 36006:
High school or higher: 92.8%
Bachelor's degree or higher: 8.6%
Graduate or professional degree: 0.1%
Unemployed: 0.6%
Mean travel time to work (commute): 37.2 minutes
For population 15 years and over in 36006:
Never married: 7.4%
Now married: 75.4%
Separated: 1.6%
Widowed: 8.0%
Divorced: 7.6%
Zip code 36006 compared to state average:
Median household income significantly below state average.
Unemployed percentage significantly below state average.
Black race population percentage significantly below state average.
Hispanic race population percentage significantly below state average.
Median age significantly above state average.
Foreign-born population percentage significantly below state average.
Renting percentage significantly below state average.
Length of stay since moving in significantly above state average.
House age significantly below state average.
Number of college students significantly below state average.
Percentage of population with a bachelor's degree or higher significantly below state average.
Estimated median house/condo value in 2022: $217,026
36006:
$217,026
Alabama:
$200,900
According to our research of Alabama and other state lists, there were 2 registered sex offenders living in 36006 zip code as of May 28, 2024. The ratio of all residents to sex offenders in zip code 36006 is 674 to 1. The ratio of registered sex offenders to all residents in this zip code is lower than the state average.
Median resident age:
This zip code:
51.6 years
Alabama median age:
39.6 years
Average household size:
This zip code:
2.4 people
Alabama:
2.5 people
Averages for the 2020 tax year for zip code 36006, filed in 2021:
Average Adjusted Gross Income (AGI) in 2020: $49,195 (Individual Income Tax Returns)
Here:
$49,195
State:
$63,984
Salary/wage: $46,891 (reported on 81.0% of returns)
Here:
$46,891
State:
$52,834
(% of AGI for various income ranges: 1128.7% for AGIs below $25k, 3220.0% for AGIs $25k-50k, 6303.3% for AGIs $50k-75k, 8732.5% for AGIs $75k-100k, 18414.0% for AGIs $100k-200k)
Taxable interest for individuals: $354 (reported on 22.4% of returns)
This zip code:
$354
Alabama:
$1,615
(% of AGI for various income ranges: 8.0% for AGIs below $25k, 7.5% for AGIs $25k-50k, 35.0% for AGIs $75k-100k, 22.0% for AGIs $100k-200k)
Ordinary dividends: $775 (reported on 6.9% of returns)
Here:
$775
State:
$7,660
(% of AGI for various income ranges: 15.3% for AGIs below $25k, 20.0% for AGIs $75k-100k)
Net capital gain/loss in AGI: +$675 (reported on 6.9% of returns)
Here:
+$675
State:
+$23,528
(% of AGI for various income ranges: 22.5% for AGIs $25k-50k)
Profit/loss from business: +$8,767 (reported on 15.5% of returns)
Here:
+$8,767
State:
+$9,534
(% of AGI for various income ranges: 392.0% for AGIs below $25k, 335.0% for AGIs $50k-75k)
Taxable individual retirement arrangement distribution: $9,000 (reported on 6.9% of returns)
36006:
$9,000
Alabama:
$19,004
(% of AGI for various income ranges: 240.0% for AGIs below $25k)
Earned income credit: $2,683 (reported on 20.7% of returns)
Here:
$2,683
State:
$2,628
(% of AGI for various income ranges: 150.0% for AGIs below $25k, 80.8% for AGIs $25k-50k)
Percentage of individuals using paid preparers for their 2020 taxes: 94.8%
Here:
95%
State:
93%
(% for various income ranges: 90.9% for AGIs below $25k, 93.3% for AGIs $25k-50k, 100.0% for AGIs $50k-75k, 100.0% for AGIs $75k-100k, 100.0% for AGIs $100k-200k)
Averages for the 2012 tax year for zip code 36006, filed in 2013:
Average Adjusted Gross Income (AGI) in 2012: $41,336 (Individual Income Tax Returns)
Here:
$41,336
State:
$52,001
Salary/wage: $37,286 (reported on 86.2% of returns)
Here:
$37,286
State:
$43,822
(% of AGI for various income ranges: 77.5% for AGIs below $25k, 78.2% for AGIs $25k-50k, 84.1% for AGIs $50k-75k, 81.1% for AGIs $75k-100k, 63.9% for AGIs $100k-200k)
Taxable interest for individuals: $615 (reported on 22.4% of returns)
This zip code:
$615
Alabama:
$1,592
(% of AGI for various income ranges: 0.6% for AGIs below $25k, 0.1% for AGIs $25k-50k, 0.4% for AGIs $50k-75k, 0.5% for AGIs $75k-100k)
Ordinary dividends: $420 (reported on 8.6% of returns)
Here:
$420
State:
$5,697
Net capital gain/loss in AGI: +$150 (reported on 3.4% of returns)
Here:
+$150
State:
+$13,286
Profit/loss from business: +$6,056 (reported on 15.5% of returns)
Here:
+$6,056
State:
+$9,151
Taxable individual retirement arrangement distribution: $10,025 (reported on 6.9% of returns)
36006:
$10,025
Alabama:
$14,992
Total itemized deductions: $18,369 (24% of AGI, reported on 22.4% of returns)
Here:
$18,369
State:
$21,388
Here:
23.8% of AGI
State:
20.1% of AGI
(% of AGI for various income ranges: 10.4% for AGIs $25k-50k, 10.1% for AGIs $50k-75k, 12.7% for AGIs $75k-100k, 13.4% for AGIs $100k-200k)
Charity contributions: $3,830 (reported on 17.2% of returns)
Here:
$3,830
State:
$5,925
(% of AGI for various income ranges: 1.4% for AGIs $25k-50k, 1.3% for AGIs $50k-75k, 4.3% for AGIs $75k-100k)
Taxes paid: $3,577 (reported on 22.4% of returns)
36006:
$3,577
State:
$5,272
(% of AGI for various income ranges: 1.0% for AGIs $25k-50k, 1.7% for AGIs $50k-75k, 2.6% for AGIs $75k-100k, 4.1% for AGIs $100k-200k)
Earned income credit: $2,612 (reported on 27.6% of returns)
Here:
$2,612
State:
$2,646
(% of AGI for various income ranges: 9.8% for AGIs below $25k, 1.8% for AGIs $25k-50k)
Percentage of individuals using paid preparers for their 2012 taxes: 63.8%
Here:
64%
State:
60%
(% for various income ranges: 62.5% for AGIs below $25k, 62.5% for AGIs $25k-50k, 66.7% for AGIs $50k-75k, 100.0% for AGIs $75k-100k)
Averages for the 2004 tax year for zip code 36006, filed in 2005:
Average Adjusted Gross Income (AGI) in 2004: $34,111 (Individual Income Tax Returns)
Here:
$34,111
State:
$42,302
Salary/wage: $33,334 (reported on 87.2% of returns)
Here:
$33,334
State:
$36,626
(% of AGI for various income ranges: 98.3% for AGIs below $10k, 79.5% for AGIs $10k-25k, 84.3% for AGIs $25k-50k, 88.3% for AGIs $50k-75k, 87.3% for AGIs $75k-100k, 82.6% for AGIs over 100k)
Taxable interest for individuals: $481 (reported on 28.9% of returns)
This zip code:
$481
Alabama:
$1,827
(% of AGI for various income ranges: 3.4% for AGIs below $10k, 1.1% for AGIs $10k-25k, 0.3% for AGIs $25k-50k, 0.2% for AGIs $50k-75k, 0.3% for AGIs $75k-100k, 0.1% for AGIs over 100k)
Taxable dividends: $550 (reported on 11.1% of returns)
Here:
$550
State:
$4,206
(% of AGI for various income ranges: 0.7% for AGIs $10k-25k, 0.2% for AGIs $25k-50k, 0.1% for AGIs $50k-75k, 0.1% for AGIs $75k-100k)
Net capital gain/loss: +$4,312 (reported on 5.9% of returns)
Here:
+$4,312
State:
+$13,031
Profit/loss from business: +$7,418 (reported on 14.7% of returns)
Here:
+$7,418
State:
+$8,302
(% of AGI for various income ranges: 23.5% for AGIs below $10k, 8.5% for AGIs $10k-25k, 4.1% for AGIs $25k-50k, 1.4% for AGIs $50k-75k)
Total itemized deductions: $14,312 (24% of AGI, reported on 20.8% of returns)
Here:
$14,312
State:
$17,623
Here:
23.5% of AGI
State:
20.8% of AGI
(% of AGI for various income ranges: 4.7% for AGIs $10k-25k, 8.0% for AGIs $25k-50k, 10.0% for AGIs $50k-75k, 10.3% for AGIs $75k-100k, 11.8% for AGIs over 100k)
Charity contributions deductions: $3,460 (5% of AGI, reported on 18.6% of returns)
Here:
$3,460
State:
$4,768
Here:
5.5% of AGI
State:
5.4% of AGI
(% of AGI for various income ranges: 1.5% for AGIs $25k-50k, 2.5% for AGIs $50k-75k, 2.7% for AGIs $75k-100k, 2.9% for AGIs over 100k)
Total tax: $3,716 (reported on 70.5% of returns)
36006:
$3,716
State:
$6,905
(% of AGI for various income ranges: 5.4% for AGIs below $10k, 3.4% for AGIs $10k-25k, 6.0% for AGIs $25k-50k, 8.1% for AGIs $50k-75k, 10.3% for AGIs $75k-100k, 13.1% for AGIs over 100k)
Earned income credit: $2,023 (reported on 23.9% of returns)
Here:
$2,023
State:
$2,048
Percentage of individuals using paid preparers for their 2004 taxes: 69.8%
Here:
70%
State:
65%
(% for various income ranges: 57.5% for AGIs below $10k, 69.1% for AGIs $10k-25k, 75.6% for AGIs $25k-50k, 73.0% for AGIs $50k-75k, 61.9% for AGIs $75k-100k, 93.3% for AGIs over 100k)
Household received Food Stamps/SNAP in the past 12 months: 29 Household did not receive Food Stamps/SNAP in the past 12 months: 780
Women who did not have a birth in the past 12 months: 342 (227 now married, 114 unmarried)
Housing units in zip code 36006 with a mortgage: 218 (7 second mortgage, 7 both second mortgage and home equity loan) Median monthly owner costs for units with a mortgage: $1,618 Median monthly owner costs for units without a mortgage: $472
Residents with income below the poverty level in 2022:
This zip code:
22.5%
Whole state:
16.2%
Residents with income below 50% of the poverty level in 2022:
This zip code:
15.0%
Whole state:
8.6%
Median number of rooms in houses and condos:
Here:
6.1
State:
6.5
Median number of rooms in apartments:
Here:
6.6
State:
4.7
Notable locations in this zip code not listed on our city pages
Churches in zip code 36006 include: Mount Zion Church (A), New Cedron Baptist Church (B), Big Springs Baptist Church (C), Unity Church (D), New Mount Zion Church (E), Indian Grave Church (F), Evergreen Baptist Church (G), Bethesda Baptist Church (H). Display/hide their locations on the map
Cemeteries: Bethsalem Cemetery (1), New Cedron Cemetery (2), Billingsley Cemetery (3), Big Springs Cemetery (4), Carter Cemetery (5), Hinton Cemetery (6). Display/hide their locations on the map
Streams, rivers, and creeks: Simmons Branch (A), Indian Creek (B), Hurricane Branch (C), Coon Creek (D), Wheatley Branch (E). Display/hide their locations on the map
Size of family households: 321 2-persons, 247 3-persons, 38 4-persons, 39 5-persons, 10 6-persons
Size of nonfamily households: 150 1-person, 13 2-persons
208 married couples with children.
73 single-parent households (72 men, 1 women).
100.1% of residents of 36006 zip code speak English at home.
Foreign born population: 11 (0.6%) (100.0% of them are naturalized citizens)
This zip code:
0.6%
Whole state:
3.8%
91%Sweden
91%United Kingdom, excluding England and Scotland
47%American
10%European
6%Irish
6%German
3%French
3%English
0%Polish
Year of entry for the foreign-born population
212010 or later
02000 to 2009
01990 to 1999
10Before 1990
Facilities with environmental interests located in this zip code:
BILLINGSLEY HIGH SCHOOL (2446 COUNTY ROAD 77 in BILLINGSLEY, AL)
(Geographic Names Information System) (National Center for Education Statistics) - STATE ID-0040 Organizations: AUTAUGA COUNTY (SCHOOL DISTRICT)
AGC TENASKA II GO01134 (US 82 TO COUNTY ROAD 37 in BILLINGSLEY, AL)
National Pollutant Discharge Elimination System NON-MAJOR (Tracking pollutant discharge elimination systems) - permit Business SIC classification: NATURAL GAS DISTRIBUTION
ALABAMA S AND G PIT 2 (ALABAMA SAND AND GRAVEL INC in BILLINGSLEY, AL)
National Pollutant Discharge Elimination System NON-MAJOR (Tracking pollutant discharge elimination systems) - permit Business SIC classification: CONSTRUCTION SAND AND GRAVEL Alternative names: CASH SAND AND GRAVEL LLC PIT 2
BURNETT PIT (CHILTON COUNTY COMMISSION in BILLINGSLEY, AL)
National Pollutant Discharge Elimination System NON-MAJOR (Tracking pollutant discharge elimination systems) - permit Business SIC classification: NONCLASSIFIABLE ESTABLISHMENTS Alternative names: CHILTON CNTY COMM BURNETT PIT
RAIL AND WASHER FACILITY (ALABAMA SAND AND GRAVEL INC in BILLINGSLEY, AL)
National Pollutant Discharge Elimination System NON-MAJOR (Tracking pollutant discharge elimination systems) - permit Business SIC classification: CONSTRUCTION SAND AND GRAVEL Alternative names: CASH S AND G RAIL AND WASHER
BILLINGSLEY FILTER PLANT (TOWN OF BILLINGSLEY in BILLINGSLEY, AL)
National Pollutant Discharge Elimination System NON-MAJOR (Tracking pollutant discharge elimination systems) - permit Business SIC classification: SEWERAGE SYSTEMS Alternative names: BILLINGSLEY WTP
CENTRAL ALABAMA GENERATING STATION (3301 COUNTY ROAD 26 in BILLINGSLEY, AL)
OIL CONTROL (Facility Response Plan for oil discharge) Organizations: TENASKA ALABAMA (CONTACT/GENERAL)
Alternative names: TENASKA CENTRAL ALABAMA GENERATING STATION
Housing units lacking complete plumbing facilities: 0.5%
67.0%Electricity
31.4%Bottled, tank, or LP gas
1.4%No fuel used
Population in 1990: 1,869.
Place of birth for U.S.-born residents:
This state: 1,639
Midwest: 125
South: 79
West: 33
67% of the 36006 zip code residents lived in the same house 5 years ago. Out of people who lived in different houses, 47% lived in this county. Out of people who lived in different counties, 50% lived in Alabama.
96% of the 36006 zip code residents lived in the same house 1 year ago. Out of people who lived in different houses, 95% moved from this county.
Private vs. public school enrollment:
Students in private schools in grades 1 to 8 (elementary and middle school): 15
Here:
10.0%
Alabama:
14.7%
Students in private schools in grades 9 to 12 (high school):
Here:
0.0%
Alabama:
16.3%
Students in private undergraduate colleges:
Here:
0.0%
Alabama:
14.6%
Occupation by median earnings in the past 12 months ($)
107,334Installation, maintenance, and repair occupations
83,162Health diagnosing and treating practitioners and other technical occupations
46,567Sales and related occupations
45,560Office and administrative support occupations
39,832Management occupations
33,083Production occupations
Top industries in this zip code by the number of employees in 2005:
Professional, Scientific, and Technical Services: All Other Professional, Scientific, and Technical Services (20-49 employees: 1 establishment)
Other Services (except Public Administration): Religious Organizations (5-9: 2, 1-4: 1)
Professional, Scientific, and Technical Services: Other Scientific and Technical Consulting Services (10-19: 1)
Mining: Construction Sand and Gravel Mining (10-19: 1)
Construction: Siding Contractors (1-4: 1)
Administrative and Support and Waste Management and Remediation Services: Facilities Support Services (1-4: 1)
Professional, Scientific, and Technical Services: Process, Physical Distribution, and Logistics Consulting Services (1-4: 1)
Fatal accident statistics in 2014:
Fatal accident count: 1
Vehicles involved in fatal accidents: 1
Fatal accidents caused by drunken drivers: 0
Fatalities: 1
Persons involved in fatal accidents: 1
Pedestrians involved in fatal accidents: 0
Fatal accident statistics in 2011:
Fatal accident count: 1
Vehicles involved in fatal accidents: 2
Fatal accidents caused by drunken drivers: 1
Fatalities: 1
Persons involved in fatal accidents: 2
Pedestrians involved in fatal accidents: 0
Home Mortgage Disclosure Act Aggregated Statistics For Year 2009 (Based on 2 partial tracts)
A) FHA, FSA/RHS & VA Home Purchase Loans
B) Conventional Home Purchase Loans
C) Refinancings
D) Home Improvement Loans
F) Non-occupant Loans on < 5 Family Dwellings (A B C & D)
G) Loans On Manufactured Home Dwelling (A B C & D)
Number
Average Value
Number
Average Value
Number
Average Value
Number
Average Value
Number
Average Value
Number
Average Value
LOANS ORIGINATED
3
$124,713
5
$47,232
17
$119,963
3
$59,893
1
$162,150
6
$45,782
APPLICATIONS APPROVED, NOT ACCEPTED
0
$0
0
$0
1
$111,830
0
$0
0
$0
0
$0
APPLICATIONS DENIED
0
$0
3
$83,023
9
$122,362
3
$24,023
0
$0
4
$36,385
APPLICATIONS WITHDRAWN
0
$0
2
$94,360
6
$131,580
0
$0
0
$0
0
$0
FILES CLOSED FOR INCOMPLETENESS
0
$0
0
$0
2
$97,170
0
$0
0
$0
0
$0
Aggregated Statistics For Year 2008 (Based on 2 partial tracts)
A) FHA, FSA/RHS & VA Home Purchase Loans
B) Conventional Home Purchase Loans
C) Refinancings
D) Home Improvement Loans
F) Non-occupant Loans on < 5 Family Dwellings (A B C & D)
G) Loans On Manufactured Home Dwelling (A B C & D)
Number
Average Value
Number
Average Value
Number
Average Value
Number
Average Value
Number
Average Value
Number
Average Value
LOANS ORIGINATED
4
$127,150
8
$64,346
15
$104,781
4
$53,358
2
$47,150
9
$49,816
APPLICATIONS APPROVED, NOT ACCEPTED
0
$0
5
$74,230
2
$105,700
1
$144,800
1
$84,820
4
$63,568
APPLICATIONS DENIED
2
$68,905
9
$72,294
13
$106,614
5
$63,968
1
$45,160
13
$65,693
APPLICATIONS WITHDRAWN
1
$113,570
1
$54,890
8
$123,664
0
$0
0
$0
2
$72,110
FILES CLOSED FOR INCOMPLETENESS
0
$0
0
$0
3
$96,853
0
$0
0
$0
1
$27,420
Aggregated Statistics For Year 2007 (Based on 2 partial tracts)
A) FHA, FSA/RHS & VA Home Purchase Loans
B) Conventional Home Purchase Loans
C) Refinancings
D) Home Improvement Loans
F) Non-occupant Loans on < 5 Family Dwellings (A B C & D)
G) Loans On Manufactured Home Dwelling (A B C & D)
Number
Average Value
Number
Average Value
Number
Average Value
Number
Average Value
Number
Average Value
Number
Average Value
LOANS ORIGINATED
4
$93,878
13
$73,203
20
$92,092
8
$37,014
2
$33,190
16
$44,524
APPLICATIONS APPROVED, NOT ACCEPTED
1
$50,430
3
$52,060
2
$219,450
1
$47,520
1
$274,570
4
$51,538
APPLICATIONS DENIED
1
$42,580
14
$70,199
14
$99,350
5
$50,330
1
$101,730
12
$50,765
APPLICATIONS WITHDRAWN
0
$0
3
$74,483
6
$121,242
1
$86,680
0
$0
1
$25,140
FILES CLOSED FOR INCOMPLETENESS
0
$0
0
$0
3
$78,080
0
$0
0
$0
0
$0
Aggregated Statistics For Year 2006 (Based on 2 partial tracts)
A) FHA, FSA/RHS & VA Home Purchase Loans
B) Conventional Home Purchase Loans
C) Refinancings
D) Home Improvement Loans
F) Non-occupant Loans on < 5 Family Dwellings (A B C & D)
G) Loans On Manufactured Home Dwelling (A B C & D)
Number
Average Value
Number
Average Value
Number
Average Value
Number
Average Value
Number
Average Value
Number
Average Value
LOANS ORIGINATED
2
$139,975
14
$109,567
22
$88,500
5
$25,178
2
$95,195
9
$40,518
APPLICATIONS APPROVED, NOT ACCEPTED
0
$0
3
$82,470
4
$56,075
1
$25,590
1
$44,120
4
$54,772
APPLICATIONS DENIED
1
$96,980
11
$56,285
17
$92,821
8
$30,175
1
$56,820
14
$51,783
APPLICATIONS WITHDRAWN
1
$65,160
3
$138,690
6
$99,800
1
$74,750
0
$0
1
$46,490
FILES CLOSED FOR INCOMPLETENESS
0
$0
0
$0
6
$107,872
1
$63,940
0
$0
1
$31,550
Aggregated Statistics For Year 2005 (Based on 2 partial tracts)
A) FHA, FSA/RHS & VA Home Purchase Loans
B) Conventional Home Purchase Loans
C) Refinancings
D) Home Improvement Loans
F) Non-occupant Loans on < 5 Family Dwellings (A B C & D)
G) Loans On Manufactured Home Dwelling (A B C & D)
Number
Average Value
Number
Average Value
Number
Average Value
Number
Average Value
Number
Average Value
Number
Average Value
LOANS ORIGINATED
2
$145,270
14
$99,713
19
$96,711
6
$46,395
1
$136,490
10
$42,780
APPLICATIONS APPROVED, NOT ACCEPTED
1
$25,850
4
$65,348
5
$92,566
0
$0
0
$0
4
$42,860
APPLICATIONS DENIED
1
$106,390
17
$52,555
19
$78,580
6
$24,753
2
$53,080
19
$46,211
APPLICATIONS WITHDRAWN
0
$0
2
$74,580
4
$63,368
2
$77,315
0
$0
2
$52,355
FILES CLOSED FOR INCOMPLETENESS
1
$54,570
1
$53,290
5
$102,104
0
$0
1
$44,970
0
$0
Aggregated Statistics For Year 2004 (Based on 2 partial tracts)
A) FHA, FSA/RHS & VA Home Purchase Loans
B) Conventional Home Purchase Loans
C) Refinancings
D) Home Improvement Loans
F) Non-occupant Loans on < 5 Family Dwellings (A B C & D)
G) Loans On Manufactured Home Dwelling (A B C & D)
Number
Average Value
Number
Average Value
Number
Average Value
Number
Average Value
Number
Average Value
Number
Average Value
LOANS ORIGINATED
2
$129,240
10
$88,758
19
$100,369
4
$32,912
2
$79,555
8
$40,842
APPLICATIONS APPROVED, NOT ACCEPTED
0
$0
4
$99,148
8
$77,818
0
$0
0
$0
3
$51,820
APPLICATIONS DENIED
0
$0
8
$51,980
19
$81,941
5
$26,694
0
$0
10
$47,516
APPLICATIONS WITHDRAWN
0
$0
2
$57,670
6
$111,373
1
$123,000
0
$0
1
$56,960
FILES CLOSED FOR INCOMPLETENESS
0
$0
0
$0
6
$93,148
0
$0
0
$0
1
$47,450
Aggregated Statistics For Year 2003 (Based on 1 partial tract)
A) FHA, FSA/RHS & VA Home Purchase Loans
B) Conventional Home Purchase Loans
C) Refinancings
D) Home Improvement Loans
F) Non-occupant Loans on < 5 Family Dwellings (A B C & D)
Number
Average Value
Number
Average Value
Number
Average Value
Number
Average Value
Number
Average Value
LOANS ORIGINATED
2
$84,635
8
$100,358
20
$115,767
3
$28,517
1
$106,020
APPLICATIONS APPROVED, NOT ACCEPTED
0
$0
3
$114,433
7
$88,110
0
$0
0
$0
APPLICATIONS DENIED
0
$0
5
$64,200
15
$71,243
2
$55,935
1
$55,210
APPLICATIONS WITHDRAWN
0
$0
1
$135,640
8
$82,671
0
$0
0
$0
FILES CLOSED FOR INCOMPLETENESS
0
$0
0
$0
1
$124,300
1
$43,870
0
$0
Aggregated Statistics For Year 2002 (Based on 1 partial tract)
A) FHA, FSA/RHS & VA Home Purchase Loans
B) Conventional Home Purchase Loans
C) Refinancings
D) Home Improvement Loans
F) Non-occupant Loans on < 5 Family Dwellings (A B C & D)
Number
Average Value
Number
Average Value
Number
Average Value
Number
Average Value
Number
Average Value
LOANS ORIGINATED
1
$131,620
12
$123,817
17
$104,110
2
$7,680
1
$68,730
APPLICATIONS APPROVED, NOT ACCEPTED
0
$0
5
$46,724
4
$77,142
0
$0
0
$0
APPLICATIONS DENIED
0
$0
12
$49,539
12
$77,598
3
$11,820
1
$33,640
APPLICATIONS WITHDRAWN
0
$0
1
$85,920
3
$115,773
0
$0
0
$0
FILES CLOSED FOR INCOMPLETENESS
0
$0
1
$118,090
1
$169,270
0
$0
0
$0
Aggregated Statistics For Year 2001 (Based on 1 partial tract)
A) FHA, FSA/RHS & VA Home Purchase Loans
B) Conventional Home Purchase Loans
C) Refinancings
D) Home Improvement Loans
F) Non-occupant Loans on < 5 Family Dwellings (A B C & D)
Number
Average Value
Number
Average Value
Number
Average Value
Number
Average Value
Number
Average Value
LOANS ORIGINATED
1
$89,940
10
$55,535
12
$78,543
4
$15,355
1
$36,930
APPLICATIONS APPROVED, NOT ACCEPTED
0
$0
3
$32,050
2
$73,670
0
$0
0
$0
APPLICATIONS DENIED
0
$0
13
$27,505
6
$82,443
2
$3,110
0
$0
APPLICATIONS WITHDRAWN
0
$0
0
$0
3
$84,453
0
$0
0
$0
FILES CLOSED FOR INCOMPLETENESS
0
$0
0
$0
1
$133,440
0
$0
0
$0
Aggregated Statistics For Year 2000 (Based on 1 partial tract)
A) FHA, FSA/RHS & VA Home Purchase Loans
B) Conventional Home Purchase Loans
C) Refinancings
D) Home Improvement Loans
F) Non-occupant Loans on < 5 Family Dwellings (A B C & D)
Number
Average Value
Number
Average Value
Number
Average Value
Number
Average Value
Number
Average Value
LOANS ORIGINATED
1
$69,100
14
$38,388
7
$44,290
2
$12,980
1
$54,110
APPLICATIONS APPROVED, NOT ACCEPTED
0
$0
5
$42,044
1
$115,900
0
$0
0
$0
APPLICATIONS DENIED
1
$33,270
30
$40,789
8
$80,112
1
$8,040
0
$0
APPLICATIONS WITHDRAWN
0
$0
2
$64,530
3
$39,120
0
$0
0
$0
FILES CLOSED FOR INCOMPLETENESS
0
$0
0
$0
1
$54,470
0
$0
0
$0
Aggregated Statistics For Year 1999 (Based on 1 partial tract)
B) Conventional Home Purchase Loans
C) Refinancings
D) Home Improvement Loans
F) Non-occupant Loans on < 5 Family Dwellings (A B C & D)


 Nearest zip codes: 35045, 36758, 36749, 36750, 36790, 36003.


