Estimated zip code population in 2022: 394 Zip code population in 2010: 562 Zip code population in 2000: 114
March 2022 cost of living index in zip code 36013: 78.4 (low, U.S. average is 100)
Land area: 17.4 sq. mi. Water area: 0.1 sq. mi.
Population density: 23 people per square mile
(very low).
OSM Map
General Map
Google Map
MSN Map
OSM Map
General Map
Google Map
MSN Map
OSM Map
General Map
Google Map
MSN Map
OSM Map
General Map
Google Map
MSN Map
Please wait while loading the map...
Real estate property taxes paid for housing units in 2022:
This zip code:
0.3% ($1,360)
Alabama:
0.4% ($718)
Median real estate property taxes paid for housing units with mortgages in 2022: $1,574 (0.3%) Median real estate property taxes paid for housing units with no mortgage in 2022: $757 (0.2%)
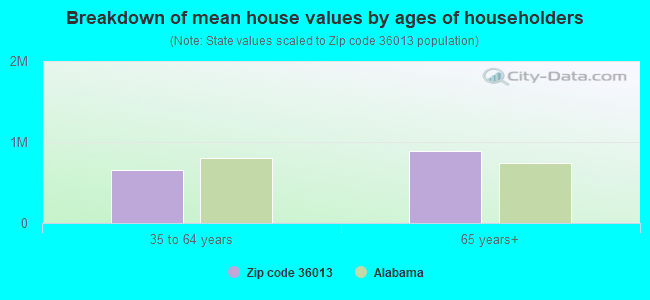
Estimated median house/condo value in 2022: $417,142
36013:
$417,142
Alabama:
$200,900
Median resident age:
This zip code:
50.6 years
Alabama median age:
39.6 years
Average household size:
This zip code:
2.7 people
Alabama:
2.5 people
Averages for the 2020 tax year for zip code 36013, filed in 2021:
Average Adjusted Gross Income (AGI) in 2020: $124,480 (Individual Income Tax Returns)
Here:
$124,480
State:
$63,984
Salary/wage: $96,694 (reported on 85.0% of returns)
Here:
$96,694
State:
$52,834
(% of AGI for various income ranges: 987.5% for AGIs below $25k, 3930.0% for AGIs $25k-50k, 9395.0% for AGIs $50k-75k, 44593.3% for AGIs $100k-200k)
Taxable interest for individuals: $862 (reported on 40.0% of returns)
This zip code:
$862
Alabama:
$1,615
(% of AGI for various income ranges: 55.0% for AGIs $25k-50k, 30.0% for AGIs $100k-200k)
Ordinary dividends: $3,267 (reported on 15.0% of returns)
Here:
$3,267
State:
$7,660
(% of AGI for various income ranges: 326.7% for AGIs $100k-200k)
Net capital gain/loss in AGI: +$18,600 (reported on 15.0% of returns)
Here:
+$18,600
State:
+$23,528
(% of AGI for various income ranges: 2790.0% for AGIs $50k-75k)
Profit/loss from business: +$3,375 (reported on 20.0% of returns)
Here:
+$3,375
State:
+$9,534
(% of AGI for various income ranges: 450.0% for AGIs $100k-200k)
Total itemized deductions: $43,333 (reported on 15.0% of returns)
Here:
$43,333
State:
$37,338
(% of AGI for various income ranges: 4333.3% for AGIs $100k-200k)
Charity contributions: $11,967 (reported on 15.0% of returns)
Here:
$11,967
State:
$18,005
(% of AGI for various income ranges: 1196.7% for AGIs $100k-200k)
Taxes paid: $9,167 (reported on 15.0% of returns)
36013:
$9,167
State:
$6,484
(% of AGI for various income ranges: 916.7% for AGIs $100k-200k)
Percentage of individuals using paid preparers for their 2020 taxes: 95.0%
Here:
95%
State:
93%
(% for various income ranges: 100.0% for AGIs below $25k, 100.0% for AGIs $25k-50k, 100.0% for AGIs $50k-75k, 83.3% for AGIs $100k-200k, 100.0% for AGIs over 200k)
Averages for the 2012 tax year for zip code 36013, filed in 2013:
Average Adjusted Gross Income (AGI) in 2012: $75,942 (Individual Income Tax Returns)
Here:
$75,942
State:
$52,001
Salary/wage: $59,595 (reported on 100.0% of returns)
Here:
$59,595
State:
$43,822
(% of AGI for various income ranges: 76.4% for AGIs below $25k, 79.4% for AGIs $25k-50k, 77.6% for AGIs $50k-75k, 78.8% for AGIs $100k-200k)
Taxable interest for individuals: $767 (reported on 31.6% of returns)
This zip code:
$767
Alabama:
$1,592
Ordinary dividends: $2,350 (reported on 21.1% of returns)
Here:
$2,350
State:
$5,697
Net capital gain/loss in AGI: +$733 (reported on 15.8% of returns)
Here:
+$733
State:
+$13,286
Profit/loss from business: +$2,325 (reported on 21.1% of returns)
Here:
+$2,325
State:
+$9,151
Total itemized deductions: $27,650 (24% of AGI, reported on 42.1% of returns)
Here:
$27,650
State:
$21,388
Here:
24.1% of AGI
State:
20.1% of AGI
Charity contributions: $5,350 (reported on 42.1% of returns)
Here:
$5,350
State:
$5,925
(% of AGI for various income ranges: 5.2% for AGIs $50k-75k, 3.0% for AGIs $100k-200k)
Taxes paid: $6,350 (reported on 42.1% of returns)
36013:
$6,350
State:
$5,272
Earned income credit: $2,433 (reported on 15.8% of returns)
Here:
$2,433
State:
$2,646
(% of AGI for various income ranges: 10.8% for AGIs below $25k)
Percentage of individuals using paid preparers for their 2012 taxes: 42.1%
Here:
42%
State:
60%
(% for various income ranges: 33.3% for AGIs below $25k, 100.0% for AGIs $25k-50k, 40.0% for AGIs $100k-200k)
Averages for the 2004 tax year for zip code 36013, filed in 2005:
Average Adjusted Gross Income (AGI) in 2004: $55,548 (Individual Income Tax Returns)
Here:
$55,548
State:
$42,302
Salary/wage: $49,326 (reported on 86.7% of returns)
Here:
$49,326
State:
$36,626
(% of AGI for various income ranges: 113.6% for AGIs below $10k, 77.2% for AGIs $10k-25k, 77.2% for AGIs $25k-50k, 90.5% for AGIs $50k-75k, 82.9% for AGIs $75k-100k, 68.6% for AGIs over 100k)
Taxable interest for individuals: $701 (reported on 52.4% of returns)
This zip code:
$701
Alabama:
$1,827
(% of AGI for various income ranges: 12.7% for AGIs below $10k, 1.2% for AGIs $25k-50k, 0.1% for AGIs $50k-75k, 0.8% for AGIs $75k-100k, 0.4% for AGIs over 100k)
Taxable dividends: $755 (reported on 31.9% of returns)
Here:
$755
State:
$4,206
(% of AGI for various income ranges: 2.0% for AGIs $10k-25k, 1.1% for AGIs $50k-75k, 0.3% for AGIs over 100k)
Net capital gain/loss: +$680 (reported on 15.1% of returns)
Here:
+$680
State:
+$13,031
Total itemized deductions: $19,553 (21% of AGI, reported on 45.8% of returns)
Here:
$19,553
State:
$17,623
Here:
21.1% of AGI
State:
20.8% of AGI
(% of AGI for various income ranges: 22.3% for AGIs $25k-50k, 21.3% for AGIs $50k-75k, 19.5% for AGIs $75k-100k, 13.5% for AGIs over 100k)
Charity contributions deductions: $5,123 (6% of AGI, reported on 44.0% of returns)
Here:
$5,123
State:
$4,768
Here:
5.5% of AGI
State:
5.4% of AGI
(% of AGI for various income ranges: 5.0% for AGIs $25k-50k, 5.8% for AGIs $50k-75k, 4.3% for AGIs $75k-100k, 3.7% for AGIs over 100k)
Total tax: $8,203 (reported on 80.1% of returns)
36013:
$8,203
State:
$6,905
(% of AGI for various income ranges: 1.8% for AGIs below $10k, 5.8% for AGIs $10k-25k, 6.3% for AGIs $25k-50k, 8.5% for AGIs $50k-75k, 9.5% for AGIs $75k-100k, 16.8% for AGIs over 100k)
Earned income credit: $824 (reported on 10.2% of returns)
Here:
$824
State:
$2,048
Percentage of individuals using paid preparers for their 2004 taxes: 60.8%
Here:
61%
State:
65%
(% for various income ranges: 67.6% for AGIs below $10k, 60.0% for AGIs $10k-25k, 60.6% for AGIs $25k-50k, 56.5% for AGIs $50k-75k, 52.4% for AGIs $75k-100k, 64.0% for AGIs over 100k)
Household received Food Stamps/SNAP in the past 12 months: 0 Household did not receive Food Stamps/SNAP in the past 12 months: 143
Women who did not have a birth in the past 12 months: 87 (48 now married, 39 unmarried)
Housing units in zip code 36013 with a mortgage: 91 (14 second mortgage, 15 both second mortgage and home equity loan) Median monthly owner costs for units with a mortgage: $2,387 Median monthly owner costs for units without a mortgage: $367
Median number of rooms in houses and condos:
Here:
7.4
State:
6.5
Notable locations in this zip code not listed on our city pages
Churches in zip code 36013 include: Pilgrim Church (A), Trinity Church (B), Brewer Memorial Church (C), Mount Pleasant Church (D), Mathis Chapel (E). Display/hide their locations on the map
Size of family households: 76 2-persons, 39 3-persons, 15 4-persons, 6 5-persons, 7 7-or-more-persons
61 married couples with children.
0 single-parent households ().
98.4% of residents of 36013 zip code speak English at home.
0.8% of residents speak Asian or Pacific Island language at home (100% very well).
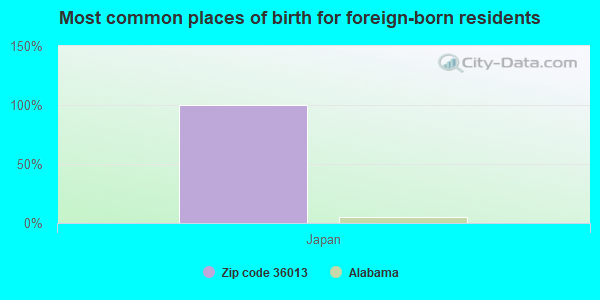
Foreign born population: 3 (0.8%) (0.0% of them are naturalized citizens)
:
0.8%
Whole state:
3.8%
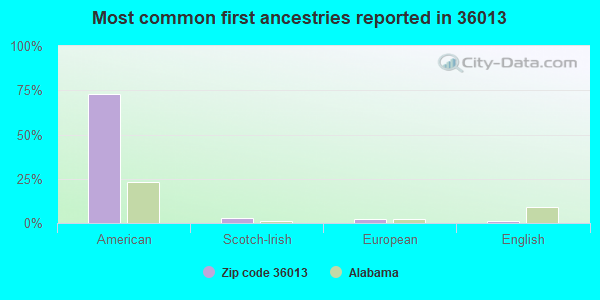
100%Japan
73%American
3%Scotch-Irish
2%European
1%English
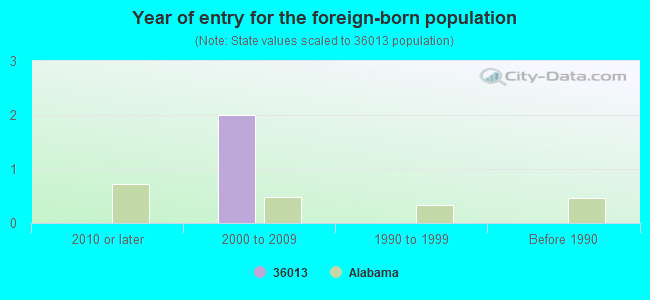
Year of entry for the foreign-born population
02010 or later
22000 to 2009
01990 to 1999
0Before 1990
Private high school in in this zip code not listed on the city page:
MACON EAST ACADEMY (Students: 406, Location: 15396 VAUGHN RD, Grades: PK-12)
Housing units lacking complete plumbing facilities: 11.1% Housing units lacking complete kitchen facilities: 10.5%
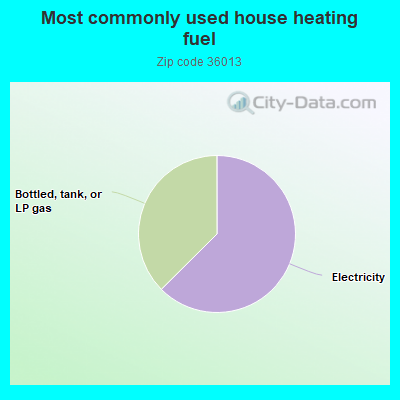
63.0%Electricity
37.7%Bottled, tank, or LP gas
Population in 1990: 407.
Place of birth for U.S.-born residents:
This state: 291
Northeast: 8
Midwest: 16
South: 52
West: 20
70% of the 36013 zip code residents lived in the same house 5 years ago. Out of people who lived in different houses, 56% lived in this county. Out of people who lived in different counties, 50% lived in Alabama.
100% of the 36013 zip code residents lived in the same house 1 year ago.
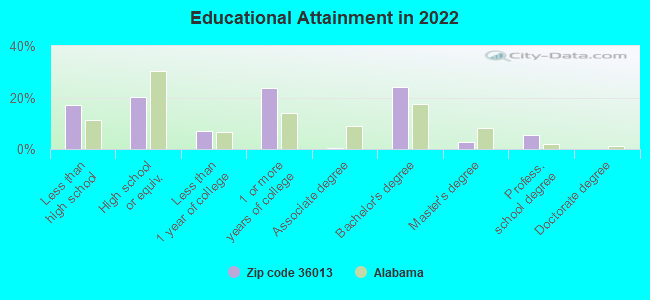
Private vs. public school enrollment:
Students in private schools in grades 1 to 8 (elementary and middle school):
Here:
0.0%
Alabama:
14.7%
Students in private schools in grades 9 to 12 (high school): 52
Here:
90.0%
Alabama:
16.3%
Top industries in this zip code by the number of employees in 2005:
Educational Services: Elementary and Secondary Schools (50-99 employees: 1 establishment)
Administrative and Support and Waste Management and Remediation Services: Landscaping Services (5-9: 1)
Construction: Plumbing, Heating, and Air-Conditioning Contractors (1-4: 2)
Construction: Flooring Contractors (1-4: 1)
Professional, Scientific, and Technical Services: Administrative Management and General Management Consulting Services (1-4: 1)
Fatal accident statistics in 2014:
Fatal accident count: 1
Vehicles involved in fatal accidents: 2
Fatal accidents caused by drunken drivers: 0
Fatalities: 1
Persons involved in fatal accidents: 2
Pedestrians involved in fatal accidents: 0
Fatal accident statistics in 2012:
Fatal accident count: 1
Vehicles involved in fatal accidents: 2
Fatal accidents caused by drunken drivers: 1
Fatalities: 2
Persons involved in fatal accidents: 5
Pedestrians involved in fatal accidents: 0
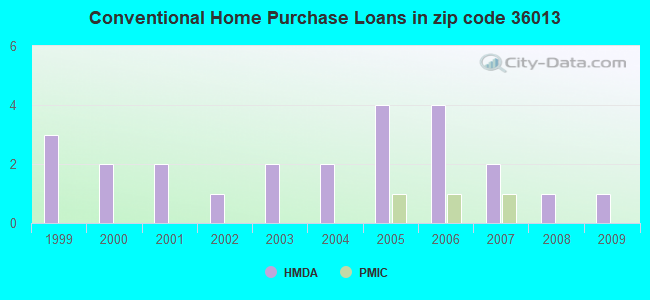
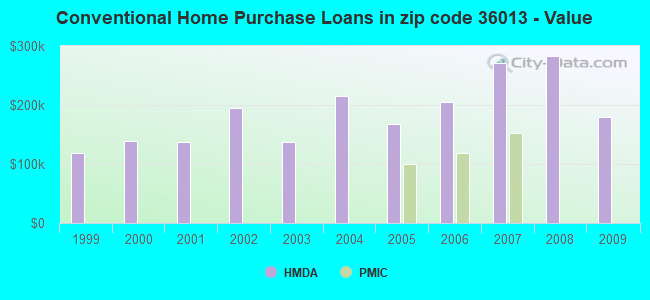
Home Mortgage Disclosure Act Aggregated Statistics For Year 2009 (Based on 1 partial tract)
A) FHA, FSA/RHS & VA Home Purchase Loans
B) Conventional Home Purchase Loans
C) Refinancings
Number
Average Value
Number
Average Value
Number
Average Value
LOANS ORIGINATED
1
$122,190
1
$179,790
5
$211,552
APPLICATIONS APPROVED, NOT ACCEPTED
0
$0
0
$0
0
$0
APPLICATIONS DENIED
0
$0
0
$0
2
$206,740
APPLICATIONS WITHDRAWN
0
$0
0
$0
2
$181,175
FILES CLOSED FOR INCOMPLETENESS
0
$0
0
$0
0
$0
Aggregated Statistics For Year 2008 (Based on 1 partial tract)
B) Conventional Home Purchase Loans
C) Refinancings
Number
Average Value
Number
Average Value
LOANS ORIGINATED
1
$282,360
2
$275,690
APPLICATIONS APPROVED, NOT ACCEPTED
0
$0
0
$0
APPLICATIONS DENIED
0
$0
2
$265,315
APPLICATIONS WITHDRAWN
0
$0
1
$363,090
FILES CLOSED FOR INCOMPLETENESS
0
$0
0
$0
Aggregated Statistics For Year 2007 (Based on 1 partial tract)
A) FHA, FSA/RHS & VA Home Purchase Loans
B) Conventional Home Purchase Loans
C) Refinancings
Number
Average Value
Number
Average Value
Number
Average Value
LOANS ORIGINATED
1
$123,940
2
$271,205
2
$291,075
APPLICATIONS APPROVED, NOT ACCEPTED
0
$0
0
$0
0
$0
APPLICATIONS DENIED
0
$0
1
$210,090
2
$313,795
APPLICATIONS WITHDRAWN
0
$0
0
$0
1
$196,480
FILES CLOSED FOR INCOMPLETENESS
0
$0
0
$0
0
$0
Aggregated Statistics For Year 2006 (Based on 1 partial tract)
A) FHA, FSA/RHS & VA Home Purchase Loans
B) Conventional Home Purchase Loans
C) Refinancings
D) Home Improvement Loans
Number
Average Value
Number
Average Value
Number
Average Value
Number
Average Value
LOANS ORIGINATED
1
$109,510
4
$205,755
4
$192,398
1
$58,340
APPLICATIONS APPROVED, NOT ACCEPTED
0
$0
0
$0
1
$161,620
0
$0
APPLICATIONS DENIED
0
$0
1
$129,680
2
$222,805
0
$0
APPLICATIONS WITHDRAWN
0
$0
1
$109,550
1
$271,010
0
$0
FILES CLOSED FOR INCOMPLETENESS
0
$0
0
$0
1
$175,380
0
$0
Aggregated Statistics For Year 2005 (Based on 1 partial tract)
B) Conventional Home Purchase Loans
C) Refinancings
Number
Average Value
Number
Average Value
LOANS ORIGINATED
4
$167,680
3
$232,350
APPLICATIONS APPROVED, NOT ACCEPTED
0
$0
1
$122,460
APPLICATIONS DENIED
1
$106,940
2
$197,260
APPLICATIONS WITHDRAWN
0
$0
1
$250,770
FILES CLOSED FOR INCOMPLETENESS
0
$0
0
$0
Aggregated Statistics For Year 2004 (Based on 1 partial tract)
B) Conventional Home Purchase Loans
C) Refinancings
Number
Average Value
Number
Average Value
LOANS ORIGINATED
2
$215,185
3
$199,720
APPLICATIONS APPROVED, NOT ACCEPTED
0
$0
1
$180,100
APPLICATIONS DENIED
1
$84,160
1
$174,640
APPLICATIONS WITHDRAWN
0
$0
1
$225,300
FILES CLOSED FOR INCOMPLETENESS
0
$0
1
$103,310
Aggregated Statistics For Year 2003 (Based on 1 partial tract)
B) Conventional Home Purchase Loans
C) Refinancings
Number
Average Value
Number
Average Value
LOANS ORIGINATED
2
$137,630
7
$178,983
APPLICATIONS APPROVED, NOT ACCEPTED
0
$0
1
$162,710
APPLICATIONS DENIED
0
$0
3
$142,673
APPLICATIONS WITHDRAWN
0
$0
1
$167,510
FILES CLOSED FOR INCOMPLETENESS
0
$0
0
$0
Aggregated Statistics For Year 2002 (Based on 1 partial tract)
B) Conventional Home Purchase Loans
C) Refinancings
Number
Average Value
Number
Average Value
LOANS ORIGINATED
1
$195,160
5
$164,112
APPLICATIONS APPROVED, NOT ACCEPTED
0
$0
1
$152,650
APPLICATIONS DENIED
0
$0
1
$185,720
APPLICATIONS WITHDRAWN
0
$0
1
$156,160
FILES CLOSED FOR INCOMPLETENESS
0
$0
0
$0
Aggregated Statistics For Year 2001 (Based on 1 partial tract)
B) Conventional Home Purchase Loans
C) Refinancings
Number
Average Value
Number
Average Value
LOANS ORIGINATED
2
$137,535
4
$178,855
APPLICATIONS APPROVED, NOT ACCEPTED
0
$0
1
$77,140
APPLICATIONS DENIED
0
$0
1
$92,900
APPLICATIONS WITHDRAWN
0
$0
1
$84,590
FILES CLOSED FOR INCOMPLETENESS
0
$0
0
$0
Aggregated Statistics For Year 2000 (Based on 1 partial tract)
B) Conventional Home Purchase Loans
C) Refinancings
Number
Average Value
Number
Average Value
LOANS ORIGINATED
2
$139,075
1
$169,920
APPLICATIONS APPROVED, NOT ACCEPTED
0
$0
0
$0
APPLICATIONS DENIED
2
$37,750
0
$0
APPLICATIONS WITHDRAWN
0
$0
0
$0
FILES CLOSED FOR INCOMPLETENESS
0
$0
0
$0
Aggregated Statistics For Year 1999 (Based on 1 partial tract)


 Nearest zip codes: 36064, 36075, 36029, 36052, 36039, 36117.


 (Students: 406, Location: 15396 VAUGHN RD, Grades: PK-12)