Averages for the 2020 tax year for zip code 36026, filed in 2021:
Average Adjusted Gross Income (AGI) in 2020: $89,773 (Individual Income Tax Returns)
Here:
$89,773
State:
$63,984
Salary/wage: $62,955 (reported on 75.0% of returns)
Here:
$62,955
State:
$52,834
(% of AGI for various income ranges: 1026.7% for AGIs below $25k, 3193.8% for AGIs $25k-50k, 7496.7% for AGIs $50k-75k, 12290.0% for AGIs $75k-100k, 14930.0% for AGIs $100k-200k)
Taxable interest for individuals: $1,339 (reported on 40.9% of returns)
This zip code:
$1,339
Alabama:
$1,615
(% of AGI for various income ranges: 18.9% for AGIs below $25k, 12.5% for AGIs $25k-50k, 86.7% for AGIs $50k-75k, 200.0% for AGIs $75k-100k, 55.0% for AGIs $100k-200k)
Ordinary dividends: $9,675 (reported on 18.2% of returns)
Here:
$9,675
State:
$7,660
(% of AGI for various income ranges: 101.1% for AGIs below $25k, 186.7% for AGIs $50k-75k, 1567.5% for AGIs $100k-200k)
Net capital gain/loss in AGI: +$9,325 (reported on 18.2% of returns)
Here:
+$9,325
State:
+$23,528
(% of AGI for various income ranges: 105.0% for AGIs $25k-50k, 1655.0% for AGIs $100k-200k)
Profit/loss from business: +$7,988 (reported on 18.2% of returns)
Here:
+$7,988
State:
+$9,534
(% of AGI for various income ranges: 201.1% for AGIs below $25k, 251.3% for AGIs $25k-50k, 1285.0% for AGIs $75k-100k)
Taxable individual retirement arrangement distribution: $15,225 (reported on 9.1% of returns)
36026:
$15,225
Alabama:
$19,004
(% of AGI for various income ranges: 2030.0% for AGIs $50k-75k)
Total itemized deductions: $35,200 (reported on 9.1% of returns)
Here:
$35,200
State:
$37,338
(% of AGI for various income ranges: 3520.0% for AGIs $100k-200k)
Charity contributions: $14,200 (reported on 6.8% of returns)
Here:
$14,200
State:
$18,005
(% of AGI for various income ranges: 1065.0% for AGIs $100k-200k)
Taxes paid: $6,300 (reported on 9.1% of returns)
36026:
$6,300
State:
$6,484
(% of AGI for various income ranges: 630.0% for AGIs $100k-200k)
Earned income credit: $2,333 (reported on 13.6% of returns)
Here:
$2,333
State:
$2,628
(% of AGI for various income ranges: 155.6% for AGIs below $25k)
Percentage of individuals using paid preparers for their 2020 taxes: 95.5%
Here:
95%
State:
93%
(% for various income ranges: 91.7% for AGIs below $25k, 90.9% for AGIs $25k-50k, 100.0% for AGIs $50k-75k, 100.0% for AGIs $75k-100k, 100.0% for AGIs $100k-200k, 100.0% for AGIs over 200k)
Averages for the 2012 tax year for zip code 36026, filed in 2013:
Average Adjusted Gross Income (AGI) in 2012: $50,295 (Individual Income Tax Returns)
Here:
$50,295
State:
$52,001
Salary/wage: $41,239 (reported on 76.7% of returns)
Here:
$41,239
State:
$43,822
(% of AGI for various income ranges: 60.2% for AGIs below $25k, 69.4% for AGIs $25k-50k, 67.8% for AGIs $50k-75k, 67.5% for AGIs $75k-100k, 55.1% for AGIs $100k-200k)
Taxable interest for individuals: $735 (reported on 39.5% of returns)
This zip code:
$735
Alabama:
$1,592
(% of AGI for various income ranges: 1.8% for AGIs below $25k, 0.9% for AGIs $25k-50k, 0.7% for AGIs $50k-75k, 0.3% for AGIs $100k-200k)
Ordinary dividends: $3,743 (reported on 16.3% of returns)
Here:
$3,743
State:
$5,697
(% of AGI for various income ranges: 3.6% for AGIs below $25k, 2.6% for AGIs $25k-50k, 1.1% for AGIs $100k-200k)
Profit/loss from business: +$7,617 (reported on 14.0% of returns)
Here:
+$7,617
State:
+$9,151
Taxable individual retirement arrangement distribution: $15,140 (reported on 11.6% of returns)
36026:
$15,140
Alabama:
$14,992
Total itemized deductions: $19,300 (22% of AGI, reported on 27.9% of returns)
Here:
$19,300
State:
$21,388
Here:
21.9% of AGI
State:
20.1% of AGI
(% of AGI for various income ranges: 27.1% for AGIs below $25k, 20.3% for AGIs $50k-75k, 12.3% for AGIs $100k-200k)
Charity contributions: $5,473 (reported on 25.6% of returns)
Here:
$5,473
State:
$5,925
(% of AGI for various income ranges: 5.1% for AGIs below $25k, 4.9% for AGIs $50k-75k, 3.9% for AGIs $100k-200k)
Taxes paid: $3,733 (reported on 27.9% of returns)
36026:
$3,733
State:
$5,272
(% of AGI for various income ranges: 2.6% for AGIs below $25k, 3.6% for AGIs $50k-75k, 3.2% for AGIs $100k-200k)
Earned income credit: $2,329 (reported on 16.3% of returns)
Here:
$2,329
State:
$2,646
(% of AGI for various income ranges: 9.0% for AGIs below $25k)
Percentage of individuals using paid preparers for their 2012 taxes: 58.1%
Here:
58%
State:
60%
(% for various income ranges: 53.3% for AGIs below $25k, 58.3% for AGIs $25k-50k, 57.1% for AGIs $50k-75k, 75.0% for AGIs $75k-100k, 60.0% for AGIs $100k-200k)
Averages for the 2004 tax year for zip code 36026, filed in 2005:
Average Adjusted Gross Income (AGI) in 2004: $44,028 (Individual Income Tax Returns)
Here:
$44,028
State:
$42,302
Salary/wage: $37,539 (reported on 75.5% of returns)
Here:
$37,539
State:
$36,626
(% of AGI for various income ranges: 80.1% for AGIs below $10k, 71.0% for AGIs $10k-25k, 71.6% for AGIs $25k-50k, 65.7% for AGIs $50k-75k, 67.7% for AGIs $75k-100k, 53.0% for AGIs over 100k)
Taxable interest for individuals: $1,652 (reported on 43.3% of returns)
This zip code:
$1,652
Alabama:
$1,827
(% of AGI for various income ranges: 4.4% for AGIs below $10k, 2.9% for AGIs $10k-25k, 1.2% for AGIs $25k-50k, 2.9% for AGIs $50k-75k, 0.6% for AGIs $75k-100k, 0.7% for AGIs over 100k)
Taxable dividends: $1,791 (reported on 18.8% of returns)
Here:
$1,791
State:
$4,206
(% of AGI for various income ranges: 1.0% for AGIs $10k-25k, 0.5% for AGIs $25k-50k, 1.9% for AGIs $50k-75k, 0.4% for AGIs over 100k)
Net capital gain/loss: +$8,018 (reported on 12.5% of returns)
Here:
+$8,018
State:
+$13,031
(% of AGI for various income ranges: 5.5% for AGIs below $10k, 2.0% for AGIs $25k-50k, 1.7% for AGIs $50k-75k, 12.4% for AGIs $75k-100k)
Profit/loss from business: +$2,015 (reported on 14.4% of returns)
Here:
+$2,015
State:
+$8,302
(% of AGI for various income ranges: 10.0% for AGIs $10k-25k, 0.1% for AGIs $25k-50k, -0.7% for AGIs $50k-75k, -2.7% for AGIs $75k-100k)
Total itemized deductions: $16,906 (22% of AGI, reported on 32.6% of returns)
Here:
$16,906
State:
$17,623
Here:
21.7% of AGI
State:
20.8% of AGI
(% of AGI for various income ranges: 10.3% for AGIs $10k-25k, 12.5% for AGIs $25k-50k, 14.8% for AGIs $50k-75k, 12.8% for AGIs $75k-100k, 12.2% for AGIs over 100k)
Charity contributions deductions: $4,689 (6% of AGI, reported on 29.5% of returns)
Here:
$4,689
State:
$4,768
Here:
5.8% of AGI
State:
5.4% of AGI
(% of AGI for various income ranges: 2.3% for AGIs $10k-25k, 2.1% for AGIs $25k-50k, 3.5% for AGIs $50k-75k, 2.9% for AGIs $75k-100k, 4.3% for AGIs over 100k)
Total tax: $6,420 (reported on 77.0% of returns)
36026:
$6,420
State:
$6,905
(% of AGI for various income ranges: 1.7% for AGIs below $10k, 4.2% for AGIs $10k-25k, 6.5% for AGIs $25k-50k, 8.7% for AGIs $50k-75k, 11.7% for AGIs $75k-100k, 19.9% for AGIs over 100k)
Earned income credit: $1,988 (reported on 18.2% of returns)
Here:
$1,988
State:
$2,048
Percentage of individuals using paid preparers for their 2004 taxes: 64.6%
Here:
65%
State:
65%
(% for various income ranges: 58.2% for AGIs below $10k, 66.9% for AGIs $10k-25k, 66.9% for AGIs $25k-50k, 65.3% for AGIs $50k-75k, 60.0% for AGIs $75k-100k, 60.0% for AGIs over 100k)
Household received Food Stamps/SNAP in the past 12 months: 12 Household did not receive Food Stamps/SNAP in the past 12 months: 593
Women who did not have a birth in the past 12 months: 220 (12 now married, 209 unmarried)
Housing units in zip code 36026 with a mortgage: 300 (9 second mortgage, 9 both second mortgage and home equity loan) Median monthly owner costs for units with a mortgage: $1,673 Median monthly owner costs for units without a mortgage: $461
Residents with income below the poverty level in 2022:
This zip code:
11.1%
Whole state:
16.2%
Residents with income below 50% of the poverty level in 2022:
This zip code:
4.4%
Whole state:
8.6%
Median number of rooms in houses and condos:
Here:
6.3
State:
6.5
Median number of rooms in apartments:
Here:
5.0
State:
4.7
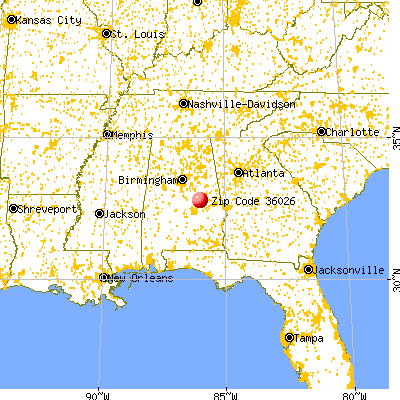
Notable locations in this zip code not listed on our city pages
Notable locations in zip code 36026: Real Island Marina (A), Tates Fish Camp (B), Swift Creek Hunting Club (C), Parker Creek Marina (D), Equality Volunteer Fire Department (E), Real Island Volunteer Fire Department (F). Display/hide their locations on the map
Churches in zip code 36026 include: Mount Nebo Church (A), Rehobeth Methodist Church (B), Castleberry Memorial Chapel (C), Bethlehem Church (D), Harmony Baptist Church (E), Bethesda Baptist Church (F), The Baptist Temple Church (G), New Style Church (H), Kendrick Memorial Church (I). Display/hide their locations on the map
Cemeteries: Rehobeth Cemetery (1), Harmony Cemetery (2), Equality Cemetery (3), Bethesda Cemetery (4), Bethel Cemetery (5), Pine Grove Cemetery (6), Lindsey Cemetery (7). Display/hide their locations on the map
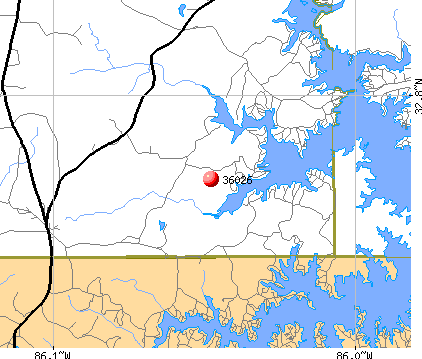
Streams, rivers, and creeks: Speed Creek (A), Chapman Creek (B), Lybrand Creek (C), Lott Slough (D), Parker Creek (E), Bethesda Creek (F). Display/hide their locations on the map
Size of family households: 175 2-persons, 44 3-persons, 25 4-persons, 43 5-persons
Size of nonfamily households: 319 1-person
7 married couples with children.
20 single-parent households (20 men).
95.5% of residents of 36026 zip code speak English at home.
2.4% of residents speak Spanish at home (100% very well).
3.8% of residents speak other language at home (100% very well).
Foreign born population: 0 (0.0%)
:
0.0%
Whole state:
3.8%
32%Irish
22%American
15%English
10%German
3%French Canadian
2%French
1%British
Year of entry for the foreign-born population
02010 or later
02000 to 2009
01990 to 1999
7Before 1990
Facilities with environmental interests located in this zip code:
RUSSELL LANDS INC (REAL ISLAND MARINA INC in EQUALITY, AL)
National Pollutant Discharge Elimination System NON-MAJOR (Tracking pollutant discharge elimination systems) - permit Business SIC classification: MARINAS Alternative names: REAL ISLAND MARINA INC
Housing units lacking complete plumbing facilities: 6.6% Housing units lacking complete kitchen facilities: 7.4%
89.8%Electricity
8.7%Bottled, tank, or LP gas
1.7%No fuel used
Population in 1990: 1,121. Population change in the 1990s: +2 (+0.2%).
Place of birth for U.S.-born residents:
This state: 940
Midwest: 63
South: 254
West: 37
71% of the 36026 zip code residents lived in the same house 5 years ago. Out of people who lived in different houses, 19% lived in this county. Out of people who lived in different counties, 50% lived in Alabama.
87% of the 36026 zip code residents lived in the same house 1 year ago. Out of people who lived in different houses, 52% moved from this county. Out of people who lived in different houses, 50% moved from different state.
Private vs. public school enrollment:
Students in private schools in grades 1 to 8 (elementary and middle school):
Here:
0.0%
Alabama:
14.7%
Students in private schools in grades 9 to 12 (high school):
Here:
0.0%
Alabama:
16.3%
Students in private undergraduate colleges:
Here:
0.0%
Alabama:
14.6%
Occupation by median earnings in the past 12 months ($)
171,791Health diagnosing and treating practitioners and other technical occupations
105,202Production occupations
80,986Sales and related occupations
9,496Management occupations
Top industries in this zip code by the number of employees in 2005:
Arts, Entertainment, and Recreation: Marinas (5-9 employees: 1 establishment)
Construction: New Single-Family Housing Construction (except Operative Builders) (1-4: 1)
Construction: Residential Remodelers (1-4: 1)
Construction: Electrical Contractors (1-4: 1)
Construction: Roofing Contractors (1-4: 1)
Information: Data Processing, Hosting, and Related Services (1-4: 1)
Fatal accident statistics in 2010:
Fatal accident count: 1
Vehicles involved in fatal accidents: 1
Fatal accidents caused by drunken drivers: 1
Fatalities: 1
Persons involved in fatal accidents: 2
Pedestrians involved in fatal accidents: 0
Home Mortgage Disclosure Act Aggregated Statistics For Year 2009 (Based on 2 partial tracts)
A) FHA, FSA/RHS & VA Home Purchase Loans
B) Conventional Home Purchase Loans
C) Refinancings
D) Home Improvement Loans
F) Non-occupant Loans on < 5 Family Dwellings (A B C & D)
G) Loans On Manufactured Home Dwelling (A B C & D)
Number
Average Value
Number
Average Value
Number
Average Value
Number
Average Value
Number
Average Value
Number
Average Value
LOANS ORIGINATED
2
$127,805
2
$115,540
14
$170,958
1
$25,090
2
$249,235
1
$47,480
APPLICATIONS APPROVED, NOT ACCEPTED
0
$0
0
$0
1
$161,430
0
$0
0
$0
1
$40,870
APPLICATIONS DENIED
0
$0
1
$75,350
6
$107,102
1
$34,290
1
$64,430
1
$100,310
APPLICATIONS WITHDRAWN
1
$87,970
1
$66,180
4
$160,362
0
$0
0
$0
1
$82,060
FILES CLOSED FOR INCOMPLETENESS
0
$0
0
$0
1
$263,540
0
$0
0
$0
0
$0
Aggregated Statistics For Year 2008 (Based on 2 partial tracts)
A) FHA, FSA/RHS & VA Home Purchase Loans
B) Conventional Home Purchase Loans
C) Refinancings
D) Home Improvement Loans
F) Non-occupant Loans on < 5 Family Dwellings (A B C & D)
G) Loans On Manufactured Home Dwelling (A B C & D)
Number
Average Value
Number
Average Value
Number
Average Value
Number
Average Value
Number
Average Value
Number
Average Value
LOANS ORIGINATED
2
$95,625
5
$154,844
11
$156,229
1
$29,060
3
$201,090
3
$50,723
APPLICATIONS APPROVED, NOT ACCEPTED
0
$0
1
$40,770
1
$175,180
0
$0
0
$0
1
$42,120
APPLICATIONS DENIED
0
$0
2
$59,745
5
$133,710
1
$129,360
1
$97,340
2
$81,405
APPLICATIONS WITHDRAWN
0
$0
1
$56,250
3
$136,937
0
$0
0
$0
0
$0
FILES CLOSED FOR INCOMPLETENESS
0
$0
0
$0
1
$71,730
0
$0
0
$0
0
$0
Aggregated Statistics For Year 2007 (Based on 2 partial tracts)
A) FHA, FSA/RHS & VA Home Purchase Loans
B) Conventional Home Purchase Loans
C) Refinancings
D) Home Improvement Loans
F) Non-occupant Loans on < 5 Family Dwellings (A B C & D)
G) Loans On Manufactured Home Dwelling (A B C & D)
Number
Average Value
Number
Average Value
Number
Average Value
Number
Average Value
Number
Average Value
Number
Average Value
LOANS ORIGINATED
1
$148,770
5
$126,542
11
$149,847
3
$46,760
3
$200,960
3
$62,750
APPLICATIONS APPROVED, NOT ACCEPTED
0
$0
1
$89,300
1
$98,440
0
$0
0
$0
2
$44,535
APPLICATIONS DENIED
0
$0
3
$58,513
5
$83,874
2
$49,825
1
$38,310
3
$61,690
APPLICATIONS WITHDRAWN
1
$104,570
1
$96,680
2
$128,550
1
$30,980
0
$0
1
$43,650
FILES CLOSED FOR INCOMPLETENESS
0
$0
0
$0
2
$133,945
0
$0
0
$0
0
$0
Aggregated Statistics For Year 2006 (Based on 2 partial tracts)
A) FHA, FSA/RHS & VA Home Purchase Loans
B) Conventional Home Purchase Loans
C) Refinancings
D) Home Improvement Loans
F) Non-occupant Loans on < 5 Family Dwellings (A B C & D)
G) Loans On Manufactured Home Dwelling (A B C & D)
Number
Average Value
Number
Average Value
Number
Average Value
Number
Average Value
Number
Average Value
Number
Average Value
LOANS ORIGINATED
1
$121,930
10
$155,269
10
$124,621
2
$45,730
4
$175,880
2
$74,585
APPLICATIONS APPROVED, NOT ACCEPTED
0
$0
1
$70,640
2
$90,390
0
$0
0
$0
1
$55,690
APPLICATIONS DENIED
0
$0
3
$63,937
6
$86,543
1
$70,070
1
$85,360
3
$47,387
APPLICATIONS WITHDRAWN
0
$0
1
$83,690
3
$117,573
1
$33,050
1
$83,140
0
$0
FILES CLOSED FOR INCOMPLETENESS
0
$0
0
$0
2
$123,325
0
$0
0
$0
0
$0
Aggregated Statistics For Year 2005 (Based on 2 partial tracts)
A) FHA, FSA/RHS & VA Home Purchase Loans
B) Conventional Home Purchase Loans
C) Refinancings
D) Home Improvement Loans
F) Non-occupant Loans on < 5 Family Dwellings (A B C & D)
G) Loans On Manufactured Home Dwelling (A B C & D)
Number
Average Value
Number
Average Value
Number
Average Value
Number
Average Value
Number
Average Value
Number
Average Value
LOANS ORIGINATED
1
$135,550
8
$135,236
10
$111,157
3
$46,580
3
$197,177
3
$46,313
APPLICATIONS APPROVED, NOT ACCEPTED
0
$0
1
$144,260
3
$62,227
0
$0
1
$49,630
1
$61,630
APPLICATIONS DENIED
1
$44,030
3
$92,727
6
$88,508
2
$34,270
1
$123,790
3
$55,273
APPLICATIONS WITHDRAWN
1
$69,010
2
$109,240
4
$100,735
1
$49,020
0
$0
1
$39,640
FILES CLOSED FOR INCOMPLETENESS
0
$0
0
$0
2
$129,870
0
$0
0
$0
0
$0
Aggregated Statistics For Year 2004 (Based on 2 partial tracts)
A) FHA, FSA/RHS & VA Home Purchase Loans
B) Conventional Home Purchase Loans
C) Refinancings
D) Home Improvement Loans
F) Non-occupant Loans on < 5 Family Dwellings (A B C & D)
G) Loans On Manufactured Home Dwelling (A B C & D)
Number
Average Value
Number
Average Value
Number
Average Value
Number
Average Value
Number
Average Value
Number
Average Value
LOANS ORIGINATED
1
$80,600
10
$117,986
11
$120,281
3
$32,973
3
$147,357
4
$32,655
APPLICATIONS APPROVED, NOT ACCEPTED
0
$0
1
$61,100
2
$68,975
1
$13,800
0
$0
0
$0
APPLICATIONS DENIED
1
$64,520
3
$51,020
5
$68,412
2
$19,620
0
$0
2
$43,130
APPLICATIONS WITHDRAWN
0
$0
1
$127,140
3
$105,067
0
$0
1
$116,730
1
$43,590
FILES CLOSED FOR INCOMPLETENESS
0
$0
0
$0
2
$99,970
0
$0
0
$0
0
$0
Aggregated Statistics For Year 2003 (Based on 2 partial tracts)
A) FHA, FSA/RHS & VA Home Purchase Loans
B) Conventional Home Purchase Loans
C) Refinancings
D) Home Improvement Loans
F) Non-occupant Loans on < 5 Family Dwellings (A B C & D)
Number
Average Value
Number
Average Value
Number
Average Value
Number
Average Value
Number
Average Value
LOANS ORIGINATED
0
$0
8
$113,338
20
$100,185
2
$28,045
4
$108,315
APPLICATIONS APPROVED, NOT ACCEPTED
0
$0
1
$136,480
4
$72,372
1
$10,470
0
$0
APPLICATIONS DENIED
0
$0
1
$95,680
8
$78,044
1
$30,420
0
$0
APPLICATIONS WITHDRAWN
1
$48,150
0
$0
4
$117,255
0
$0
0
$0
FILES CLOSED FOR INCOMPLETENESS
0
$0
0
$0
1
$75,680
0
$0
0
$0
Aggregated Statistics For Year 2002 (Based on 2 partial tracts)
B) Conventional Home Purchase Loans
C) Refinancings
D) Home Improvement Loans
F) Non-occupant Loans on < 5 Family Dwellings (A B C & D)
Number
Average Value
Number
Average Value
Number
Average Value
Number
Average Value
LOANS ORIGINATED
8
$95,720
12
$107,606
2
$15,375
3
$137,343
APPLICATIONS APPROVED, NOT ACCEPTED
2
$66,570
2
$76,475
0
$0
0
$0
APPLICATIONS DENIED
3
$51,487
8
$79,991
2
$19,265
0
$0
APPLICATIONS WITHDRAWN
1
$55,610
3
$98,547
0
$0
0
$0
FILES CLOSED FOR INCOMPLETENESS
0
$0
1
$68,040
0
$0
0
$0
Aggregated Statistics For Year 2001 (Based on 2 partial tracts)
A) FHA, FSA/RHS & VA Home Purchase Loans
B) Conventional Home Purchase Loans
C) Refinancings
D) Home Improvement Loans
F) Non-occupant Loans on < 5 Family Dwellings (A B C & D)
Number
Average Value
Number
Average Value
Number
Average Value
Number
Average Value
Number
Average Value
LOANS ORIGINATED
1
$59,510
9
$77,448
13
$101,544
2
$25,795
2
$118,525
APPLICATIONS APPROVED, NOT ACCEPTED
0
$0
2
$46,955
1
$106,680
1
$7,090
0
$0
APPLICATIONS DENIED
0
$0
5
$41,608
5
$81,604
2
$5,770
0
$0
APPLICATIONS WITHDRAWN
0
$0
1
$60,990
3
$108,547
0
$0
0
$0
FILES CLOSED FOR INCOMPLETENESS
0
$0
0
$0
1
$51,900
0
$0
0
$0
Aggregated Statistics For Year 2000 (Based on 2 partial tracts)
A) FHA, FSA/RHS & VA Home Purchase Loans
B) Conventional Home Purchase Loans
C) Refinancings
D) Home Improvement Loans
F) Non-occupant Loans on < 5 Family Dwellings (A B C & D)
Number
Average Value
Number
Average Value
Number
Average Value
Number
Average Value
Number
Average Value
LOANS ORIGINATED
1
$52,430
9
$79,689
5
$75,360
4
$24,398
2
$85,800
APPLICATIONS APPROVED, NOT ACCEPTED
0
$0
2
$63,395
1
$55,130
0
$0
0
$0
APPLICATIONS DENIED
0
$0
7
$44,204
5
$58,996
1
$35,010
0
$0
APPLICATIONS WITHDRAWN
1
$74,340
1
$125,190
2
$72,395
0
$0
0
$0
FILES CLOSED FOR INCOMPLETENESS
0
$0
0
$0
1
$40,200
0
$0
0
$0
Aggregated Statistics For Year 1999 (Based on 2 partial tracts)
A) FHA, FSA/RHS & VA Home Purchase Loans
B) Conventional Home Purchase Loans
C) Refinancings
D) Home Improvement Loans
F) Non-occupant Loans on < 5 Family Dwellings (A B C & D)
Detailed PMIC statistics for the following Tracts:0302.00
, 0303.00
2003 - 2018 National Fire Incident Reporting System (NFIRS) incidents
Based on the data from the years 2003 - 2018 the average number of fire incidents per year is 10. The highest number of reported fire incidents - 36 took place in 2006, and the least - 1 in 2016. The data has a decreasing trend.
When looking into fire subcategories, the most reports belonged to: Outside Fires (56.4%), and Structure Fires (29.7%).
Fire incident types reported to NFIRS in Zip Code 36026


 Nearest zip codes: 36024, 36080, 36092, 35089, 35136, 35010.


 Based on the data from the years 2003 - 2018 the average number of fire incidents per year is 10. The highest number of reported fire incidents - 36 took place in 2006, and the least - 1 in 2016. The data has a decreasing trend.
 When looking into fire subcategories, the most reports belonged to: Outside Fires (56.4%), and Structure Fires (29.7%).