Estimated zip code population in 2022: 3,338 Zip code population in 2010: 2,304 Zip code population in 2000: 2,015
Houses and condos: 1,200 Renter-occupied apartments: 143
% of renters here:
13%
State:
30%
March 2022 cost of living index in zip code 36051: 80.7 (low, U.S. average is 100)
Land area: 50.8 sq. mi. Water area: 0.3 sq. mi.
Population density: 66 people per square mile
(very low).
OSM Map
General Map
Google Map
MSN Map
OSM Map
General Map
Google Map
MSN Map
OSM Map
General Map
Google Map
MSN Map
OSM Map
General Map
Google Map
MSN Map
Please wait while loading the map...
Real estate property taxes paid for housing units in 2022:
This zip code:
0.2% ($203)
Alabama:
0.4% ($718)
Median real estate property taxes paid for housing units with mortgages in 2022: $475 Median real estate property taxes paid for housing units with no mortgage in 2022: $203
Business Search- 14 Million verified businesses
Males: 1,704
(51.1%)
Females: 1,633
(48.9%)
For population 25 years and over in 36051:
High school or higher: 94.7%
Bachelor's degree or higher: 15.9%
Graduate or professional degree: 10.2%
Unemployed: 2.7%
Mean travel time to work (commute): 35.0 minutes
For population 15 years and over in 36051:
Never married: 27.9%
Now married: 51.0%
Separated: 2.8%
Widowed: 3.1%
Divorced: 15.2%
Zip code 36051 compared to state average:
Median house value below state average.
Renting percentage significantly below state average.
Length of stay since moving in significantly above state average.
Number of college students significantly below state average.
Percentage of population with a bachelor's degree or higher below state average.
Averages for the 2020 tax year for zip code 36051, filed in 2021:
Average Adjusted Gross Income (AGI) in 2020: $49,035 (Individual Income Tax Returns)
Here:
$49,035
State:
$63,984
Salary/wage: $47,696 (reported on 81.8% of returns)
Here:
$47,696
State:
$52,834
(% of AGI for various income ranges: 1097.5% for AGIs below $25k, 3694.3% for AGIs $25k-50k, 6256.4% for AGIs $50k-75k, 8692.9% for AGIs $75k-100k, 20138.6% for AGIs $100k-200k)
Taxable interest for individuals: $365 (reported on 26.3% of returns)
This zip code:
$365
Alabama:
$1,615
(% of AGI for various income ranges: 4.6% for AGIs below $25k, 4.8% for AGIs $25k-50k, 6.4% for AGIs $50k-75k, 31.4% for AGIs $75k-100k, 60.0% for AGIs $100k-200k)
Ordinary dividends: $1,100 (reported on 6.1% of returns)
Here:
$1,100
State:
$7,660
(% of AGI for various income ranges: 10.4% for AGIs below $25k, 6.4% for AGIs $50k-75k, 42.9% for AGIs $100k-200k)
Net capital gain/loss in AGI: +$1,633 (reported on 6.1% of returns)
Here:
+$1,633
State:
+$23,528
(% of AGI for various income ranges: 17.0% for AGIs $25k-50k, 84.3% for AGIs $100k-200k)
Profit/loss from business: +$7,594 (reported on 16.2% of returns)
Here:
+$7,594
State:
+$9,534
(% of AGI for various income ranges: 171.1% for AGIs below $25k, 67.0% for AGIs $25k-50k, 130.0% for AGIs $50k-75k, 627.1% for AGIs $100k-200k)
Taxable individual retirement arrangement distribution: $9,175 (reported on 4.0% of returns)
36051:
$9,175
Alabama:
$19,004
(% of AGI for various income ranges: 33.9% for AGIs below $25k, 247.3% for AGIs $50k-75k)
Total itemized deductions: $33,150 (reported on 4.0% of returns)
Here:
$33,150
State:
$37,338
(% of AGI for various income ranges: 188.7% for AGIs $25k-50k, 1274.3% for AGIs $100k-200k)
Charity contributions: $12,667 (reported on 3.0% of returns)
Here:
$12,667
State:
$18,005
(% of AGI for various income ranges: 542.9% for AGIs $75k-100k)
Taxes paid: $5,950 (reported on 4.0% of returns)
36051:
$5,950
State:
$6,484
(% of AGI for various income ranges: 340.0% for AGIs $100k-200k)
Earned income credit: $2,591 (reported on 22.2% of returns)
Here:
$2,591
State:
$2,628
(% of AGI for various income ranges: 138.9% for AGIs below $25k, 78.7% for AGIs $25k-50k)
Percentage of individuals using paid preparers for their 2020 taxes: 91.9%
Here:
92%
State:
93%
(% for various income ranges: 94.4% for AGIs below $25k, 89.7% for AGIs $25k-50k, 92.3% for AGIs $50k-75k, 88.9% for AGIs $75k-100k, 91.7% for AGIs $100k-200k)
Averages for the 2012 tax year for zip code 36051, filed in 2013:
Average Adjusted Gross Income (AGI) in 2012: $39,665 (Individual Income Tax Returns)
Here:
$39,665
State:
$52,001
Salary/wage: $37,470 (reported on 82.8% of returns)
Here:
$37,470
State:
$43,822
(% of AGI for various income ranges: 77.0% for AGIs below $25k, 83.0% for AGIs $25k-50k, 81.0% for AGIs $50k-75k, 80.2% for AGIs $75k-100k, 71.8% for AGIs $100k-200k)
Taxable interest for individuals: $537 (reported on 20.4% of returns)
This zip code:
$537
Alabama:
$1,592
(% of AGI for various income ranges: 0.9% for AGIs below $25k, 0.1% for AGIs $25k-50k, 0.1% for AGIs $50k-75k, 0.1% for AGIs $75k-100k, 0.2% for AGIs $100k-200k)
Ordinary dividends: $567 (reported on 6.5% of returns)
Here:
$567
State:
$5,697
Profit/loss from business: +$5,207 (reported on 15.1% of returns)
Here:
+$5,207
State:
+$9,151
(% of AGI for various income ranges: 8.5% for AGIs below $25k, 1.6% for AGIs $25k-50k, 1.8% for AGIs $50k-75k)
Taxable individual retirement arrangement distribution: $16,400 (reported on 5.4% of returns)
36051:
$16,400
Alabama:
$14,992
Total itemized deductions: $16,850 (22% of AGI, reported on 19.4% of returns)
Here:
$16,850
State:
$21,388
Here:
21.9% of AGI
State:
20.1% of AGI
(% of AGI for various income ranges: 3.9% for AGIs below $25k, 5.2% for AGIs $25k-50k, 9.9% for AGIs $50k-75k, 9.8% for AGIs $75k-100k, 10.7% for AGIs $100k-200k)
Charity contributions: $4,433 (reported on 12.9% of returns)
Here:
$4,433
State:
$5,925
(% of AGI for various income ranges: 1.4% for AGIs below $25k, 1.7% for AGIs $50k-75k, 1.8% for AGIs $75k-100k, 2.1% for AGIs $100k-200k)
Taxes paid: $3,367 (reported on 19.4% of returns)
36051:
$3,367
State:
$5,272
(% of AGI for various income ranges: 0.9% for AGIs $25k-50k, 1.5% for AGIs $50k-75k, 2.0% for AGIs $75k-100k, 3.0% for AGIs $100k-200k)
Earned income credit: $2,833 (reported on 32.3% of returns)
Here:
$2,833
State:
$2,646
(% of AGI for various income ranges: 12.5% for AGIs below $25k, 1.9% for AGIs $25k-50k)
Percentage of individuals using paid preparers for their 2012 taxes: 61.3%
Here:
61%
State:
60%
(% for various income ranges: 61.4% for AGIs below $25k, 54.5% for AGIs $25k-50k, 66.7% for AGIs $50k-75k, 62.5% for AGIs $75k-100k, 71.4% for AGIs $100k-200k)
Averages for the 2004 tax year for zip code 36051, filed in 2005:
Average Adjusted Gross Income (AGI) in 2004: $32,197 (Individual Income Tax Returns)
Here:
$32,197
State:
$42,302
Salary/wage: $30,395 (reported on 87.2% of returns)
Here:
$30,395
State:
$36,626
(% of AGI for various income ranges: 94.4% for AGIs below $10k, 83.9% for AGIs $10k-25k, 85.9% for AGIs $25k-50k, 81.7% for AGIs $50k-75k, 85.2% for AGIs $75k-100k, 69.3% for AGIs over 100k)
Taxable interest for individuals: $709 (reported on 24.0% of returns)
This zip code:
$709
Alabama:
$1,827
(% of AGI for various income ranges: 0.5% for AGIs below $10k, 1.3% for AGIs $10k-25k, 0.5% for AGIs $25k-50k, 0.3% for AGIs $50k-75k, 0.3% for AGIs $75k-100k, 0.4% for AGIs over 100k)
Taxable dividends: $765 (reported on 9.4% of returns)
Here:
$765
State:
$4,206
(% of AGI for various income ranges: 0.0% for AGIs $10k-25k, 0.2% for AGIs $25k-50k, 0.1% for AGIs $50k-75k, 0.6% for AGIs $75k-100k, 0.5% for AGIs over 100k)
Net capital gain/loss: +$1,300 (reported on 4.7% of returns)
Here:
+$1,300
State:
+$13,031
Profit/loss from business: +$10,464 (reported on 12.8% of returns)
Here:
+$10,464
State:
+$8,302
(% of AGI for various income ranges: 7.1% for AGIs below $10k, 6.1% for AGIs $10k-25k, 2.4% for AGIs $25k-50k, 5.2% for AGIs $50k-75k, 8.5% for AGIs $75k-100k)
Total itemized deductions: $13,979 (23% of AGI, reported on 21.8% of returns)
Here:
$13,979
State:
$17,623
Here:
23.2% of AGI
State:
20.8% of AGI
(% of AGI for various income ranges: 5.7% for AGIs $10k-25k, 8.6% for AGIs $25k-50k, 12.4% for AGIs $50k-75k, 11.9% for AGIs $75k-100k, 10.2% for AGIs over 100k)
Charity contributions deductions: $2,929 (5% of AGI, reported on 18.0% of returns)
Here:
$2,929
State:
$4,768
Here:
4.6% of AGI
State:
5.4% of AGI
(% of AGI for various income ranges: 0.6% for AGIs $10k-25k, 1.3% for AGIs $25k-50k, 1.4% for AGIs $50k-75k, 3.0% for AGIs $75k-100k, 3.0% for AGIs over 100k)
Total tax: $3,885 (reported on 64.7% of returns)
36051:
$3,885
State:
$6,905
(% of AGI for various income ranges: 3.3% for AGIs below $10k, 3.1% for AGIs $10k-25k, 5.1% for AGIs $25k-50k, 8.3% for AGIs $50k-75k, 10.7% for AGIs $75k-100k, 16.2% for AGIs over 100k)
Earned income credit: $1,946 (reported on 30.2% of returns)
Here:
$1,946
State:
$2,048
Percentage of individuals using paid preparers for their 2004 taxes: 62.2%
Here:
62%
State:
65%
(% for various income ranges: 54.4% for AGIs below $10k, 68.7% for AGIs $10k-25k, 63.1% for AGIs $25k-50k, 60.7% for AGIs $50k-75k, 48.8% for AGIs $75k-100k, 67.7% for AGIs over 100k)
Household received Food Stamps/SNAP in the past 12 months: 128 Household did not receive Food Stamps/SNAP in the past 12 months: 982
Women who had a birth in the past 12 months: 30 (35 now married, 0 unmarried) Women who did not have a birth in the past 12 months: 723 (417 now married, 305 unmarried)
Housing units in zip code 36051 with a mortgage: 237 Median monthly owner costs for units with a mortgage: $834 Median monthly owner costs for units without a mortgage: $271
Residents with income below the poverty level in 2022:
This zip code:
15.8%
Whole state:
16.2%
Residents with income below 50% of the poverty level in 2022:
This zip code:
11.8%
Whole state:
8.6%
Median number of rooms in houses and condos:
Here:
6.6
State:
6.5
Median number of rooms in apartments:
Here:
5.5
State:
4.7
Notable locations in this zip code not listed on our city pages
Churches in zip code 36051 include: New Prospect Church (A), Saint Paul African Methodist Episcopal Church (B), Mountain Creek Baptist Church (C), Pleasant Hill Church (D), Union Church (E), Antioch Church (F), Brown Town Church (G), Mount Pisgah Church (H), Bethlehem West Church (I). Display/hide their locations on the map
Cemeteries: Mountain Creek Cemetery (1), Saint Paul Cemetery (2), New Harmony Cemetery (3), Marbury Church of God Cemetery (4), Marbury Baptist Church Cemetery (5), New Prospect Cemetery (6). Display/hide their locations on the map
In group quarters: 17 (-1 institutionalized population)
Size of family households: 221 2-persons, 208 3-persons, 208 4-persons, 124 5-persons
Size of nonfamily households: 291 1-person, 55 2-persons
779 married couples with children.
0 single-parent households ().
97.9% of residents of 36051 zip code speak English at home.
1.0% of residents speak Spanish at home (23% very well, 7% well, 70% not well).
Foreign born population: 89 (2.7%) (3.6% of them are naturalized citizens)
This zip code:
2.7%
Whole state:
3.8%
98%Honduras
11%German
6%Hungarian
5%American
5%Irish
3%English
2%Scotch-Irish
1%Scottish
Year of entry for the foreign-born population
22010 or later
772000 to 2009
31990 to 1999
8Before 1990
Facilities with environmental interests located in this zip code:
MARBURY SCHOOL (210 COUNTRY RD 20 E in MARBURY, AL)
(Geographic Names Information System) (National Center for Education Statistics) - STATE ID-0050 Organizations: AUTAUGA COUNTY (SCHOOL DISTRICT)
CANAANLAND CHRISTIAN SCHOOL (RT. 1 BOX 74F in MARBURY, AL)
COMPLIANCE ACTIVITY (Tracking inspections of insecticide, fungicide, and rodenticide, and toxic substances)
Housing units lacking complete plumbing facilities: 3.5% Housing units lacking complete kitchen facilities: 5.7%
66.6%Electricity
26.1%Bottled, tank, or LP gas
4.2%Utility gas
3.3%Wood
Population in 1990: 3,573.
Place of birth for U.S.-born residents:
This state: 2,839
Midwest: 143
South: 212
West: 16
64% of the 36051 zip code residents lived in the same house 5 years ago. Out of people who lived in different houses, 44% lived in this county. Out of people who lived in different counties, 50% lived in Alabama.
99% of the 36051 zip code residents lived in the same house 1 year ago. Out of people who lived in different houses, 106% moved from this county. Out of people who lived in different houses, 3% moved from different state.
Private vs. public school enrollment:
Students in private schools in grades 1 to 8 (elementary and middle school):
Here:
0.0%
Alabama:
14.7%
Students in private schools in grades 9 to 12 (high school):
Here:
0.0%
Alabama:
16.3%
Students in private undergraduate colleges: 32
Here:
100.0%
Alabama:
14.6%
Occupation by median earnings in the past 12 months ($)
57,288Production occupations
50,021Construction and extraction occupations
49,241Installation, maintenance, and repair occupations
30,139Office and administrative support occupations
24,585Building and grounds cleaning and maintenance occupations
24,338Sales and related occupations
Companies with federal contracts located in this zip code:
AMERICAN FENCE AND DECK (750 COUNTY RD 49 in MARBURY, AL; small business)
$11,960 with Army for Fencing, Fences, Gates and Components. Signed on 2004-09-29. Completion date: 2004-11-30.
Top industries in this zip code by the number of employees in 2005:
Administrative and Support and Waste Management and Remediation Services: Landscaping Services (5-9 employees: 1 establishment)
Utilities: Water Supply and Irrigation Systems (5-9: 1)
Construction: Plumbing, Heating, and Air-Conditioning Contractors (5-9: 1)
Other Services (except Public Administration): Religious Organizations (1-4: 3)
Construction: Tile and Terrazzo Contractors (1-4: 1)
Construction: Drywall and Insulation Contractors (1-4: 1)
Wholesale Trade: Industrial Machinery and Equipment Merchant Wholesalers (1-4: 1)
People in group quarters in 2010:
7 people in other noninstitutional facilities
People in group quarters in 2000:
121 people in nursing homes
7 people in religious group quarters
Fatal accident statistics in 2013:
Fatal accident count: 1
Vehicles involved in fatal accidents: 2
Fatal accidents caused by drunken drivers: 0
Fatalities: 1
Persons involved in fatal accidents: 6
Pedestrians involved in fatal accidents: 0
Fatal accident statistics in 2011:
Fatal accident count: 3
Vehicles involved in fatal accidents: 5
Fatal accidents caused by drunken drivers: 0
Fatalities: 3
Persons involved in fatal accidents: 12
Pedestrians involved in fatal accidents: 0
Home Mortgage Disclosure Act Aggregated Statistics For Year 2009 (Based on 2 partial tracts)
A) FHA, FSA/RHS & VA Home Purchase Loans
B) Conventional Home Purchase Loans
C) Refinancings
D) Home Improvement Loans
F) Non-occupant Loans on < 5 Family Dwellings (A B C & D)
G) Loans On Manufactured Home Dwelling (A B C & D)
Number
Average Value
Number
Average Value
Number
Average Value
Number
Average Value
Number
Average Value
Number
Average Value
LOANS ORIGINATED
12
$151,075
11
$93,031
56
$151,759
3
$23,343
4
$110,080
9
$52,697
APPLICATIONS APPROVED, NOT ACCEPTED
0
$0
1
$30,920
3
$143,333
0
$0
0
$0
1
$71,490
APPLICATIONS DENIED
1
$201,860
6
$56,392
23
$134,043
6
$69,500
1
$26,530
9
$64,353
APPLICATIONS WITHDRAWN
1
$120,780
2
$81,680
16
$162,018
1
$128,250
0
$0
2
$88,215
FILES CLOSED FOR INCOMPLETENESS
1
$88,910
0
$0
5
$204,546
0
$0
0
$0
0
$0
Aggregated Statistics For Year 2008 (Based on 2 partial tracts)
A) FHA, FSA/RHS & VA Home Purchase Loans
B) Conventional Home Purchase Loans
C) Refinancings
D) Home Improvement Loans
F) Non-occupant Loans on < 5 Family Dwellings (A B C & D)
G) Loans On Manufactured Home Dwelling (A B C & D)
Number
Average Value
Number
Average Value
Number
Average Value
Number
Average Value
Number
Average Value
Number
Average Value
LOANS ORIGINATED
15
$173,526
20
$127,760
42
$443,271
8
$20,686
8
$119,762
11
$62,519
APPLICATIONS APPROVED, NOT ACCEPTED
0
$0
5
$59,276
6
$95,252
0
$0
1
$52,640
6
$51,580
APPLICATIONS DENIED
1
$186,550
16
$80,625
27
$113,134
7
$83,570
2
$90,545
16
$59,134
APPLICATIONS WITHDRAWN
2
$154,590
2
$164,550
14
$134,604
1
$68,690
1
$206,380
1
$53,840
FILES CLOSED FOR INCOMPLETENESS
1
$59,010
1
$183,180
2
$209,485
0
$0
0
$0
0
$0
Aggregated Statistics For Year 2007 (Based on 2 partial tracts)
A) FHA, FSA/RHS & VA Home Purchase Loans
B) Conventional Home Purchase Loans
C) Refinancings
D) Home Improvement Loans
F) Non-occupant Loans on < 5 Family Dwellings (A B C & D)
G) Loans On Manufactured Home Dwelling (A B C & D)
Number
Average Value
Number
Average Value
Number
Average Value
Number
Average Value
Number
Average Value
Number
Average Value
LOANS ORIGINATED
13
$138,163
48
$125,446
45
$115,852
10
$31,594
7
$101,260
18
$52,578
APPLICATIONS APPROVED, NOT ACCEPTED
1
$79,240
10
$110,868
5
$132,022
2
$50,845
0
$0
5
$60,564
APPLICATIONS DENIED
1
$92,070
13
$92,112
25
$112,850
10
$37,809
1
$79,460
14
$55,098
APPLICATIONS WITHDRAWN
1
$124,200
4
$134,600
13
$109,005
3
$34,983
1
$38,290
1
$75,510
FILES CLOSED FOR INCOMPLETENESS
0
$0
2
$229,315
4
$192,018
0
$0
0
$0
0
$0
Aggregated Statistics For Year 2006 (Based on 2 partial tracts)
A) FHA, FSA/RHS & VA Home Purchase Loans
B) Conventional Home Purchase Loans
C) Refinancings
D) Home Improvement Loans
F) Non-occupant Loans on < 5 Family Dwellings (A B C & D)
G) Loans On Manufactured Home Dwelling (A B C & D)
Number
Average Value
Number
Average Value
Number
Average Value
Number
Average Value
Number
Average Value
Number
Average Value
LOANS ORIGINATED
12
$161,562
48
$108,552
43
$95,845
15
$26,353
7
$113,357
17
$44,794
APPLICATIONS APPROVED, NOT ACCEPTED
1
$97,430
7
$58,604
6
$67,960
1
$44,420
1
$91,140
6
$52,788
APPLICATIONS DENIED
1
$93,530
19
$65,202
25
$87,301
15
$31,088
2
$87,415
21
$43,480
APPLICATIONS WITHDRAWN
1
$111,430
7
$116,106
14
$122,077
3
$36,343
1
$45,540
2
$48,105
FILES CLOSED FOR INCOMPLETENESS
0
$0
0
$0
6
$97,830
1
$58,260
0
$0
0
$0
Aggregated Statistics For Year 2005 (Based on 2 partial tracts)
A) FHA, FSA/RHS & VA Home Purchase Loans
B) Conventional Home Purchase Loans
C) Refinancings
D) Home Improvement Loans
F) Non-occupant Loans on < 5 Family Dwellings (A B C & D)
G) Loans On Manufactured Home Dwelling (A B C & D)
Number
Average Value
Number
Average Value
Number
Average Value
Number
Average Value
Number
Average Value
Number
Average Value
LOANS ORIGINATED
9
$127,859
42
$106,231
44
$103,514
13
$26,748
7
$73,039
15
$47,919
APPLICATIONS APPROVED, NOT ACCEPTED
0
$0
8
$76,656
7
$86,450
1
$32,210
0
$0
5
$45,480
APPLICATIONS DENIED
1
$157,880
17
$61,424
35
$84,904
11
$34,505
2
$82,200
21
$45,170
APPLICATIONS WITHDRAWN
1
$43,650
5
$102,676
14
$100,401
2
$66,550
1
$90,910
4
$59,445
FILES CLOSED FOR INCOMPLETENESS
0
$0
2
$71,740
9
$124,657
0
$0
0
$0
0
$0
Aggregated Statistics For Year 2004 (Based on 2 partial tracts)
A) FHA, FSA/RHS & VA Home Purchase Loans
B) Conventional Home Purchase Loans
C) Refinancings
D) Home Improvement Loans
F) Non-occupant Loans on < 5 Family Dwellings (A B C & D)
G) Loans On Manufactured Home Dwelling (A B C & D)
Number
Average Value
Number
Average Value
Number
Average Value
Number
Average Value
Number
Average Value
Number
Average Value
LOANS ORIGINATED
9
$139,607
33
$108,909
44
$99,720
11
$37,223
3
$78,470
11
$43,761
APPLICATIONS APPROVED, NOT ACCEPTED
1
$58,380
8
$63,722
12
$78,565
2
$22,710
0
$0
7
$41,341
APPLICATIONS DENIED
1
$157,960
16
$53,936
30
$78,648
10
$36,921
1
$56,780
20
$51,454
APPLICATIONS WITHDRAWN
1
$67,440
4
$88,215
15
$99,235
2
$51,210
1
$38,560
3
$43,417
FILES CLOSED FOR INCOMPLETENESS
0
$0
1
$50,080
15
$87,909
1
$41,580
0
$0
3
$63,603
Aggregated Statistics For Year 2003 (Based on 2 partial tracts)
A) FHA, FSA/RHS & VA Home Purchase Loans
B) Conventional Home Purchase Loans
C) Refinancings
D) Home Improvement Loans
F) Non-occupant Loans on < 5 Family Dwellings (A B C & D)
Number
Average Value
Number
Average Value
Number
Average Value
Number
Average Value
Number
Average Value
LOANS ORIGINATED
7
$123,040
24
$95,804
70
$99,054
6
$16,253
5
$101,506
APPLICATIONS APPROVED, NOT ACCEPTED
0
$0
5
$77,450
16
$76,985
1
$32,380
0
$0
APPLICATIONS DENIED
1
$112,240
13
$49,879
41
$79,756
3
$41,733
2
$78,245
APPLICATIONS WITHDRAWN
1
$80,760
3
$82,703
15
$103,289
1
$35,620
0
$0
FILES CLOSED FOR INCOMPLETENESS
0
$0
0
$0
5
$125,016
1
$43,470
0
$0
Aggregated Statistics For Year 2002 (Based on 2 partial tracts)
A) FHA, FSA/RHS & VA Home Purchase Loans
B) Conventional Home Purchase Loans
C) Refinancings
D) Home Improvement Loans
F) Non-occupant Loans on < 5 Family Dwellings (A B C & D)
Number
Average Value
Number
Average Value
Number
Average Value
Number
Average Value
Number
Average Value
LOANS ORIGINATED
4
$124,375
27
$85,998
51
$91,198
7
$23,996
6
$76,718
APPLICATIONS APPROVED, NOT ACCEPTED
0
$0
9
$66,871
8
$80,039
0
$0
0
$0
APPLICATIONS DENIED
0
$0
23
$56,017
29
$71,289
8
$19,564
3
$52,540
APPLICATIONS WITHDRAWN
1
$59,450
3
$99,073
15
$87,255
1
$59,910
0
$0
FILES CLOSED FOR INCOMPLETENESS
0
$0
1
$21,610
4
$120,035
0
$0
0
$0
Aggregated Statistics For Year 2001 (Based on 2 partial tracts)
A) FHA, FSA/RHS & VA Home Purchase Loans
B) Conventional Home Purchase Loans
C) Refinancings
D) Home Improvement Loans
F) Non-occupant Loans on < 5 Family Dwellings (A B C & D)
Number
Average Value
Number
Average Value
Number
Average Value
Number
Average Value
Number
Average Value
LOANS ORIGINATED
6
$124,350
34
$68,724
43
$89,972
9
$12,079
3
$65,470
APPLICATIONS APPROVED, NOT ACCEPTED
1
$19,420
7
$59,349
8
$72,996
1
$16,470
1
$22,170
APPLICATIONS DENIED
0
$0
22
$40,915
25
$69,333
4
$10,678
3
$24,123
APPLICATIONS WITHDRAWN
0
$0
4
$33,815
12
$77,417
1
$15,040
0
$0
FILES CLOSED FOR INCOMPLETENESS
0
$0
1
$116,920
4
$93,588
0
$0
0
$0
Aggregated Statistics For Year 2000 (Based on 2 partial tracts)
A) FHA, FSA/RHS & VA Home Purchase Loans
B) Conventional Home Purchase Loans
C) Refinancings
D) Home Improvement Loans
F) Non-occupant Loans on < 5 Family Dwellings (A B C & D)
Number
Average Value
Number
Average Value
Number
Average Value
Number
Average Value
Number
Average Value
LOANS ORIGINATED
9
$108,284
37
$64,832
25
$82,762
6
$13,845
5
$58,562
APPLICATIONS APPROVED, NOT ACCEPTED
1
$22,220
11
$48,205
3
$76,513
1
$17,170
1
$13,810
APPLICATIONS DENIED
1
$95,960
49
$39,160
16
$53,399
6
$13,628
2
$36,555
APPLICATIONS WITHDRAWN
2
$61,945
6
$75,468
6
$81,852
1
$6,070
1
$88,870
FILES CLOSED FOR INCOMPLETENESS
0
$0
1
$96,830
1
$79,850
0
$0
0
$0
Aggregated Statistics For Year 1999 (Based on 2 partial tracts)
A) FHA, FSA/RHS & VA Home Purchase Loans
B) Conventional Home Purchase Loans
C) Refinancings
D) Home Improvement Loans
F) Non-occupant Loans on < 5 Family Dwellings (A B C & D)
Detailed PMIC statistics for the following Tracts:0209.00
, 0301.00
2003 - 2018 National Fire Incident Reporting System (NFIRS) incidents
Based on the data from the years 2003 - 2018 the average number of fires per year is 9. The highest number of fires - 27 took place in 2010, and the least - 2 in 2009. The data has a growing trend.
When looking into fire subcategories, the most incidents belonged to: Outside Fires (54.9%), and Structure Fires (35.4%).
Fire incident types reported to NFIRS in Zip Code 36051

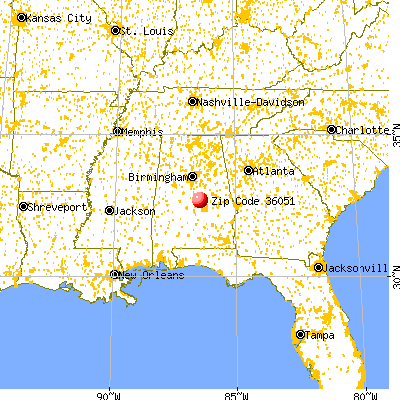


 Nearest zip codes: 36091, 36022, 36067, 35045, 36080, 36066.


 Based on the data from the years 2003 - 2018 the average number of fires per year is 9. The highest number of fires - 27 took place in 2010, and the least - 2 in 2009. The data has a growing trend.
 When looking into fire subcategories, the most incidents belonged to: Outside Fires (54.9%), and Structure Fires (35.4%).