Estimated zip code population in 2022: 2,786 Zip code population in 2010: 2,770 Zip code population in 2000: 2,985
Houses and condos: 1,373 Renter-occupied apartments: 225
% of renters here:
21%
State:
30%
March 2022 cost of living index in zip code 36311: 80.9 (low, U.S. average is 100)
Land area: 119.8 sq. mi. Water area: 0.1 sq. mi.
Population density: 23 people per square mile
(very low).
OSM Map
General Map
Google Map
MSN Map
OSM Map
General Map
Google Map
MSN Map
OSM Map
General Map
Google Map
MSN Map
OSM Map
General Map
Google Map
MSN Map
Please wait while loading the map...
Real estate property taxes paid for housing units in 2022:
This zip code:
0.3% ($385)
Alabama:
0.4% ($718)
Median real estate property taxes paid for housing units with mortgages in 2022: $404 (0.4%) Median real estate property taxes paid for housing units with no mortgage in 2022: $304 (0.3%)
Business Search- 14 Million verified businesses
Males: 1,264
(45.4%)
Females: 1,522
(54.6%)
For population 25 years and over in 36311:
High school or higher: 83.9%
Bachelor's degree or higher: 10.8%
Graduate or professional degree: 6.1%
Unemployed: 3.7%
Mean travel time to work (commute): 24.2 minutes
For population 15 years and over in 36311:
Never married: 29.7%
Now married: 48.7%
Separated: 1.1%
Widowed: 7.7%
Divorced: 12.9%
Zip code 36311 compared to state average:
Median house value below state average.
Black race population percentage significantly below state average.
Foreign-born population percentage below state average.
Length of stay since moving in significantly above state average.
Number of college students below state average.
Percentage of population with a bachelor's degree or higher significantly below state average.
Averages for the 2020 tax year for zip code 36311, filed in 2021:
Average Adjusted Gross Income (AGI) in 2020: $51,168 (Individual Income Tax Returns)
Here:
$51,168
State:
$63,984
Salary/wage: $47,341 (reported on 80.7% of returns)
Here:
$47,341
State:
$52,834
(% of AGI for various income ranges: 1284.0% for AGIs below $25k, 3823.7% for AGIs $25k-50k, 6262.7% for AGIs $50k-75k, 11267.1% for AGIs $75k-100k, 19708.8% for AGIs $100k-200k)
Taxable interest for individuals: $629 (reported on 25.7% of returns)
This zip code:
$629
Alabama:
$1,615
(% of AGI for various income ranges: 10.3% for AGIs below $25k, 27.9% for AGIs $25k-50k, 20.9% for AGIs $50k-75k, 17.1% for AGIs $75k-100k, 71.2% for AGIs $100k-200k)
Ordinary dividends: $1,190 (reported on 9.2% of returns)
Here:
$1,190
State:
$7,660
(% of AGI for various income ranges: 7.0% for AGIs below $25k, 40.0% for AGIs $50k-75k, 67.5% for AGIs $100k-200k)
Net capital gain/loss in AGI: +$6,933 (reported on 8.3% of returns)
Here:
+$6,933
State:
+$23,528
(% of AGI for various income ranges: 4.3% for AGIs below $25k, 35.5% for AGIs $50k-75k, 715.0% for AGIs $100k-200k)
Profit/loss from business: +$6,524 (reported on 15.6% of returns)
Here:
+$6,524
State:
+$9,534
(% of AGI for various income ranges: 187.3% for AGIs below $25k, 105.8% for AGIs $25k-50k, 122.7% for AGIs $50k-75k, 263.8% for AGIs $100k-200k)
Taxable individual retirement arrangement distribution: $15,583 (reported on 5.5% of returns)
36311:
$15,583
Alabama:
$19,004
(% of AGI for various income ranges: 157.4% for AGIs $25k-50k, 578.2% for AGIs $50k-75k)
Total itemized deductions: $28,125 (reported on 3.7% of returns)
Here:
$28,125
State:
$37,338
(% of AGI for various income ranges: 1406.2% for AGIs $100k-200k)
Charity contributions: $11,900 (reported on 2.8% of returns)
Here:
$11,900
State:
$18,005
(% of AGI for various income ranges: 446.3% for AGIs $100k-200k)
Taxes paid: $4,550 (reported on 3.7% of returns)
36311:
$4,550
State:
$6,484
(% of AGI for various income ranges: 227.5% for AGIs $100k-200k)
Earned income credit: $2,664 (reported on 22.9% of returns)
Here:
$2,664
State:
$2,628
(% of AGI for various income ranges: 154.0% for AGIs below $25k, 107.4% for AGIs $25k-50k)
Percentage of individuals using paid preparers for their 2020 taxes: 90.8%
Here:
91%
State:
93%
(% for various income ranges: 88.4% for AGIs below $25k, 92.3% for AGIs $25k-50k, 92.9% for AGIs $50k-75k, 90.9% for AGIs $75k-100k, 93.3% for AGIs $100k-200k)
Averages for the 2012 tax year for zip code 36311, filed in 2013:
Average Adjusted Gross Income (AGI) in 2012: $42,947 (Individual Income Tax Returns)
Here:
$42,947
State:
$52,001
Salary/wage: $39,845 (reported on 82.4% of returns)
Here:
$39,845
State:
$43,822
(% of AGI for various income ranges: 76.1% for AGIs below $25k, 77.5% for AGIs $25k-50k, 75.6% for AGIs $50k-75k, 85.0% for AGIs $75k-100k, 70.3% for AGIs $100k-200k)
Taxable interest for individuals: $1,083 (reported on 28.4% of returns)
This zip code:
$1,083
Alabama:
$1,592
(% of AGI for various income ranges: 0.9% for AGIs below $25k, 0.6% for AGIs $25k-50k, 0.5% for AGIs $50k-75k, 0.2% for AGIs $75k-100k, 1.3% for AGIs $100k-200k)
Ordinary dividends: $1,689 (reported on 8.8% of returns)
Here:
$1,689
State:
$5,697
(% of AGI for various income ranges: 0.3% for AGIs $25k-50k, 0.5% for AGIs $50k-75k, 0.6% for AGIs $100k-200k)
Net capital gain/loss in AGI: +$2,629 (reported on 6.9% of returns)
Here:
+$2,629
State:
+$13,286
Profit/loss from business: +$7,344 (reported on 15.7% of returns)
Here:
+$7,344
State:
+$9,151
(% of AGI for various income ranges: 7.4% for AGIs below $25k, 1.8% for AGIs $25k-50k, 2.9% for AGIs $50k-75k, 3.8% for AGIs $75k-100k)
Taxable individual retirement arrangement distribution: $9,433 (reported on 5.9% of returns)
36311:
$9,433
Alabama:
$14,992
Total itemized deductions: $17,812 (24% of AGI, reported on 23.5% of returns)
Here:
$17,812
State:
$21,388
Here:
24.4% of AGI
State:
20.1% of AGI
(% of AGI for various income ranges: 5.9% for AGIs below $25k, 9.0% for AGIs $25k-50k, 8.9% for AGIs $50k-75k, 11.8% for AGIs $75k-100k, 11.8% for AGIs $100k-200k)
Charity contributions: $5,275 (reported on 19.6% of returns)
Here:
$5,275
State:
$5,925
(% of AGI for various income ranges: 2.6% for AGIs $25k-50k, 2.0% for AGIs $50k-75k, 3.3% for AGIs $75k-100k, 3.3% for AGIs $100k-200k)
Taxes paid: $3,512 (reported on 23.5% of returns)
36311:
$3,512
State:
$5,272
(% of AGI for various income ranges: 0.6% for AGIs below $25k, 1.1% for AGIs $25k-50k, 1.5% for AGIs $50k-75k, 2.5% for AGIs $75k-100k, 3.3% for AGIs $100k-200k)
Earned income credit: $2,533 (reported on 26.5% of returns)
Here:
$2,533
State:
$2,646
(% of AGI for various income ranges: 8.7% for AGIs below $25k, 1.6% for AGIs $25k-50k)
Percentage of individuals using paid preparers for their 2012 taxes: 65.7%
Here:
66%
State:
60%
(% for various income ranges: 61.4% for AGIs below $25k, 69.2% for AGIs $25k-50k, 73.3% for AGIs $50k-75k, 55.6% for AGIs $75k-100k, 75.0% for AGIs $100k-200k)
Averages for the 2004 tax year for zip code 36311, filed in 2005:
Average Adjusted Gross Income (AGI) in 2004: $32,532 (Individual Income Tax Returns)
Here:
$32,532
State:
$42,302
Salary/wage: $30,781 (reported on 84.7% of returns)
Here:
$30,781
State:
$36,626
(% of AGI for various income ranges: 161.1% for AGIs below $10k, 80.8% for AGIs $10k-25k, 84.5% for AGIs $25k-50k, 86.7% for AGIs $50k-75k, 79.3% for AGIs $75k-100k, 51.9% for AGIs over 100k)
Taxable interest for individuals: $1,080 (reported on 34.0% of returns)
This zip code:
$1,080
Alabama:
$1,827
(% of AGI for various income ranges: 6.0% for AGIs below $10k, 1.5% for AGIs $10k-25k, 0.8% for AGIs $25k-50k, 1.4% for AGIs $50k-75k, 0.5% for AGIs $75k-100k, 0.7% for AGIs over 100k)
Taxable dividends: $1,297 (reported on 10.1% of returns)
Here:
$1,297
State:
$4,206
(% of AGI for various income ranges: 1.4% for AGIs below $10k, 0.3% for AGIs $10k-25k, 0.2% for AGIs $25k-50k, 0.2% for AGIs $50k-75k, 1.5% for AGIs over 100k)
Net capital gain/loss: +$11,720 (reported on 9.3% of returns)
Here:
+$11,720
State:
+$13,031
(% of AGI for various income ranges: 1.7% for AGIs below $10k, 0.8% for AGIs $10k-25k, 0.3% for AGIs $25k-50k, 0.0% for AGIs $50k-75k, 0.3% for AGIs $75k-100k, 19.5% for AGIs over 100k)
Profit/loss from business: +$1,973 (reported on 14.6% of returns)
Here:
+$1,973
State:
+$8,302
(% of AGI for various income ranges: -0.4% for AGIs below $10k, 4.0% for AGIs $10k-25k, 1.7% for AGIs $25k-50k, -0.2% for AGIs $50k-75k, -0.7% for AGIs $75k-100k)
IRA payment deduction: $1,688 (reported on 1.6% of returns)
36311:
$1,688
Alabama:
$3,006
Total itemized deductions: $15,243 (24% of AGI, reported on 18.5% of returns)
Here:
$15,243
State:
$17,623
Here:
23.7% of AGI
State:
20.8% of AGI
(% of AGI for various income ranges: 8.6% for AGIs $10k-25k, 7.2% for AGIs $25k-50k, 9.0% for AGIs $50k-75k, 9.8% for AGIs $75k-100k, 10.8% for AGIs over 100k)
Charity contributions deductions: $4,226 (6% of AGI, reported on 16.4% of returns)
Here:
$4,226
State:
$4,768
Here:
6.2% of AGI
State:
5.4% of AGI
(% of AGI for various income ranges: 1.6% for AGIs $10k-25k, 1.8% for AGIs $25k-50k, 2.0% for AGIs $50k-75k, 2.7% for AGIs $75k-100k, 3.2% for AGIs over 100k)
Total tax: $4,049 (reported on 67.6% of returns)
36311:
$4,049
State:
$6,905
(% of AGI for various income ranges: 4.7% for AGIs below $10k, 3.6% for AGIs $10k-25k, 5.4% for AGIs $25k-50k, 8.3% for AGIs $50k-75k, 11.8% for AGIs $75k-100k, 15.3% for AGIs over 100k)
Earned income credit: $1,888 (reported on 26.9% of returns)
Here:
$1,888
State:
$2,048
Percentage of individuals using paid preparers for their 2004 taxes: 67.9%
Here:
68%
State:
65%
(% for various income ranges: 62.7% for AGIs below $10k, 70.4% for AGIs $10k-25k, 70.4% for AGIs $25k-50k, 61.9% for AGIs $50k-75k, 68.9% for AGIs $75k-100k, 87.9% for AGIs over 100k)
Household received Food Stamps/SNAP in the past 12 months: 163 Household did not receive Food Stamps/SNAP in the past 12 months: 934
Women who had a birth in the past 12 months: 34 (39 now married, 0 unmarried) Women who did not have a birth in the past 12 months: 638 (235 now married, 403 unmarried)
Housing units in zip code 36311 with a mortgage: 460 (42 second mortgage, 43 both second mortgage and home equity loan) Houses without a mortgage: 8
Median monthly owner costs for units with a mortgage: $1,037 Median monthly owner costs for units without a mortgage: $343
Residents with income below the poverty level in 2022:
This zip code:
27.9%
Whole state:
16.2%
Residents with income below 50% of the poverty level in 2022:
This zip code:
16.1%
Whole state:
8.6%
Median number of rooms in houses and condos:
Here:
5.9
State:
6.5
Median number of rooms in apartments:
Here:
5.6
State:
4.7
Notable locations in this zip code not listed on our city pages
Churches in zip code 36311 include: Mount Olive Church (A), Saint Louis Church (B), Salem Baptist Church (C), Center Ridge Baptist Church (D), Springfield Church (E), Elamville Church (F), Emmanuel Church (G), Triumph Church (H), Concord Church (I). Display/hide their locations on the map
Cemeteries: Danner Cemetery (1), Dansby Cemetery (2), Mount Olive Cemetery (3), Sammon Cemetery (4), Mossy Grove Cemetery (5), Adam Cemetery (6), Center Ridge Cemetery (7). Display/hide their locations on the map
Streams, rivers, and creeks: Bowden Mill Creek (A), Roe Branch (B), Lithco Creek (C), Little Creek (D), Johnson Creek (E), Huckleberry Creek (F), Sikes Creek (G), Dry Branch (H), Danner Creek (I). Display/hide their locations on the map
Size of family households: 353 2-persons, 275 3-persons, 123 4-persons, 28 5-persons, 16 6-persons
Size of nonfamily households: 253 1-person, 50 2-persons
277 married couples with children.
256 single-parent households (73 men, 183 women).
94.9% of residents of 36311 zip code speak English at home.
4.6% of residents speak Spanish at home (69% very well, 18% well, 8% not well, 6% not at all).
0.4% of residents speak other Indo-European language at home (80% very well, 20% well).
Foreign born population: 65 (2.4%) (27.6% of them are naturalized citizens)
This zip code:
2.4%
Whole state:
3.8%
66%Honduras
15%El Salvador
10%Venezuela
3%France
39%American
10%English
6%Irish
4%German
2%European
1%Italian
1%Scotch-Irish
Year of entry for the foreign-born population
112010 or later
442000 to 2009
71990 to 1999
3Before 1990
Facilities with environmental interests located in this zip code:
ARITON HIGH SCHOOL (264 CREEL RICHARDSON RD in ARITON, AL)
(Geographic Names Information System) (National Center for Education Statistics) - STATE ID-0010 Conditionally Exempt Small Quantity Generators, less than 100 kg/month of hazardous waste (Resource Conservation and Recovery Act (tracking hazardous waste)) Organizations: DALE COUNTY (SCHOOL DISTRICT)
Alternative names: ARITON SCHOOL
ARITON LAGOON (ARITON TOWN OF WW AND SB in ARITON, AL)
National Pollutant Discharge Elimination System NON-MAJOR (Tracking pollutant discharge elimination systems) - permit Business SIC classification: SEWERAGE SYSTEMS Alternative names: ARITON TOWN OF WW AND SB, ARITON TOWN OF WWSB LAGOON
K AND D FARMS (KENNY BAKER in ARITON, AL)
National Pollutant Discharge Elimination System NON-MAJOR (Tracking pollutant discharge elimination systems) - permit Business SIC classification: NONCLASSIFIABLE ESTABLISHMENTS Alternative names: D AND D FARMS POULTRY BROILER
Housing units lacking complete plumbing facilities: 4.2% Housing units lacking complete kitchen facilities: 3.7%
91.2%Electricity
5.9%Bottled, tank, or LP gas
1.2%Wood
0.9%No fuel used
0.7%Other fuel
Population in 1990: 1,434. Population change in the 1990s: +1,551 (+108.2%).
Place of birth for U.S.-born residents:
This state: 2,137
Northeast: 3
Midwest: 87
South: 436
West: 42
72% of the 36311 zip code residents lived in the same house 5 years ago. Out of people who lived in different houses, 50% lived in this county. Out of people who lived in different counties, 50% lived in Alabama.
91% of the 36311 zip code residents lived in the same house 1 year ago. Out of people who lived in different houses, 44% moved from this county. Out of people who lived in different houses, 48% moved from different county within same state. Out of people who lived in different houses, 3% moved from different state. Out of people who lived in different houses, 2% moved from abroad.
Private vs. public school enrollment:
Students in private schools in grades 1 to 8 (elementary and middle school):
Here:
0.0%
Alabama:
14.7%
Students in private schools in grades 9 to 12 (high school): 2
Here:
3.2%
Alabama:
16.3%
Students in private undergraduate colleges:
Here:
0.0%
Alabama:
14.6%
Occupation by median earnings in the past 12 months ($)
131,487Architecture and engineering occupations
107,569Management occupations
65,660Health technologists and technicians
52,866Installation, maintenance, and repair occupations
52,727Education, training, and library occupations
49,945Production occupations
Top industries in this zip code by the number of employees in 2005:
Construction: Highway, Street, and Bridge Construction (100-249 employees: 1 establishment)
Wholesale Trade: Tire and Tube Merchant Wholesalers (20-49: 1)
Other Services (except Public Administration): Religious Organizations (1-4: 4)
Construction: Commercial and Institutional Building Construction (5-9: 1)
Health Care and Social Assistance: Other Residential Care Facilities (5-9: 1)
Fatal accident statistics in 2013:
Fatal accident count: 3
Vehicles involved in fatal accidents: 3
Fatal accidents caused by drunken drivers: 1
Fatalities: 3
Persons involved in fatal accidents: 4
Pedestrians involved in fatal accidents: 0
Fatal accident statistics in 2012:
Fatal accident count: 1
Vehicles involved in fatal accidents: 1
Fatal accidents caused by drunken drivers: 0
Fatalities: 1
Persons involved in fatal accidents: 1
Pedestrians involved in fatal accidents: 0
Home Mortgage Disclosure Act Aggregated Statistics For Year 2003 (Based on 1 partial tract)
A) FHA, FSA/RHS & VA Home Purchase Loans
B) Conventional Home Purchase Loans
C) Refinancings
D) Home Improvement Loans
F) Non-occupant Loans on < 5 Family Dwellings (A B C & D)
Number
Average Value
Number
Average Value
Number
Average Value
Number
Average Value
Number
Average Value
LOANS ORIGINATED
1
$74,880
10
$60,676
32
$78,682
6
$19,490
6
$34,022
APPLICATIONS APPROVED, NOT ACCEPTED
0
$0
1
$8,720
3
$96,083
0
$0
1
$8,720
APPLICATIONS DENIED
1
$38,470
6
$27,612
12
$80,525
2
$32,055
0
$0
APPLICATIONS WITHDRAWN
1
$37,950
2
$75,140
6
$103,093
0
$0
1
$24,110
FILES CLOSED FOR INCOMPLETENESS
0
$0
1
$63,090
3
$177,807
1
$25,650
0
$0
Aggregated Statistics For Year 2002 (Based on 1 partial tract)
A) FHA, FSA/RHS & VA Home Purchase Loans
B) Conventional Home Purchase Loans
C) Refinancings
D) Home Improvement Loans
F) Non-occupant Loans on < 5 Family Dwellings (A B C & D)
Number
Average Value
Number
Average Value
Number
Average Value
Number
Average Value
Number
Average Value
LOANS ORIGINATED
2
$67,190
11
$55,626
30
$76,149
10
$34,775
4
$46,160
APPLICATIONS APPROVED, NOT ACCEPTED
0
$0
5
$40,212
3
$64,283
0
$0
0
$0
APPLICATIONS DENIED
0
$0
11
$27,324
7
$66,384
0
$0
1
$7,690
APPLICATIONS WITHDRAWN
0
$0
2
$61,805
2
$48,215
0
$0
1
$36,930
FILES CLOSED FOR INCOMPLETENESS
0
$0
1
$23,080
1
$79,500
0
$0
0
$0
Aggregated Statistics For Year 2001 (Based on 1 partial tract)
A) FHA, FSA/RHS & VA Home Purchase Loans
B) Conventional Home Purchase Loans
C) Refinancings
D) Home Improvement Loans
F) Non-occupant Loans on < 5 Family Dwellings (A B C & D)
Number
Average Value
Number
Average Value
Number
Average Value
Number
Average Value
Number
Average Value
LOANS ORIGINATED
2
$66,420
18
$39,750
23
$60,879
12
$17,994
7
$22,201
APPLICATIONS APPROVED, NOT ACCEPTED
0
$0
3
$39,323
1
$52,320
2
$39,750
1
$33,850
APPLICATIONS DENIED
1
$74,370
21
$34,389
9
$58,300
2
$12,565
2
$15,385
APPLICATIONS WITHDRAWN
0
$0
1
$47,190
2
$50,010
1
$5,130
0
$0
FILES CLOSED FOR INCOMPLETENESS
0
$0
0
$0
0
$0
0
$0
0
$0
Aggregated Statistics For Year 2000 (Based on 1 partial tract)
A) FHA, FSA/RHS & VA Home Purchase Loans
B) Conventional Home Purchase Loans
C) Refinancings
D) Home Improvement Loans
F) Non-occupant Loans on < 5 Family Dwellings (A B C & D)
Number
Average Value
Number
Average Value
Number
Average Value
Number
Average Value
Number
Average Value
LOANS ORIGINATED
1
$73,340
15
$64,557
34
$51,199
9
$18,066
9
$22,967
APPLICATIONS APPROVED, NOT ACCEPTED
1
$17,440
6
$40,947
1
$6,150
0
$0
1
$30,260
APPLICATIONS DENIED
1
$67,190
13
$33,536
7
$47,480
1
$2,050
1
$34,360
APPLICATIONS WITHDRAWN
1
$25,130
1
$12,310
2
$38,210
0
$0
0
$0
FILES CLOSED FOR INCOMPLETENESS
0
$0
0
$0
1
$61,040
0
$0
0
$0
Aggregated Statistics For Year 1999 (Based on 1 partial tract)
A) FHA, FSA/RHS & VA Home Purchase Loans
B) Conventional Home Purchase Loans
C) Refinancings
D) Home Improvement Loans
E) Loans on Dwellings For 5+ Families
F) Non-occupant Loans on < 5 Family Dwellings (A B C & D)

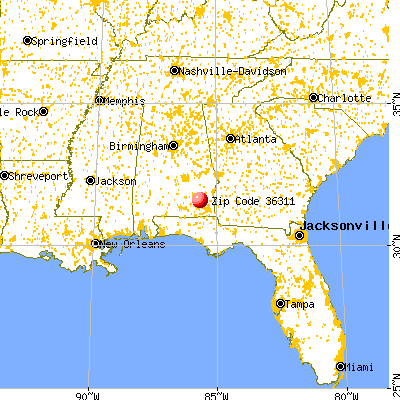


 Nearest zip codes: 36010, 36017, 36360, 36374, 36048, 36346.


