Estimated zip code population in 2022: 5,857 Zip code population in 2010: 5,431 Zip code population in 2000: 4,515
Houses and condos: 2,262 Renter-occupied apartments: 180
% of renters here:
9%
State:
30%
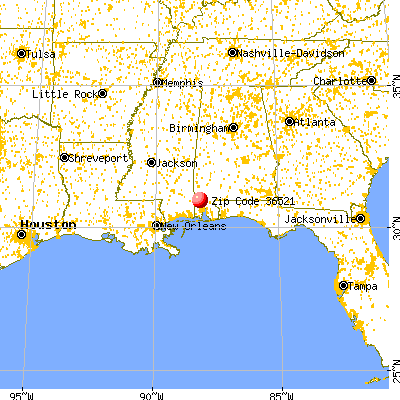
March 2022 cost of living index in zip code 36521: 81.6 (low, U.S. average is 100)
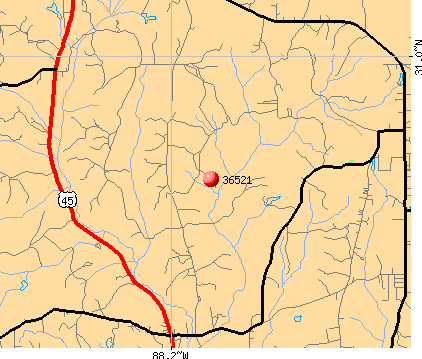
Land area: 144.5 sq. mi. Water area: 0.5 sq. mi.
Population density: 41 people per square mile
(very low).
OSM Map
General Map
Google Map
MSN Map
OSM Map
General Map
Google Map
MSN Map
OSM Map
General Map
Google Map
MSN Map
OSM Map
General Map
Google Map
MSN Map
Please wait while loading the map...
Real estate property taxes paid for housing units in 2022:
This zip code:
0.5% ($833)
Alabama:
0.4% ($718)
Median real estate property taxes paid for housing units with mortgages in 2022: $974 (0.5%) Median real estate property taxes paid for housing units with no mortgage in 2022: $382 (0.4%)
Business Search- 14 Million verified businesses
Males: 2,857
(48.8%)
Females: 2,999
(51.2%)
For population 25 years and over in 36521:
High school or higher: 81.0%
Bachelor's degree or higher: 14.3%
Graduate or professional degree: 4.3%
Unemployed: 2.3%
Mean travel time to work (commute): 42.4 minutes
For population 15 years and over in 36521:
Never married: 24.3%
Now married: 65.1%
Separated: 0.4%
Widowed: 4.4%
Divorced: 5.8%
Zip code 36521 compared to state average:
Unemployed percentage below state average.
Black race population percentage significantly below state average.
Hispanic race population percentage below state average.
Foreign-born population percentage below state average.
Renting percentage significantly below state average.
Length of stay since moving in above state average.
Number of college students significantly below state average.
Percentage of population with a bachelor's degree or higher below state average.
Averages for the 2020 tax year for zip code 36521, filed in 2021:
Average Adjusted Gross Income (AGI) in 2020: $55,899 (Individual Income Tax Returns)
Here:
$55,899
State:
$63,984
Salary/wage: $54,003 (reported on 81.7% of returns)
Here:
$54,003
State:
$52,834
(% of AGI for various income ranges: 1085.3% for AGIs below $25k, 3571.3% for AGIs $25k-50k, 7046.5% for AGIs $50k-75k, 11077.9% for AGIs $75k-100k, 16005.0% for AGIs $100k-200k)
Taxable interest for individuals: $805 (reported on 19.2% of returns)
This zip code:
$805
Alabama:
$1,615
(% of AGI for various income ranges: 5.8% for AGIs below $25k, 19.2% for AGIs $25k-50k, 9.1% for AGIs $50k-75k, 87.1% for AGIs $75k-100k, 35.5% for AGIs $100k-200k)
Ordinary dividends: $2,375 (reported on 7.7% of returns)
Here:
$2,375
State:
$7,660
(% of AGI for various income ranges: 6.8% for AGIs below $25k, 16.9% for AGIs $25k-50k, 22.6% for AGIs $50k-75k, 47.9% for AGIs $75k-100k, 78.0% for AGIs $100k-200k)
Net capital gain/loss in AGI: +$10,673 (reported on 7.2% of returns)
Here:
+$10,673
State:
+$23,528
(% of AGI for various income ranges: 8.8% for AGIs below $25k, 25.4% for AGIs $25k-50k, 32.6% for AGIs $50k-75k, 36.4% for AGIs $75k-100k, 663.0% for AGIs $100k-200k)
Profit/loss from business: +$5,111 (reported on 17.8% of returns)
Here:
+$5,111
State:
+$9,534
(% of AGI for various income ranges: 150.0% for AGIs below $25k, 141.7% for AGIs $50k-75k, 141.4% for AGIs $75k-100k, 286.5% for AGIs $100k-200k)
Taxable individual retirement arrangement distribution: $16,207 (reported on 6.7% of returns)
36521:
$16,207
Alabama:
$19,004
(% of AGI for various income ranges: 38.4% for AGIs below $25k, 109.0% for AGIs $25k-50k, 310.4% for AGIs $50k-75k, 455.5% for AGIs $100k-200k)
Total itemized deductions: $33,514 (reported on 6.7% of returns)
Here:
$33,514
State:
$37,338
(% of AGI for various income ranges: 123.9% for AGIs below $25k, 480.0% for AGIs $50k-75k, 488.6% for AGIs $75k-100k, 1099.0% for AGIs $100k-200k)
Charity contributions: $17,230 (reported on 4.8% of returns)
Here:
$17,230
State:
$18,005
(% of AGI for various income ranges: 259.1% for AGIs $50k-75k, 563.5% for AGIs $100k-200k)
Taxes paid: $5,564 (reported on 5.3% of returns)
36521:
$5,564
State:
$6,484
(% of AGI for various income ranges: 90.9% for AGIs $50k-75k, 201.5% for AGIs $100k-200k)
Earned income credit: $2,620 (reported on 23.6% of returns)
Here:
$2,620
State:
$2,628
(% of AGI for various income ranges: 150.4% for AGIs below $25k, 109.5% for AGIs $25k-50k)
Percentage of individuals using paid preparers for their 2020 taxes: 94.7%
Here:
95%
State:
93%
(% for various income ranges: 95.8% for AGIs below $25k, 93.9% for AGIs $25k-50k, 93.8% for AGIs $50k-75k, 90.9% for AGIs $75k-100k, 96.6% for AGIs $100k-200k, 100.0% for AGIs over 200k)
Averages for the 2012 tax year for zip code 36521, filed in 2013:
Average Adjusted Gross Income (AGI) in 2012: $43,325 (Individual Income Tax Returns)
Here:
$43,325
State:
$52,001
Salary/wage: $42,758 (reported on 82.6% of returns)
Here:
$42,758
State:
$43,822
(% of AGI for various income ranges: 69.0% for AGIs below $25k, 81.9% for AGIs $25k-50k, 85.4% for AGIs $50k-75k, 86.6% for AGIs $75k-100k, 79.6% for AGIs $100k-200k)
Taxable interest for individuals: $593 (reported on 20.3% of returns)
This zip code:
$593
Alabama:
$1,592
(% of AGI for various income ranges: 0.5% for AGIs below $25k, 0.4% for AGIs $25k-50k, 0.2% for AGIs $50k-75k, 0.1% for AGIs $75k-100k, 0.3% for AGIs $100k-200k)
Ordinary dividends: $1,133 (reported on 8.7% of returns)
Here:
$1,133
State:
$5,697
(% of AGI for various income ranges: 0.3% for AGIs below $25k, 0.6% for AGIs $25k-50k, 0.1% for AGIs $75k-100k, 0.1% for AGIs $100k-200k)
Net capital gain/loss in AGI: +$312 (reported on 3.9% of returns)
Here:
+$312
State:
+$13,286
(% of AGI for various income ranges: 0.2% for AGIs $50k-75k)
Profit/loss from business: +$6,255 (reported on 18.4% of returns)
Here:
+$6,255
State:
+$9,151
(% of AGI for various income ranges: 13.8% for AGIs below $25k, 1.8% for AGIs $25k-50k, 1.3% for AGIs $50k-75k, 0.9% for AGIs $75k-100k, 0.7% for AGIs $100k-200k)
Taxable individual retirement arrangement distribution: $11,269 (reported on 6.3% of returns)
36521:
$11,269
Alabama:
$14,992
(% of AGI for various income ranges: 1.6% for AGIs below $25k, 2.0% for AGIs $25k-50k, 2.7% for AGIs $50k-75k, 1.7% for AGIs $100k-200k)
Total itemized deductions: $18,765 (25% of AGI, reported on 26.6% of returns)
Here:
$18,765
State:
$21,388
Here:
25.3% of AGI
State:
20.1% of AGI
(% of AGI for various income ranges: 6.2% for AGIs below $25k, 10.9% for AGIs $25k-50k, 13.0% for AGIs $50k-75k, 12.6% for AGIs $75k-100k, 12.2% for AGIs $100k-200k)
Charity contributions: $3,874 (reported on 20.8% of returns)
Here:
$3,874
State:
$5,925
(% of AGI for various income ranges: 1.1% for AGIs below $25k, 1.6% for AGIs $25k-50k, 2.1% for AGIs $50k-75k, 1.9% for AGIs $75k-100k, 2.1% for AGIs $100k-200k)
Taxes paid: $3,778 (reported on 26.1% of returns)
36521:
$3,778
State:
$5,272
(% of AGI for various income ranges: 0.6% for AGIs below $25k, 1.3% for AGIs $25k-50k, 2.3% for AGIs $50k-75k, 2.4% for AGIs $75k-100k, 3.6% for AGIs $100k-200k)
Earned income credit: $2,679 (reported on 28.0% of returns)
Here:
$2,679
State:
$2,646
(% of AGI for various income ranges: 12.0% for AGIs below $25k, 1.5% for AGIs $25k-50k)
Percentage of individuals using paid preparers for their 2012 taxes: 65.7%
Here:
66%
State:
60%
(% for various income ranges: 63.6% for AGIs below $25k, 66.7% for AGIs $25k-50k, 67.6% for AGIs $50k-75k, 66.7% for AGIs $75k-100k, 68.8% for AGIs $100k-200k)
Averages for the 2004 tax year for zip code 36521, filed in 2005:
Average Adjusted Gross Income (AGI) in 2004: $34,429 (Individual Income Tax Returns)
Here:
$34,429
State:
$42,302
Salary/wage: $34,048 (reported on 84.0% of returns)
Here:
$34,048
State:
$36,626
(% of AGI for various income ranges: 82.1% for AGIs below $10k, 71.4% for AGIs $10k-25k, 84.7% for AGIs $25k-50k, 87.2% for AGIs $50k-75k, 90.6% for AGIs $75k-100k, 75.3% for AGIs over 100k)
Taxable interest for individuals: $644 (reported on 28.6% of returns)
This zip code:
$644
Alabama:
$1,827
(% of AGI for various income ranges: 1.3% for AGIs below $10k, 1.2% for AGIs $10k-25k, 0.4% for AGIs $25k-50k, 0.3% for AGIs $50k-75k, 0.3% for AGIs $75k-100k, 0.7% for AGIs over 100k)
Taxable dividends: $651 (reported on 9.4% of returns)
Here:
$651
State:
$4,206
(% of AGI for various income ranges: 0.2% for AGIs $10k-25k, 0.2% for AGIs $25k-50k, 0.1% for AGIs $50k-75k, 0.3% for AGIs $75k-100k, 0.3% for AGIs over 100k)
Net capital gain/loss: +$2,660 (reported on 5.8% of returns)
Here:
+$2,660
State:
+$13,031
(% of AGI for various income ranges: 0.2% for AGIs $10k-25k, 0.3% for AGIs $25k-50k, -0.1% for AGIs $50k-75k, 1.6% for AGIs $75k-100k, 1.1% for AGIs over 100k)
Profit/loss from business: +$6,228 (reported on 17.1% of returns)
Here:
+$6,228
State:
+$8,302
(% of AGI for various income ranges: 22.3% for AGIs below $10k, 11.1% for AGIs $10k-25k, 2.4% for AGIs $25k-50k, 0.7% for AGIs $50k-75k, 0.2% for AGIs $75k-100k)
IRA payment deduction: $2,125 (reported on 0.9% of returns)
36521:
$2,125
Alabama:
$3,006
Total itemized deductions: $16,212 (28% of AGI, reported on 27.2% of returns)
Here:
$16,212
State:
$17,623
Here:
27.7% of AGI
State:
20.8% of AGI
(% of AGI for various income ranges: 11.5% for AGIs below $10k, 8.1% for AGIs $10k-25k, 13.0% for AGIs $25k-50k, 12.1% for AGIs $50k-75k, 13.1% for AGIs $75k-100k, 19.0% for AGIs over 100k)
Charity contributions deductions: $2,910 (5% of AGI, reported on 23.3% of returns)
Here:
$2,910
State:
$4,768
Here:
4.8% of AGI
State:
5.4% of AGI
(% of AGI for various income ranges: 1.5% for AGIs $10k-25k, 1.8% for AGIs $25k-50k, 2.0% for AGIs $50k-75k, 2.4% for AGIs $75k-100k, 2.9% for AGIs over 100k)
Total tax: $3,644 (reported on 70.0% of returns)
36521:
$3,644
State:
$6,905
(% of AGI for various income ranges: 4.0% for AGIs below $10k, 3.7% for AGIs $10k-25k, 5.3% for AGIs $25k-50k, 7.7% for AGIs $50k-75k, 9.8% for AGIs $75k-100k, 13.9% for AGIs over 100k)
Earned income credit: $2,086 (reported on 26.2% of returns)
Here:
$2,086
State:
$2,048
Percentage of individuals using paid preparers for their 2004 taxes: 70.3%
Here:
70%
State:
65%
(% for various income ranges: 63.4% for AGIs below $10k, 71.7% for AGIs $10k-25k, 70.3% for AGIs $25k-50k, 74.9% for AGIs $50k-75k, 73.5% for AGIs $75k-100k, 72.4% for AGIs over 100k)
Likely homosexual households (counted as self-reported same-sex unmarried-partner households)
Lesbian couples: 0.4% of all households
Gay men: 0.0% of all households
Household received Food Stamps/SNAP in the past 12 months: 242 Household did not receive Food Stamps/SNAP in the past 12 months: 1,841
Women who had a birth in the past 12 months: 123 (140 now married, 0 unmarried) Women who did not have a birth in the past 12 months: 1,371 (795 now married, 574 unmarried)
Housing units in zip code 36521 with a mortgage: 1,058 (35 second mortgage, 37 both second mortgage and home equity loan) Houses without a mortgage: 70
Median monthly owner costs for units with a mortgage: $1,256 Median monthly owner costs for units without a mortgage: $388
Residents with income below the poverty level in 2022:
This zip code:
7.7%
Whole state:
16.2%
Residents with income below 50% of the poverty level in 2022:
This zip code:
3.5%
Whole state:
8.6%
Median number of rooms in houses and condos:
Here:
6.1
State:
6.5
Median number of rooms in apartments:
Here:
4.6
State:
4.7
Notable locations in this zip code not listed on our city pages
Notable locations in zip code 36521: Georgetown Fellowship Volunteer Fire Department Station 1 (A), Georgetown Fellowship Volunteer Fire Department Station 2 (B), Turnerville Volunteer Fire Department Station 1 (C). Display/hide their locations on the map
Churches in zip code 36521 include: Turnerville Church (A), Whatley Church (B), Turnerville Church (C), Starlight Full Gospel Church (D), Lambert Grove Church (E), Calvary Church (F), Arden Church (G), God Church (H), Gulf Crest Church (I). Display/hide their locations on the map
Cemeteries: Lott Cemetery (1), Byrd Memorial Cemetery (2), Gulf Crest Cemetery (3), Old Providence Cemetery (4), Turnerville Cemetery (5), Whatley Holiness Cemetery (6), Fellowship Baptist Church Cemetery (7). Display/hide their locations on the map
Streams, rivers, and creeks: Spring Branch (A), Sand Hill Creek (B), Reedy Branch (C), Mill Branch (D), Sweetwater Branch (E), Long Branch (F), Log Creek (G), Lewis Williams Branch (H), Drinking Branch (I). Display/hide their locations on the map
Size of family households: 625 2-persons, 720 3-persons, 288 4-persons, 63 5-persons, 79 6-persons, 16 7-or-more-persons
Size of nonfamily households: 264 1-person, 43 2-persons
1,104 married couples with children.
66 single-parent households (66 women).
97.8% of residents of 36521 zip code speak English at home.
0.2% of residents speak Spanish at home (100% not well).
1.3% of residents speak other Indo-European language at home (100% very well).
Foreign born population: 123 (2.1%) (57.1% of them are naturalized citizens)
This zip code:
2.1%
Whole state:
3.8%
80%Bhutan
19%Italy
24%American
16%English
10%German
2%European
2%Irish
1%Portuguese
0%Scotch-Irish
Year of entry for the foreign-born population
02010 or later
482000 to 2009
01990 to 1999
70Before 1990
Facilities with environmental interests located in this zip code:
CHUNCHULA INVESTMENT PIT 1 (ROBERT SMITH DBA CHUNCHULA INV in CHUNCHULA, AL)
National Pollutant Discharge Elimination System NON-MAJOR (Tracking pollutant discharge elimination systems) - permit Business SIC classification: NONCLASSIFIABLE ESTABLISHMENTS Alternative names: SMITH ROBERT, SMITH ROBERT CHUNCHULA PIT 1
CIC PIT (BOBBY SMITH in GEORGETOWN, AL)
National Pollutant Discharge Elimination System NON-MAJOR (Tracking pollutant discharge elimination systems) - permit Business SIC classification: CONSTRUCTION SAND AND GRAVEL Organizations: SMITH BOBBY (CONTACT/OPERATOR)
Alternative names: BOBBY SMITY C I C PIT, SMITH BOBBY, SMITH BOBBY C I C PIT
PLAINS MARKETING LP (12515 ROBERTS RD in CHUNCHULA, AL)
AIR MINOR (AIRS/AFS) CRITERIA AND HAZARDOUS AIR POLLUTANT INVENTORY (Inventory of air pollution sources) Business SIC classification: CRUDE PETROLEUM PIPELINES; PETROLEUM BULK STATIONS AND TERMINALS Business NAICS classification: PIPELINE TRANSPORTATION OF CRUDE OIL. Alternative names: EOTT ENERGY OPERATING LIMITED PARTNERSHIP
MADDOX COMPLAINT (AT THE FOOT OF TIMBER RIDGE RD in CHUNCHULA, AL)
MOBILE CO COMM CHUNCHULA SLF (U S HIGHWAY 45 AT MILEPOST 24 in CHUNCHULA, AL)
National Pollutant Discharge Elimination System NON-MAJOR (Tracking pollutant discharge elimination systems) - permit Business SIC classification: REFUSE SYSTEMS Organizations: MOBILE CO ENVIRONMENTAL DEPT (CONTACT/OWNER)
Alternative names: MOBILE CO ENVIRONMENTAL DEPT
ADOT STPAA 7511 601 (ALABAMA DEPARTMENT OF TRANSPOR in CHUNCHULA, AL)
National Pollutant Discharge Elimination System NON-MAJOR (Tracking pollutant discharge elimination systems) - permit Business SIC classification: HIGHWAY AND STREET CONSTRUCTION, EXCEPT ELEVATED HIGHWAYS Alternative names: ADOT STPAA 7571 601
ALABAMA MERIT ENERGY ( in CHUNCHULA, AL)
National Pollutant Discharge Elimination System NON-MAJOR (Tracking pollutant discharge elimination systems) - permit Business SIC classification: NONCLASSIFIABLE ESTABLISHMENTS
CHUNCHULA LANDFILL ( in CHUNCHULA, AL)
National Pollutant Discharge Elimination System NON-MAJOR (Tracking pollutant discharge elimination systems) - permit
MCR2000111 (MOBILE COUNTY COMMISSION in CHUNCHULA, AL)
National Pollutant Discharge Elimination System NON-MAJOR (Tracking pollutant discharge elimination systems) - permit Business SIC classification: HIGHWAY AND STREET CONSTRUCTION, EXCEPT ELEVATED HIGHWAYS Alternative names: MOBILE CO MCR 2000 111
MORRIS INDUSTRIAL CORPORATION (13400 CELESTE ROAD in CHUNCHULA, AL)
(Resource Conservation and Recovery Act (tracking hazardous waste)) Business NAICS classification: OTHER COMMERCIAL AND SERVICE INDUSTRY MACHINERY MANUFACTURING.
Housing units lacking complete plumbing facilities: 1.3% Housing units lacking complete kitchen facilities: 3.5%
83.4%Electricity
9.0%Utility gas
3.7%Wood
3.4%Bottled, tank, or LP gas
0.7%Fuel oil, kerosene, etc.
Population in 1990: 1,322. Population change in the 1990s: +3,193 (+241.5%).
Place of birth for U.S.-born residents:
This state: 4,261
Northeast: 49
Midwest: 103
South: 1,179
West: 127
71% of the 36521 zip code residents lived in the same house 5 years ago. Out of people who lived in different houses, 88% lived in this county. Out of people who lived in different counties, 50% lived in Alabama.
97% of the 36521 zip code residents lived in the same house 1 year ago. Out of people who lived in different houses, 78% moved from this county. Out of people who lived in different houses, 28% moved from different state.
Private vs. public school enrollment:
Students in private schools in grades 1 to 8 (elementary and middle school):
Here:
0.0%
Alabama:
14.7%
Students in private schools in grades 9 to 12 (high school): 11
Here:
3.1%
Alabama:
16.3%
Students in private undergraduate colleges: 8
Here:
15.5%
Alabama:
14.6%
Occupation by median earnings in the past 12 months ($)
108,826Material moving occupations
82,870Health diagnosing and treating practitioners and other technical occupations
65,912Production occupations
64,104Management occupations
57,491Law enforcement workers including supervisors
56,784Installation, maintenance, and repair occupations
Top industries in this zip code by the number of employees in 2005:
Construction: Industrial Building Construction (500-999 employees: 1 establishment)
Mining: Natural Gas Liquid Extraction (20-49: 1, 5-9: 1)
Construction: Electrical Contractors (10-19: 1)
Construction: Highway, Street, and Bridge Construction (10-19: 1)
Construction: Site Preparation Contractors (5-9: 1, 1-4: 1)
Construction: Roofing Contractors (5-9: 1)
Other Services (except Public Administration): Religious Organizations (1-4: 3)
Fatal accident statistics in 2014:
Fatal accident count: 4
Vehicles involved in fatal accidents: 7
Fatal accidents caused by drunken drivers: 1
Fatalities: 4
Persons involved in fatal accidents: 15
Pedestrians involved in fatal accidents: 0
Fatal accident statistics in 2012:
Fatal accident count: 1
Vehicles involved in fatal accidents: 1
Fatal accidents caused by drunken drivers: 0
Fatalities: 1
Persons involved in fatal accidents: 1
Pedestrians involved in fatal accidents: 0
Home Mortgage Disclosure Act Aggregated Statistics For Year 2009 (Based on 3 partial tracts)
A) FHA, FSA/RHS & VA Home Purchase Loans
B) Conventional Home Purchase Loans
C) Refinancings
D) Home Improvement Loans
F) Non-occupant Loans on < 5 Family Dwellings (A B C & D)
G) Loans On Manufactured Home Dwelling (A B C & D)
Number
Average Value
Number
Average Value
Number
Average Value
Number
Average Value
Number
Average Value
Number
Average Value
LOANS ORIGINATED
18
$118,735
14
$73,649
56
$132,978
4
$8,560
5
$56,552
10
$32,771
APPLICATIONS APPROVED, NOT ACCEPTED
3
$84,190
4
$55,922
6
$138,698
0
$0
0
$0
5
$48,332
APPLICATIONS DENIED
4
$86,872
11
$51,158
33
$130,492
6
$56,870
1
$38,750
15
$45,265
APPLICATIONS WITHDRAWN
6
$125,192
3
$160,600
23
$141,969
0
$0
1
$75,680
2
$64,155
FILES CLOSED FOR INCOMPLETENESS
1
$74,620
0
$0
5
$138,286
0
$0
1
$157,910
1
$50,250
Aggregated Statistics For Year 2008 (Based on 3 partial tracts)
A) FHA, FSA/RHS & VA Home Purchase Loans
B) Conventional Home Purchase Loans
C) Refinancings
D) Home Improvement Loans
F) Non-occupant Loans on < 5 Family Dwellings (A B C & D)
G) Loans On Manufactured Home Dwelling (A B C & D)
Number
Average Value
Number
Average Value
Number
Average Value
Number
Average Value
Number
Average Value
Number
Average Value
LOANS ORIGINATED
15
$120,408
27
$105,426
50
$113,218
9
$30,568
4
$85,378
19
$37,911
APPLICATIONS APPROVED, NOT ACCEPTED
1
$22,590
7
$75,466
13
$98,398
2
$28,130
1
$47,660
7
$46,719
APPLICATIONS DENIED
5
$110,394
16
$75,379
50
$121,362
18
$64,594
1
$59,260
17
$58,277
APPLICATIONS WITHDRAWN
3
$103,267
5
$110,660
20
$121,792
3
$67,470
1
$101,730
4
$78,060
FILES CLOSED FOR INCOMPLETENESS
1
$115,350
3
$76,433
5
$157,874
1
$57,160
1
$63,060
0
$0
Aggregated Statistics For Year 2007 (Based on 3 partial tracts)
A) FHA, FSA/RHS & VA Home Purchase Loans
B) Conventional Home Purchase Loans
C) Refinancings
D) Home Improvement Loans
F) Non-occupant Loans on < 5 Family Dwellings (A B C & D)
G) Loans On Manufactured Home Dwelling (A B C & D)
Number
Average Value
Number
Average Value
Number
Average Value
Number
Average Value
Number
Average Value
Number
Average Value
LOANS ORIGINATED
9
$108,370
43
$110,620
70
$108,878
14
$41,789
8
$72,551
12
$58,342
APPLICATIONS APPROVED, NOT ACCEPTED
0
$0
8
$100,750
14
$87,414
4
$28,430
0
$0
7
$49,426
APPLICATIONS DENIED
1
$49,100
25
$71,888
55
$110,431
17
$53,370
2
$99,510
20
$53,290
APPLICATIONS WITHDRAWN
1
$67,770
6
$147,218
19
$118,135
6
$63,543
0
$0
3
$35,270
FILES CLOSED FOR INCOMPLETENESS
1
$87,250
2
$107,605
13
$122,965
0
$0
0
$0
1
$65,830
Aggregated Statistics For Year 2006 (Based on 3 partial tracts)
A) FHA, FSA/RHS & VA Home Purchase Loans
B) Conventional Home Purchase Loans
C) Refinancings
D) Home Improvement Loans
F) Non-occupant Loans on < 5 Family Dwellings (A B C & D)
G) Loans On Manufactured Home Dwelling (A B C & D)
Number
Average Value
Number
Average Value
Number
Average Value
Number
Average Value
Number
Average Value
Number
Average Value
LOANS ORIGINATED
8
$109,325
65
$104,249
60
$103,481
10
$28,549
5
$47,398
20
$43,215
APPLICATIONS APPROVED, NOT ACCEPTED
1
$46,050
12
$82,452
16
$88,829
3
$31,897
2
$71,840
8
$47,925
APPLICATIONS DENIED
4
$52,660
30
$75,732
62
$89,632
23
$32,817
4
$66,460
29
$48,514
APPLICATIONS WITHDRAWN
1
$83,350
10
$101,837
26
$103,777
3
$78,943
0
$0
1
$78,140
FILES CLOSED FOR INCOMPLETENESS
0
$0
2
$71,310
10
$105,437
0
$0
0
$0
0
$0
Aggregated Statistics For Year 2005 (Based on 3 partial tracts)
A) FHA, FSA/RHS & VA Home Purchase Loans
B) Conventional Home Purchase Loans
C) Refinancings
D) Home Improvement Loans
F) Non-occupant Loans on < 5 Family Dwellings (A B C & D)
G) Loans On Manufactured Home Dwelling (A B C & D)
Number
Average Value
Number
Average Value
Number
Average Value
Number
Average Value
Number
Average Value
Number
Average Value
LOANS ORIGINATED
13
$99,912
58
$77,683
62
$85,107
8
$28,329
6
$68,358
24
$41,280
APPLICATIONS APPROVED, NOT ACCEPTED
0
$0
14
$58,811
20
$73,887
2
$43,870
1
$50,220
9
$46,269
APPLICATIONS DENIED
6
$71,730
35
$59,107
68
$84,832
17
$41,957
4
$38,312
29
$53,305
APPLICATIONS WITHDRAWN
1
$144,310
11
$62,563
36
$105,860
8
$121,028
2
$132,530
3
$74,580
FILES CLOSED FOR INCOMPLETENESS
1
$84,250
2
$110,665
10
$94,823
0
$0
0
$0
0
$0
Aggregated Statistics For Year 2004 (Based on 3 partial tracts)
A) FHA, FSA/RHS & VA Home Purchase Loans
B) Conventional Home Purchase Loans
C) Refinancings
D) Home Improvement Loans
F) Non-occupant Loans on < 5 Family Dwellings (A B C & D)
G) Loans On Manufactured Home Dwelling (A B C & D)
Number
Average Value
Number
Average Value
Number
Average Value
Number
Average Value
Number
Average Value
Number
Average Value
LOANS ORIGINATED
13
$86,700
35
$73,048
63
$85,391
8
$21,450
10
$61,554
18
$41,317
APPLICATIONS APPROVED, NOT ACCEPTED
0
$0
12
$55,319
25
$74,429
1
$18,160
0
$0
6
$46,887
APPLICATIONS DENIED
4
$91,060
26
$56,166
50
$77,321
12
$17,054
3
$136,223
26
$47,345
APPLICATIONS WITHDRAWN
1
$126,280
8
$71,499
38
$83,336
2
$21,455
1
$96,410
5
$60,374
FILES CLOSED FOR INCOMPLETENESS
0
$0
3
$56,037
8
$95,831
0
$0
0
$0
0
$0
Aggregated Statistics For Year 2003 (Based on 3 partial tracts)
A) FHA, FSA/RHS & VA Home Purchase Loans
B) Conventional Home Purchase Loans
C) Refinancings
D) Home Improvement Loans
F) Non-occupant Loans on < 5 Family Dwellings (A B C & D)
Number
Average Value
Number
Average Value
Number
Average Value
Number
Average Value
Number
Average Value
LOANS ORIGINATED
12
$86,432
28
$75,992
104
$87,954
8
$15,590
5
$51,222
APPLICATIONS APPROVED, NOT ACCEPTED
1
$63,570
7
$63,860
24
$85,007
1
$22,700
2
$101,730
APPLICATIONS DENIED
2
$80,415
26
$47,021
73
$79,304
10
$24,628
4
$60,822
APPLICATIONS WITHDRAWN
2
$76,455
3
$104,450
26
$90,836
1
$44,150
1
$49,470
FILES CLOSED FOR INCOMPLETENESS
1
$24,220
2
$63,835
9
$92,726
1
$50,450
0
$0
Aggregated Statistics For Year 2002 (Based on 2 partial tracts)
A) FHA, FSA/RHS & VA Home Purchase Loans
B) Conventional Home Purchase Loans
C) Refinancings
D) Home Improvement Loans
F) Non-occupant Loans on < 5 Family Dwellings (A B C & D)
Number
Average Value
Number
Average Value
Number
Average Value
Number
Average Value
Number
Average Value
LOANS ORIGINATED
4
$94,292
15
$61,052
51
$82,113
8
$17,779
4
$30,982
APPLICATIONS APPROVED, NOT ACCEPTED
0
$0
6
$38,518
12
$62,727
0
$0
0
$0
APPLICATIONS DENIED
0
$0
13
$44,731
30
$65,957
7
$11,430
1
$48,070
APPLICATIONS WITHDRAWN
0
$0
1
$49,020
15
$82,700
0
$0
0
$0
FILES CLOSED FOR INCOMPLETENESS
0
$0
2
$82,520
12
$72,896
0
$0
0
$0
Aggregated Statistics For Year 2001 (Based on 2 partial tracts)
A) FHA, FSA/RHS & VA Home Purchase Loans
B) Conventional Home Purchase Loans
C) Refinancings
D) Home Improvement Loans
F) Non-occupant Loans on < 5 Family Dwellings (A B C & D)
Number
Average Value
Number
Average Value
Number
Average Value
Number
Average Value
Number
Average Value
LOANS ORIGINATED
9
$68,313
22
$49,961
65
$71,283
8
$13,024
4
$60,698
APPLICATIONS APPROVED, NOT ACCEPTED
0
$0
7
$35,670
7
$67,384
0
$0
0
$0
APPLICATIONS DENIED
1
$73,190
28
$41,669
28
$66,249
7
$10,656
2
$20,870
APPLICATIONS WITHDRAWN
0
$0
3
$51,413
14
$59,527
1
$60,220
0
$0
FILES CLOSED FOR INCOMPLETENESS
0
$0
0
$0
6
$60,220
0
$0
0
$0
Aggregated Statistics For Year 2000 (Based on 2 partial tracts)
A) FHA, FSA/RHS & VA Home Purchase Loans
B) Conventional Home Purchase Loans
C) Refinancings
D) Home Improvement Loans
F) Non-occupant Loans on < 5 Family Dwellings (A B C & D)
Number
Average Value
Number
Average Value
Number
Average Value
Number
Average Value
Number
Average Value
LOANS ORIGINATED
4
$82,670
31
$47,134
28
$61,168
8
$23,334
5
$52,846
APPLICATIONS APPROVED, NOT ACCEPTED
2
$42,215
11
$47,730
3
$42,927
1
$1,780
0
$0
APPLICATIONS DENIED
1
$27,380
65
$36,519
14
$54,106
7
$11,913
1
$41,280
APPLICATIONS WITHDRAWN
1
$52,190
5
$50,902
13
$63,413
0
$0
0
$0
FILES CLOSED FOR INCOMPLETENESS
0
$0
0
$0
3
$50,073
0
$0
0
$0
Aggregated Statistics For Year 1999 (Based on 2 partial tracts)
A) FHA, FSA/RHS & VA Home Purchase Loans
B) Conventional Home Purchase Loans
C) Refinancings
D) Home Improvement Loans
F) Non-occupant Loans on < 5 Family Dwellings (A B C & D)
2006 - 2018 National Fire Incident Reporting System (NFIRS) incidents
According to the data from the years 2006 - 2018 the average number of fire incidents per year is 10. The highest number of reported fires - 39 took place in 2007, and the least - 1 in 2012. The data has a declining trend.
When looking into fire subcategories, the most reports belonged to: Outside Fires (62.4%), and Structure Fires (25.6%).
Fire incident types reported to NFIRS in Zip Code 36521


 Nearest zip codes: 36571, 36572, 36613, 36522, 36505, 36512.


 According to the data from the years 2006 - 2018 the average number of fire incidents per year is 10. The highest number of reported fires - 39 took place in 2007, and the least - 1 in 2012. The data has a declining trend.
 When looking into fire subcategories, the most reports belonged to: Outside Fires (62.4%), and Structure Fires (25.6%).