Estimated zip code population in 2022: 3,167 Zip code population in 2010: 2,818 Zip code population in 2000: 3,229
Houses and condos: 1,256 Renter-occupied apartments: 250
% of renters here:
23%
State:
30%
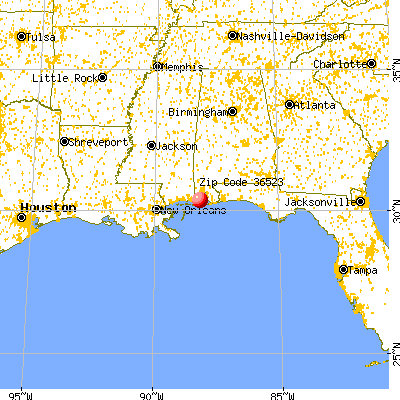
March 2022 cost of living index in zip code 36523: 82.7 (low, U.S. average is 100)
Land area: 38.3 sq. mi. Water area: 8.5 sq. mi.
Population density: 83 people per square mile
(very low).
OSM Map
General Map
Google Map
MSN Map
OSM Map
General Map
Google Map
MSN Map
OSM Map
General Map
Google Map
MSN Map
OSM Map
General Map
Google Map
MSN Map
Please wait while loading the map...
Real estate property taxes paid for housing units in 2022:
This zip code:
0.2% ($323)
Alabama:
0.4% ($718)
Median real estate property taxes paid for housing units with mortgages in 2022: $1,273 (0.4%) Median real estate property taxes paid for housing units with no mortgage in 2022: $203 (0.2%)
Business Search- 14 Million verified businesses
Males: 1,620
(51.1%)
Females: 1,547
(48.9%)
For population 25 years and over in 36523:
High school or higher: 80.4%
Bachelor's degree or higher: 19.4%
Graduate or professional degree: 6.8%
Unemployed: 0.9%
Mean travel time to work (commute): 33.6 minutes
For population 15 years and over in 36523:
Never married: 26.3%
Now married: 58.8%
Separated: 1.5%
Widowed: 5.8%
Divorced: 7.6%
Zip code 36523 compared to state average:
Unemployed percentage significantly below state average.
Black race population percentage significantly below state average.
Median age above state average.
Foreign-born population percentage significantly below state average.
Length of stay since moving in significantly above state average.
Number of college students significantly below state average.
Averages for the 2020 tax year for zip code 36523, filed in 2021:
Average Adjusted Gross Income (AGI) in 2020: $50,214 (Individual Income Tax Returns)
Here:
$50,214
State:
$63,984
Salary/wage: $43,721 (reported on 77.5% of returns)
Here:
$43,721
State:
$52,834
(% of AGI for various income ranges: 1158.9% for AGIs below $25k, 3735.6% for AGIs $25k-50k, 6782.5% for AGIs $50k-75k, 9570.0% for AGIs $75k-100k, 17425.0% for AGIs $100k-200k)
Taxable interest for individuals: $1,136 (reported on 19.8% of returns)
This zip code:
$1,136
Alabama:
$1,615
(% of AGI for various income ranges: 4.7% for AGIs below $25k, 17.8% for AGIs $25k-50k, 18.8% for AGIs $50k-75k, 46.7% for AGIs $75k-100k, 96.7% for AGIs $100k-200k)
Ordinary dividends: $2,670 (reported on 9.0% of returns)
Here:
$2,670
State:
$7,660
(% of AGI for various income ranges: 22.5% for AGIs below $25k, 11.2% for AGIs $50k-75k, 295.0% for AGIs $100k-200k)
Net capital gain/loss in AGI: +$14,400 (reported on 9.0% of returns)
Here:
+$14,400
State:
+$23,528
(% of AGI for various income ranges: 4.2% for AGIs below $25k, 112.5% for AGIs $50k-75k, 2225.0% for AGIs $100k-200k)
Profit/loss from business: +$8,220 (reported on 22.5% of returns)
Here:
+$8,220
State:
+$9,534
(% of AGI for various income ranges: 279.2% for AGIs below $25k, 213.3% for AGIs $25k-50k, 521.2% for AGIs $50k-75k, 415.0% for AGIs $100k-200k)
Taxable individual retirement arrangement distribution: $26,200 (reported on 7.2% of returns)
36523:
$26,200
Alabama:
$19,004
(% of AGI for various income ranges: 39.4% for AGIs below $25k, 295.0% for AGIs $25k-50k, 2371.7% for AGIs $75k-100k)
Total itemized deductions: $25,571 (reported on 6.3% of returns)
Here:
$25,571
State:
$37,338
(% of AGI for various income ranges: 1073.8% for AGIs $50k-75k, 1551.7% for AGIs $100k-200k)
Charity contributions: $6,475 (reported on 3.6% of returns)
Here:
$6,475
State:
$18,005
(% of AGI for various income ranges: 431.7% for AGIs $100k-200k)
Taxes paid: $5,580 (reported on 4.5% of returns)
36523:
$5,580
State:
$6,484
(% of AGI for various income ranges: 43.3% for AGIs $25k-50k, 335.0% for AGIs $100k-200k)
Earned income credit: $2,503 (reported on 27.0% of returns)
Here:
$2,503
State:
$2,628
(% of AGI for various income ranges: 156.4% for AGIs below $25k, 104.4% for AGIs $25k-50k)
Percentage of individuals using paid preparers for their 2020 taxes: 91.0%
Here:
91%
State:
93%
(% for various income ranges: 92.0% for AGIs below $25k, 91.7% for AGIs $25k-50k, 84.6% for AGIs $50k-75k, 88.9% for AGIs $75k-100k, 91.7% for AGIs $100k-200k, 100.0% for AGIs over 200k)
Averages for the 2012 tax year for zip code 36523, filed in 2013:
Average Adjusted Gross Income (AGI) in 2012: $43,185 (Individual Income Tax Returns)
Here:
$43,185
State:
$52,001
Salary/wage: $39,188 (reported on 79.2% of returns)
Here:
$39,188
State:
$43,822
(% of AGI for various income ranges: 72.4% for AGIs below $25k, 78.7% for AGIs $25k-50k, 73.6% for AGIs $50k-75k, 76.6% for AGIs $75k-100k, 65.1% for AGIs $100k-200k)
Taxable interest for individuals: $683 (reported on 22.6% of returns)
This zip code:
$683
Alabama:
$1,592
(% of AGI for various income ranges: 0.4% for AGIs below $25k, 0.2% for AGIs $25k-50k, 0.5% for AGIs $50k-75k, 0.1% for AGIs $75k-100k, 0.5% for AGIs $100k-200k)
Ordinary dividends: $1,725 (reported on 7.5% of returns)
Here:
$1,725
State:
$5,697
(% of AGI for various income ranges: 0.3% for AGIs below $25k, 0.7% for AGIs $50k-75k, 0.4% for AGIs $100k-200k)
Net capital gain/loss in AGI: +$300 (reported on 6.6% of returns)
Here:
+$300
State:
+$13,286
Profit/loss from business: +$8,988 (reported on 24.5% of returns)
Here:
+$8,988
State:
+$9,151
(% of AGI for various income ranges: 15.2% for AGIs below $25k, 4.2% for AGIs $25k-50k, 11.6% for AGIs $50k-75k, 0.3% for AGIs $100k-200k)
Taxable individual retirement arrangement distribution: $10,986 (reported on 6.6% of returns)
36523:
$10,986
Alabama:
$14,992
Total itemized deductions: $21,110 (22% of AGI, reported on 19.8% of returns)
Here:
$21,110
State:
$21,388
Here:
21.9% of AGI
State:
20.1% of AGI
(% of AGI for various income ranges: 5.1% for AGIs below $25k, 7.2% for AGIs $25k-50k, 9.6% for AGIs $50k-75k, 12.1% for AGIs $75k-100k, 11.9% for AGIs $100k-200k)
Charity contributions: $4,441 (reported on 16.0% of returns)
Here:
$4,441
State:
$5,925
(% of AGI for various income ranges: 1.0% for AGIs $25k-50k, 1.8% for AGIs $50k-75k, 1.8% for AGIs $75k-100k, 2.6% for AGIs $100k-200k)
Taxes paid: $4,975 (reported on 18.9% of returns)
36523:
$4,975
State:
$5,272
(% of AGI for various income ranges: 0.6% for AGIs below $25k, 0.8% for AGIs $25k-50k, 1.8% for AGIs $50k-75k, 2.7% for AGIs $75k-100k, 3.5% for AGIs $100k-200k)
Earned income credit: $2,640 (reported on 28.3% of returns)
Here:
$2,640
State:
$2,646
(% of AGI for various income ranges: 11.0% for AGIs below $25k, 1.2% for AGIs $25k-50k)
Percentage of individuals using paid preparers for their 2012 taxes: 62.3%
Here:
62%
State:
60%
(% for various income ranges: 60.0% for AGIs below $25k, 58.3% for AGIs $25k-50k, 64.3% for AGIs $50k-75k, 62.5% for AGIs $75k-100k, 80.0% for AGIs $100k-200k)
Averages for the 2004 tax year for zip code 36523, filed in 2005:
Average Adjusted Gross Income (AGI) in 2004: $29,752 (Individual Income Tax Returns)
Here:
$29,752
State:
$42,302
Salary/wage: $28,887 (reported on 77.9% of returns)
Here:
$28,887
State:
$36,626
(% of AGI for various income ranges: 72.3% for AGIs below $10k, 68.8% for AGIs $10k-25k, 85.9% for AGIs $25k-50k, 82.3% for AGIs $50k-75k, 83.5% for AGIs $75k-100k, 59.8% for AGIs over 100k)
Taxable interest for individuals: $860 (reported on 26.9% of returns)
This zip code:
$860
Alabama:
$1,827
(% of AGI for various income ranges: 2.8% for AGIs below $10k, 1.1% for AGIs $10k-25k, 0.4% for AGIs $25k-50k, 0.7% for AGIs $50k-75k, 0.1% for AGIs $75k-100k, 1.0% for AGIs over 100k)
Taxable dividends: $951 (reported on 7.1% of returns)
Here:
$951
State:
$4,206
(% of AGI for various income ranges: 0.2% for AGIs $10k-25k, 0.2% for AGIs $25k-50k, 0.4% for AGIs $50k-75k, 0.3% for AGIs over 100k)
Profit/loss from business: +$8,249 (reported on 27.6% of returns)
Here:
+$8,249
State:
+$8,302
(% of AGI for various income ranges: 42.4% for AGIs below $10k, 15.2% for AGIs $10k-25k, 6.1% for AGIs $25k-50k, 3.0% for AGIs $50k-75k, 5.1% for AGIs over 100k)
IRA payment deduction: $3,579 (reported on 1.7% of returns)
36523:
$3,579
Alabama:
$3,006
Total itemized deductions: $17,692 (27% of AGI, reported on 20.9% of returns)
Here:
$17,692
State:
$17,623
Here:
27.0% of AGI
State:
20.8% of AGI
(% of AGI for various income ranges: 9.5% for AGIs below $10k, 5.9% for AGIs $10k-25k, 12.9% for AGIs $25k-50k, 14.8% for AGIs $50k-75k, 17.0% for AGIs $75k-100k, 13.6% for AGIs over 100k)
Charity contributions deductions: $3,114 (4% of AGI, reported on 17.5% of returns)
Here:
$3,114
State:
$4,768
Here:
4.5% of AGI
State:
5.4% of AGI
(% of AGI for various income ranges: 0.6% for AGIs $10k-25k, 1.5% for AGIs $25k-50k, 1.7% for AGIs $50k-75k, 2.8% for AGIs $75k-100k, 3.3% for AGIs over 100k)
Total tax: $3,911 (reported on 69.3% of returns)
36523:
$3,911
State:
$6,905
(% of AGI for various income ranges: 7.3% for AGIs below $10k, 4.4% for AGIs $10k-25k, 6.1% for AGIs $25k-50k, 8.2% for AGIs $50k-75k, 10.8% for AGIs $75k-100k, 17.1% for AGIs over 100k)
Earned income credit: $2,095 (reported on 35.0% of returns)
Here:
$2,095
State:
$2,048
Percentage of individuals using paid preparers for their 2004 taxes: 66.6%
Here:
67%
State:
65%
(% for various income ranges: 63.0% for AGIs below $10k, 68.3% for AGIs $10k-25k, 66.1% for AGIs $25k-50k, 69.4% for AGIs $50k-75k, 65.1% for AGIs $75k-100k, 72.3% for AGIs over 100k)
Household received Food Stamps/SNAP in the past 12 months: 234 Household did not receive Food Stamps/SNAP in the past 12 months: 863
Women who had a birth in the past 12 months: 22 (17 now married, 5 unmarried) Women who did not have a birth in the past 12 months: 734 (332 now married, 401 unmarried)
Housing units in zip code 36523 with a mortgage: 354 (42 second mortgage, 35 both second mortgage and home equity loan) Houses without a mortgage: 31
Median monthly owner costs for units with a mortgage: $1,696 Median monthly owner costs for units without a mortgage: $353
Residents with income below the poverty level in 2022:
This zip code:
17.2%
Whole state:
16.2%
Residents with income below 50% of the poverty level in 2022:
This zip code:
9.5%
Whole state:
8.6%
Median number of rooms in houses and condos:
Here:
6.0
State:
6.5
Median number of rooms in apartments:
Here:
5.1
State:
4.7
Notable locations in this zip code not listed on our city pages
Notable locations in zip code 36523: DCP Midstream Gas Gathering Facility (A), Alabama Port Fire Department (B), Alabama Port Volunteer Fire and Rescue Department (C). Display/hide their locations on the map
Churches in zip code 36523 include: Herron Bay Church (A), Saint Mary Church (B), Saint Michaels Church (C), Saint Rose Church (D), First Baptist Church of Coden (E), Sweet Bethel Baptist Church (F), Heron Bay Church (G), Coden United Methodist Church (H). Display/hide their locations on the map
Streams, rivers, and creeks: Negro Bayou (A), Bayou La Batre (B), Heron Bayou (C), East Fowl River (D), Delchamps Bayou (E), Bayou Coden (F), Bayou Sullivan (G), Bayou Jonas (H), Bayou Como (I). Display/hide their locations on the map
Size of family households: 366 2-persons, 215 3-persons, 128 4-persons, 91 5-persons, 60 6-persons, 7 7-or-more-persons
Size of nonfamily households: 219 1-person
291 married couples with children.
185 single-parent households (110 men, 75 women).
97.3% of residents of 36523 zip code speak English at home.
2.3% of residents speak Spanish at home (100% very well).
0.3% of residents speak Asian or Pacific Island language at home (100% well).
Foreign born population: 34 (1.1%) (40.3% of them are naturalized citizens)
This zip code:
1.1%
Whole state:
3.8%
38%Barbados
28%Haiti
24%American
19%English
8%Irish
5%Scotch-Irish
4%Italian
3%Russian
3%French
Year of entry for the foreign-born population
382010 or later
252000 to 2009
01990 to 1999
57Before 1990
Major facilities with environmental interests located in this zip code:
EXXONMOBIL PRODUCTION COMPANY (5201 OLD ROCK RD in CODEN, AL)
AIR MAJOR (AIRS/AFS) CRITERIA AND HAZARDOUS AIR POLLUTANT INVENTORY (Inventory of air pollution sources) National Pollutant Discharge Elimination System NON-MAJOR (Tracking pollutant discharge elimination systems) - permit AIR MAJOR ("Best Available" air pollution technologies tracking) Small Quantity Generators, between 100 kg and 1000 kg of hazardous waste/month (Resource Conservation and Recovery Act (tracking hazardous waste)) Business SIC classification: CRUDE PETROLEUM AND NATURAL GAS; INDUSTRIAL INORGANIC CHEMICALS; PETROLEUM REFINING Business NAICS classification: CRUDE PETROLEUM AND NATURAL GAS EXTRACTION. Alternative names: MARY ANN GAS TREATMENT FAC, MOBIL OIL E&P SOUTHEAST INC MARY ANN, MOBIL OIL EXP AND PRODUCING SE, MOBIL OIL EXP AND PRODUCTN SE, MOBIL OIL EXPLORATION & PRODUCING SOUTHEAST, INC., MOBIL OIL EXPLORATION & PRODUCING SOUTHEAST, INC., MOBIL OIL EXPLORATION & PRODUCTION S E, MOEPSI
CHAN-TA SEAFOOD (14580 ST MICHEAL ROAD in CODEN, AL)
National Pollutant Discharge Elimination System NON-MAJOR (Tracking pollutant discharge elimination systems) - permit Business SIC classification: NONCLASSIFIABLE ESTABLISHMENTS
MILLER JOHNSON SEAFOOD (4310 HERON BAY LOOP in CODEN, AL)
National Pollutant Discharge Elimination System NON-MAJOR (Tracking pollutant discharge elimination systems) - permit Business SIC classification: PREPARED FRESH OR FROZEN FISH AND SEAFOODS
CAPTAIN COLLIER SEAFOOD (14733 TOM JOHNSON RD in CODEN, AL)
National Pollutant Discharge Elimination System NON-MAJOR (Tracking pollutant discharge elimination systems) - permit Business SIC classification: PREPARED FRESH OR FROZEN FISH AND SEAFOODS Organizations: CAPTAIN COLLIERS SEAFOOD (CONTACT/OWNER)
COAST SEAFOOD INC (3881 JOHNSON ROAD in CODEN, AL)
National Pollutant Discharge Elimination System NON-MAJOR (Tracking pollutant discharge elimination systems) - permit Business SIC classification: PREPARED FRESH OR FROZEN FISH AND SEAFOODS
CODEN GROCERY (8481 SOUTH CODEN AVE in CODEN, AL)
National Pollutant Discharge Elimination System NON-MAJOR (Tracking pollutant discharge elimination systems) - permit Business SIC classification: GASOLINE SERVICE STATIONS
KERN CONSTRUCTION (96852 FAITH STREET in CODEN, AL)
(Resource Conservation and Recovery Act (tracking hazardous waste))
MASTER BOAT BUILDERS INC (14979A ALBA AVENUE in CODEN, AL)
National Pollutant Discharge Elimination System NON-MAJOR (Tracking pollutant discharge elimination systems) - permit Business SIC classification: SHIP BUILDING AND REPAIRING
MOBILE BAY NGL RECOVERY PLANT (HIGHWAY 188 in CODEN, AL)
National Pollutant Discharge Elimination System NON-MAJOR (Tracking pollutant discharge elimination systems) - permit Business SIC classification: NATURAL GAS LIQUIDS
BLUE GULF SEAFOOD (SHELL BELT RD in CODEN, AL)
National Pollutant Discharge Elimination System NON-MAJOR (Tracking pollutant discharge elimination systems) - permit
CHRISTOPHER ACRES (ERIC MORGAN in CODEN, AL)
National Pollutant Discharge Elimination System NON-MAJOR (Tracking pollutant discharge elimination systems) - permit Business SIC classification: HIGHWAY AND STREET CONSTRUCTION, EXCEPT ELEVATED HIGHWAYS Alternative names: CHRISTOPHER ACRES ERIC MORGAN
RUSSELL PROPERTIES LLP (MIKE RUSSELL in CODEN, AL)
National Pollutant Discharge Elimination System NON-MAJOR (Tracking pollutant discharge elimination systems) - permit Business SIC classification: GENERAL CONTRACTORS-NONRESIDENTIAL BUILDINGS, OTHER THAN INDUSTRIAL BUILDINGS AND WAREHOUSES
KIPLING STATION PHASE 2 (BAYOU SOUTH LLC in CODEN, AL)
National Pollutant Discharge Elimination System NON-MAJOR (Tracking pollutant discharge elimination systems) - permit Business SIC classification: HIGHWAY AND STREET CONSTRUCTION, EXCEPT ELEVATED HIGHWAYS Alternative names: BAYOU SOUTH LLC KIPLING STATN
Housing units lacking complete plumbing facilities: 5.4% Housing units lacking complete kitchen facilities: 6.2%
84.2%Electricity
13.4%Utility gas
2.5%Bottled, tank, or LP gas
Population in 1990: 3,897.
Place of birth for U.S.-born residents:
This state: 2,225
Northeast: 41
Midwest: 163
South: 529
West: 79
68% of the 36523 zip code residents lived in the same house 5 years ago. Out of people who lived in different houses, 72% lived in this county. Out of people who lived in different counties, 50% lived in Alabama.
91% of the 36523 zip code residents lived in the same house 1 year ago. Out of people who lived in different houses, 87% moved from this county. Out of people who lived in different houses, 5% moved from different county within same state.
Private vs. public school enrollment:
Students in private schools in grades 1 to 8 (elementary and middle school): 124
Here:
34.7%
Alabama:
14.7%
Students in private schools in grades 9 to 12 (high school): 48
Here:
20.1%
Alabama:
16.3%
Students in private undergraduate colleges:
Here:
0.0%
Alabama:
14.6%
Occupation by median earnings in the past 12 months ($)
63,827Transportation occupations
55,356Business and financial operations occupations
52,798Education, training, and library occupations
51,775Management occupations
50,758Food preparation and serving related occupations
37,551Production occupations
Top industries in this zip code by the number of employees in 2005:
Wholesale Trade: Fish and Seafood Merchant Wholesalers (50-99 employees: 2 establishments, 5-9 employees: 2 establishments, 1-4 employees: 1 establishment)
Mining: Crude Petroleum and Natural Gas Extraction (20-49: 2)
Accommodation and Food Services: Full-Service Restaurants (10-19: 1, 1-4: 2)
Wholesale Trade: Metal Service Centers and Other Metal Merchant Wholesalers (10-19: 1)
Construction: Other Heavy and Civil Engineering Construction (10-19: 1)
Construction: Plumbing, Heating, and Air-Conditioning Contractors (5-9: 1, 1-4: 4)
Fatal accident statistics in 2013:
Fatal accident count: 2
Vehicles involved in fatal accidents: 5
Fatal accidents caused by drunken drivers: 0
Fatalities: 2
Persons involved in fatal accidents: 6
Pedestrians involved in fatal accidents: 0
Fatal accident statistics in 2011:
Fatal accident count: 3
Vehicles involved in fatal accidents: 4
Fatal accidents caused by drunken drivers: 2
Fatalities: 3
Persons involved in fatal accidents: 4
Pedestrians involved in fatal accidents: 0
Home Mortgage Disclosure Act Aggregated Statistics For Year 2009 (Based on 3 partial tracts)
A) FHA, FSA/RHS & VA Home Purchase Loans
B) Conventional Home Purchase Loans
C) Refinancings
D) Home Improvement Loans
F) Non-occupant Loans on < 5 Family Dwellings (A B C & D)
G) Loans On Manufactured Home Dwelling (A B C & D)
Number
Average Value
Number
Average Value
Number
Average Value
Number
Average Value
Number
Average Value
Number
Average Value
LOANS ORIGINATED
7
$116,797
18
$179,430
73
$194,022
3
$96,057
37
$215,478
2
$27,225
APPLICATIONS APPROVED, NOT ACCEPTED
3
$85,030
3
$240,993
7
$157,060
0
$0
4
$247,940
2
$40,175
APPLICATIONS DENIED
2
$121,635
8
$129,869
37
$212,701
4
$80,735
14
$238,743
4
$37,380
APPLICATIONS WITHDRAWN
1
$35,920
3
$201,237
33
$185,890
1
$211,180
14
$238,037
1
$35,600
FILES CLOSED FOR INCOMPLETENESS
0
$0
1
$266,310
6
$204,760
1
$19,310
1
$367,780
0
$0
Aggregated Statistics For Year 2008 (Based on 3 partial tracts)
A) FHA, FSA/RHS & VA Home Purchase Loans
B) Conventional Home Purchase Loans
C) Refinancings
D) Home Improvement Loans
F) Non-occupant Loans on < 5 Family Dwellings (A B C & D)
G) Loans On Manufactured Home Dwelling (A B C & D)
Number
Average Value
Number
Average Value
Number
Average Value
Number
Average Value
Number
Average Value
Number
Average Value
LOANS ORIGINATED
7
$134,873
31
$215,901
55
$191,271
6
$116,660
36
$260,953
3
$61,190
APPLICATIONS APPROVED, NOT ACCEPTED
1
$70,250
5
$89,344
9
$116,954
1
$16,830
4
$181,418
3
$40,173
APPLICATIONS DENIED
2
$91,780
10
$136,747
38
$165,370
10
$64,902
9
$205,473
4
$40,490
APPLICATIONS WITHDRAWN
3
$186,133
3
$161,083
12
$166,585
0
$0
2
$162,600
0
$0
FILES CLOSED FOR INCOMPLETENESS
0
$0
2
$262,485
8
$181,729
0
$0
4
$250,222
0
$0
Aggregated Statistics For Year 2007 (Based on 3 partial tracts)
A) FHA, FSA/RHS & VA Home Purchase Loans
B) Conventional Home Purchase Loans
C) Refinancings
D) Home Improvement Loans
F) Non-occupant Loans on < 5 Family Dwellings (A B C & D)
G) Loans On Manufactured Home Dwelling (A B C & D)
Number
Average Value
Number
Average Value
Number
Average Value
Number
Average Value
Number
Average Value
Number
Average Value
LOANS ORIGINATED
4
$101,670
61
$267,354
78
$191,294
13
$43,990
66
$298,616
4
$37,370
APPLICATIONS APPROVED, NOT ACCEPTED
0
$0
7
$283,839
12
$202,847
1
$28,780
8
$342,911
2
$54,650
APPLICATIONS DENIED
0
$0
15
$143,197
39
$163,233
10
$72,905
13
$267,415
6
$45,310
APPLICATIONS WITHDRAWN
0
$0
9
$252,774
20
$146,566
3
$69,137
7
$377,049
1
$95,330
FILES CLOSED FOR INCOMPLETENESS
0
$0
3
$302,300
10
$193,263
1
$57,040
4
$357,760
0
$0
Aggregated Statistics For Year 2006 (Based on 3 partial tracts)
A) FHA, FSA/RHS & VA Home Purchase Loans
B) Conventional Home Purchase Loans
C) Refinancings
D) Home Improvement Loans
F) Non-occupant Loans on < 5 Family Dwellings (A B C & D)
G) Loans On Manufactured Home Dwelling (A B C & D)
Number
Average Value
Number
Average Value
Number
Average Value
Number
Average Value
Number
Average Value
Number
Average Value
LOANS ORIGINATED
4
$117,220
69
$173,333
69
$199,467
10
$77,615
62
$219,975
8
$33,550
APPLICATIONS APPROVED, NOT ACCEPTED
0
$0
7
$79,590
10
$96,472
2
$66,255
3
$111,370
3
$57,233
APPLICATIONS DENIED
0
$0
20
$124,512
38
$175,626
16
$50,244
17
$235,354
12
$51,958
APPLICATIONS WITHDRAWN
0
$0
11
$166,558
24
$192,742
0
$0
11
$278,255
0
$0
FILES CLOSED FOR INCOMPLETENESS
0
$0
6
$146,010
11
$180,971
1
$87,470
2
$199,305
0
$0
Aggregated Statistics For Year 2005 (Based on 3 partial tracts)
A) FHA, FSA/RHS & VA Home Purchase Loans
B) Conventional Home Purchase Loans
C) Refinancings
D) Home Improvement Loans
F) Non-occupant Loans on < 5 Family Dwellings (A B C & D)
G) Loans On Manufactured Home Dwelling (A B C & D)
Number
Average Value
Number
Average Value
Number
Average Value
Number
Average Value
Number
Average Value
Number
Average Value
LOANS ORIGINATED
4
$89,212
94
$216,945
78
$177,681
10
$79,995
89
$233,171
4
$29,282
APPLICATIONS APPROVED, NOT ACCEPTED
2
$85,100
16
$145,069
20
$141,740
2
$89,290
11
$173,497
5
$53,992
APPLICATIONS DENIED
1
$37,960
26
$148,433
47
$130,785
13
$39,938
17
$236,581
9
$53,474
APPLICATIONS WITHDRAWN
0
$0
16
$221,211
30
$126,417
4
$93,430
12
$231,350
1
$49,760
FILES CLOSED FOR INCOMPLETENESS
0
$0
4
$249,108
10
$194,417
2
$152,875
4
$291,755
0
$0
Aggregated Statistics For Year 2004 (Based on 3 partial tracts)
A) FHA, FSA/RHS & VA Home Purchase Loans
B) Conventional Home Purchase Loans
C) Refinancings
D) Home Improvement Loans
F) Non-occupant Loans on < 5 Family Dwellings (A B C & D)
G) Loans On Manufactured Home Dwelling (A B C & D)
Number
Average Value
Number
Average Value
Number
Average Value
Number
Average Value
Number
Average Value
Number
Average Value
LOANS ORIGINATED
7
$77,256
112
$165,966
87
$145,079
15
$35,516
94
$180,786
7
$34,067
APPLICATIONS APPROVED, NOT ACCEPTED
0
$0
15
$149,381
24
$128,484
3
$24,720
9
$168,120
1
$62,490
APPLICATIONS DENIED
1
$80,410
24
$107,869
48
$111,771
19
$30,984
12
$131,398
10
$36,610
APPLICATIONS WITHDRAWN
0
$0
11
$198,499
38
$125,710
3
$54,227
13
$198,221
1
$31,120
FILES CLOSED FOR INCOMPLETENESS
2
$75,180
6
$157,042
9
$132,192
1
$20,030
6
$164,505
0
$0
Aggregated Statistics For Year 2003 (Based on 3 partial tracts)
A) FHA, FSA/RHS & VA Home Purchase Loans
B) Conventional Home Purchase Loans
C) Refinancings
D) Home Improvement Loans
F) Non-occupant Loans on < 5 Family Dwellings (A B C & D)
Number
Average Value
Number
Average Value
Number
Average Value
Number
Average Value
Number
Average Value
LOANS ORIGINATED
6
$106,343
74
$157,920
159
$130,934
13
$33,945
78
$151,612
APPLICATIONS APPROVED, NOT ACCEPTED
0
$0
10
$112,232
25
$98,609
2
$23,630
5
$196,020
APPLICATIONS DENIED
1
$106,230
17
$75,086
60
$116,984
16
$21,966
9
$120,832
APPLICATIONS WITHDRAWN
1
$48,320
6
$147,028
44
$122,693
2
$34,605
8
$152,089
FILES CLOSED FOR INCOMPLETENESS
0
$0
2
$159,325
14
$140,646
1
$69,300
3
$190,247
Aggregated Statistics For Year 2002 (Based on 1 partial tract)
A) FHA, FSA/RHS & VA Home Purchase Loans
B) Conventional Home Purchase Loans
C) Refinancings
D) Home Improvement Loans
F) Non-occupant Loans on < 5 Family Dwellings (A B C & D)
Number
Average Value
Number
Average Value
Number
Average Value
Number
Average Value
Number
Average Value
LOANS ORIGINATED
1
$51,180
7
$49,501
20
$66,632
4
$9,378
2
$45,620
APPLICATIONS APPROVED, NOT ACCEPTED
0
$0
0
$0
4
$71,210
1
$17,480
0
$0
APPLICATIONS DENIED
0
$0
7
$44,733
20
$59,781
5
$23,398
1
$15,260
APPLICATIONS WITHDRAWN
0
$0
0
$0
8
$52,970
0
$0
0
$0
FILES CLOSED FOR INCOMPLETENESS
0
$0
0
$0
4
$62,945
0
$0
0
$0
Aggregated Statistics For Year 2001 (Based on 1 partial tract)
A) FHA, FSA/RHS & VA Home Purchase Loans
B) Conventional Home Purchase Loans
C) Refinancings
D) Home Improvement Loans
F) Non-occupant Loans on < 5 Family Dwellings (A B C & D)
Number
Average Value
Number
Average Value
Number
Average Value
Number
Average Value
Number
Average Value
LOANS ORIGINATED
2
$64,695
7
$53,543
18
$59,924
3
$15,683
2
$58,175
APPLICATIONS APPROVED, NOT ACCEPTED
0
$0
4
$46,015
4
$44,505
1
$20,660
0
$0
APPLICATIONS DENIED
0
$0
15
$36,834
15
$54,340
4
$10,730
1
$28,610
APPLICATIONS WITHDRAWN
1
$46,410
2
$55,475
5
$46,986
0
$0
0
$0
FILES CLOSED FOR INCOMPLETENESS
0
$0
0
$0
2
$40,530
0
$0
0
$0
Aggregated Statistics For Year 2000 (Based on 1 partial tract)
A) FHA, FSA/RHS & VA Home Purchase Loans
B) Conventional Home Purchase Loans
C) Refinancings
D) Home Improvement Loans
F) Non-occupant Loans on < 5 Family Dwellings (A B C & D)
Number
Average Value
Number
Average Value
Number
Average Value
Number
Average Value
Number
Average Value
LOANS ORIGINATED
1
$46,410
9
$54,078
11
$38,871
5
$13,860
3
$29,460
APPLICATIONS APPROVED, NOT ACCEPTED
0
$0
4
$43,870
2
$50,230
0
$0
0
$0
APPLICATIONS DENIED
0
$0
14
$35,309
7
$45,279
5
$6,930
3
$18,333
APPLICATIONS WITHDRAWN
0
$0
2
$52,135
3
$34,227
0
$0
1
$36,560
FILES CLOSED FOR INCOMPLETENESS
0
$0
0
$0
3
$45,247
0
$0
0
$0
Aggregated Statistics For Year 1999 (Based on 4 partial tracts)
A) FHA, FSA/RHS & VA Home Purchase Loans
B) Conventional Home Purchase Loans
C) Refinancings
D) Home Improvement Loans
F) Non-occupant Loans on < 5 Family Dwellings (A B C & D)
Detailed PMIC statistics for the following Tracts:0072.00
, 0073.00
2003 - 2018 National Fire Incident Reporting System (NFIRS) incidents
According to the data from the years 2003 - 2018 the average number of fire incidents per year is 24. The highest number of reported fires - 65 took place in 2014, and the least - 0 in 2006. The data has a rising trend.
When looking into fire subcategories, the most reports belonged to: Outside Fires (83.7%), and Structure Fires (11.1%).
Fire incident types reported to NFIRS in Zip Code 36523


 Nearest zip codes: 36509, 36544, 36582, 36528, 36590, 36568.


 According to the data from the years 2003 - 2018 the average number of fire incidents per year is 24. The highest number of reported fires - 65 took place in 2014, and the least - 0 in 2006. The data has a rising trend.
 When looking into fire subcategories, the most reports belonged to: Outside Fires (83.7%), and Structure Fires (11.1%).