Estimated zip code population in 2022: 2,301 Zip code population in 2010: 2,129 Zip code population in 2000: 1,786
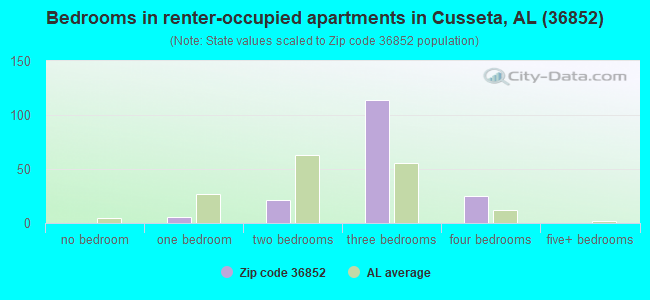
Houses and condos: 1,008 Renter-occupied apartments: 164
% of renters here:
20%
State:
30%
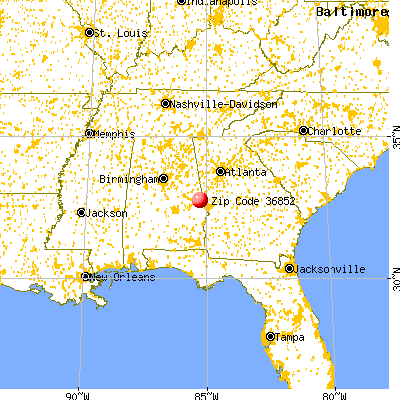
March 2022 cost of living index in zip code 36852: 82.5 (low, U.S. average is 100)
Land area: 35.1 sq. mi. Water area: 0.0 sq. mi.
Population density: 65 people per square mile
(very low).
OSM Map
General Map
Google Map
MSN Map
OSM Map
General Map
Google Map
MSN Map
OSM Map
General Map
Google Map
MSN Map
OSM Map
General Map
Google Map
MSN Map
Please wait while loading the map...
Real estate property taxes paid for housing units in 2022:
This zip code:
0.3% ($678)
Alabama:
0.4% ($718)
Median real estate property taxes paid for housing units with mortgages in 2022: $696 (0.4%) Median real estate property taxes paid for housing units with no mortgage in 2022: $661 (0.6%)
Business Search- 14 Million verified businesses
Males: 1,193
(51.9%)
Females: 1,108
(48.1%)
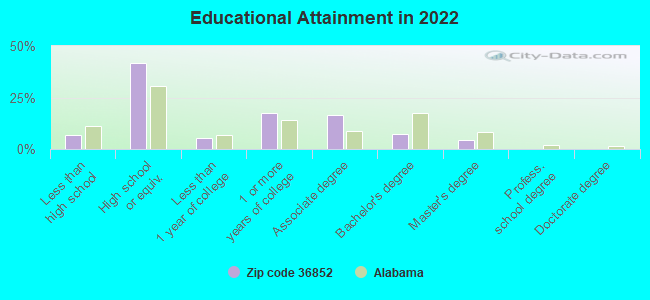
For population 25 years and over in 36852:
High school or higher: 92.4%
Bachelor's degree or higher: 11.7%
Graduate or professional degree: 4.6%
Unemployed: 2.9%
Mean travel time to work (commute): 17.7 minutes
For population 15 years and over in 36852:
Never married: 31.6%
Now married: 52.7%
Separated: 0.2%
Widowed: 7.9%
Divorced: 7.5%
Zip code 36852 compared to state average:
Hispanic race population percentage significantly below state average.
Median age below state average.
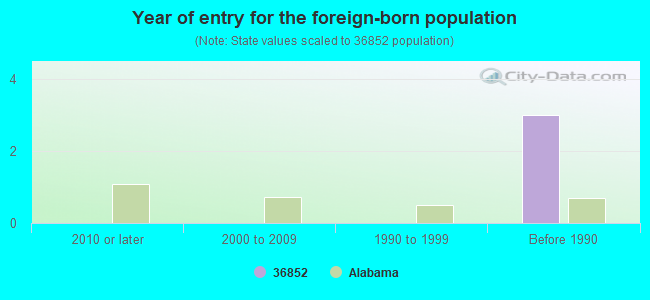
Foreign-born population percentage significantly below state average.
Renting percentage below state average.
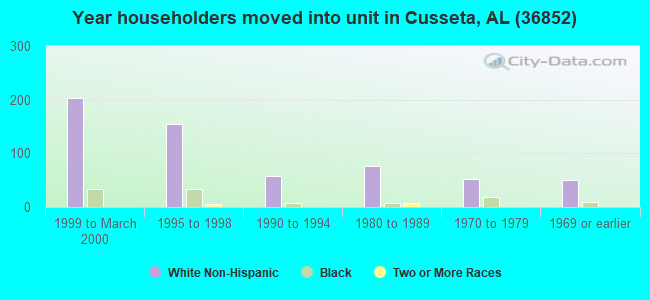
Length of stay since moving in significantly above state average.
Percentage of population with a bachelor's degree or higher significantly below state average.
Averages for the 2020 tax year for zip code 36852, filed in 2021:
Average Adjusted Gross Income (AGI) in 2020: $44,200 (Individual Income Tax Returns)
Here:
$44,200
State:
$63,984
Salary/wage: $40,816 (reported on 90.2% of returns)
Here:
$40,816
State:
$52,834
(% of AGI for various income ranges: 1235.4% for AGIs below $25k, 4012.0% for AGIs $25k-50k, 7222.3% for AGIs $50k-75k, 11132.9% for AGIs $75k-100k, 23602.5% for AGIs $100k-200k)
Taxable interest for individuals: $547 (reported on 15.2% of returns)
This zip code:
$547
Alabama:
$1,615
(% of AGI for various income ranges: 3.8% for AGIs below $25k, 10.4% for AGIs $25k-50k, 8.5% for AGIs $50k-75k, 10.0% for AGIs $75k-100k, 87.5% for AGIs $100k-200k)
Ordinary dividends: $1,733 (reported on 5.4% of returns)
Here:
$1,733
State:
$7,660
(% of AGI for various income ranges: 10.0% for AGIs $25k-50k, 112.9% for AGIs $75k-100k)
Net capital gain/loss in AGI: +$10,029 (reported on 6.2% of returns)
Here:
+$10,029
State:
+$23,528
(% of AGI for various income ranges: 35.6% for AGIs $25k-50k, 875.7% for AGIs $75k-100k)
Profit/loss from business: +$886 (reported on 12.5% of returns)
Here:
+$886
State:
+$9,534
(% of AGI for various income ranges: 37.8% for AGIs below $25k, 100.8% for AGIs $50k-75k, 90.0% for AGIs $75k-100k)
Taxable individual retirement arrangement distribution: $7,300 (reported on 3.6% of returns)
36852:
$7,300
Alabama:
$19,004
(% of AGI for various income ranges: 116.8% for AGIs $25k-50k)
Total itemized deductions: $22,675 (reported on 3.6% of returns)
Here:
$22,675
State:
$37,338
(% of AGI for various income ranges: 697.7% for AGIs $50k-75k)
Charity contributions: $11,350 (reported on 1.8% of returns)
Here:
$11,350
State:
$18,005
(% of AGI for various income ranges: 90.8% for AGIs $25k-50k)
Taxes paid: $4,275 (reported on 3.6% of returns)
36852:
$4,275
State:
$6,484
(% of AGI for various income ranges: 131.5% for AGIs $50k-75k)
Earned income credit: $2,661 (reported on 27.7% of returns)
Here:
$2,661
State:
$2,628
(% of AGI for various income ranges: 147.8% for AGIs below $25k, 111.2% for AGIs $25k-50k)
Percentage of individuals using paid preparers for their 2020 taxes: 94.6%
Here:
95%
State:
93%
(% for various income ranges: 95.5% for AGIs below $25k, 96.9% for AGIs $25k-50k, 88.9% for AGIs $50k-75k, 90.9% for AGIs $75k-100k, 100.0% for AGIs $100k-200k)
Averages for the 2012 tax year for zip code 36852, filed in 2013:
Average Adjusted Gross Income (AGI) in 2012: $33,560 (Individual Income Tax Returns)
Here:
$33,560
State:
$52,001
Salary/wage: $33,026 (reported on 90.8% of returns)
Here:
$33,026
State:
$43,822
(% of AGI for various income ranges: 84.5% for AGIs below $25k, 91.8% for AGIs $25k-50k, 89.3% for AGIs $50k-75k, 90.9% for AGIs $75k-100k, 89.5% for AGIs $100k-200k)
Taxable interest for individuals: $621 (reported on 14.3% of returns)
This zip code:
$621
Alabama:
$1,592
(% of AGI for various income ranges: 0.2% for AGIs below $25k, 0.6% for AGIs $25k-50k, 0.1% for AGIs $75k-100k)
Ordinary dividends: $1,200 (reported on 4.1% of returns)
Here:
$1,200
State:
$5,697
Profit/loss from business: +$2,954 (reported on 13.3% of returns)
Here:
+$2,954
State:
+$9,151
(% of AGI for various income ranges: 6.3% for AGIs below $25k)
Taxable individual retirement arrangement distribution: $10,100 (reported on 3.1% of returns)
36852:
$10,100
Alabama:
$14,992
Total itemized deductions: $14,667 (26% of AGI, reported on 18.4% of returns)
Here:
$14,667
State:
$21,388
Here:
25.6% of AGI
State:
20.1% of AGI
(% of AGI for various income ranges: 4.8% for AGIs below $25k, 6.8% for AGIs $25k-50k, 8.9% for AGIs $50k-75k, 18.4% for AGIs $75k-100k)
Charity contributions: $3,333 (reported on 15.3% of returns)
Here:
$3,333
State:
$5,925
(% of AGI for various income ranges: 1.7% for AGIs $25k-50k, 1.5% for AGIs $50k-75k, 4.1% for AGIs $75k-100k)
Taxes paid: $3,272 (reported on 18.4% of returns)
36852:
$3,272
State:
$5,272
(% of AGI for various income ranges: 0.6% for AGIs below $25k, 1.2% for AGIs $25k-50k, 1.9% for AGIs $50k-75k, 5.3% for AGIs $75k-100k)
Earned income credit: $2,720 (reported on 35.7% of returns)
Here:
$2,720
State:
$2,646
(% of AGI for various income ranges: 12.3% for AGIs below $25k, 1.8% for AGIs $25k-50k)
Percentage of individuals using paid preparers for their 2012 taxes: 68.4%
Here:
68%
State:
60%
(% for various income ranges: 70.8% for AGIs below $25k, 66.7% for AGIs $25k-50k, 64.3% for AGIs $50k-75k, 100.0% for AGIs $75k-100k)
Averages for the 2004 tax year for zip code 36852, filed in 2005:
Average Adjusted Gross Income (AGI) in 2004: $30,652 (Individual Income Tax Returns)
Here:
$30,652
State:
$42,302
Salary/wage: $29,688 (reported on 90.2% of returns)
Here:
$29,688
State:
$36,626
(% of AGI for various income ranges: 133.2% for AGIs below $10k, 86.6% for AGIs $10k-25k, 94.1% for AGIs $25k-50k, 86.9% for AGIs $50k-75k, 86.6% for AGIs $75k-100k, 57.2% for AGIs over 100k)
Taxable interest for individuals: $592 (reported on 19.0% of returns)
This zip code:
$592
Alabama:
$1,827
(% of AGI for various income ranges: 1.9% for AGIs below $10k, 0.6% for AGIs $10k-25k, 0.2% for AGIs $25k-50k, 0.5% for AGIs $50k-75k, 0.4% for AGIs $75k-100k)
Taxable dividends: $241 (reported on 7.0% of returns)
Here:
$241
State:
$4,206
(% of AGI for various income ranges: 0.3% for AGIs below $10k, 0.1% for AGIs $25k-50k, 0.1% for AGIs $50k-75k, 0.0% for AGIs $75k-100k)
Net capital gain/loss: +$727 (reported on 5.3% of returns)
Here:
+$727
State:
+$13,031
Total itemized deductions: $13,427 (26% of AGI, reported on 20.7% of returns)
Here:
$13,427
State:
$17,623
Here:
26.1% of AGI
State:
20.8% of AGI
(% of AGI for various income ranges: 5.8% for AGIs $10k-25k, 8.9% for AGIs $25k-50k, 12.9% for AGIs $50k-75k, 10.0% for AGIs $75k-100k, 9.1% for AGIs over 100k)
Charity contributions deductions: $3,883 (7% of AGI, reported on 17.5% of returns)
Here:
$3,883
State:
$4,768
Here:
7.4% of AGI
State:
5.4% of AGI
(% of AGI for various income ranges: 1.1% for AGIs $10k-25k, 2.2% for AGIs $25k-50k, 3.5% for AGIs $50k-75k, 2.4% for AGIs $75k-100k, 2.1% for AGIs over 100k)
Total tax: $3,320 (reported on 65.0% of returns)
36852:
$3,320
State:
$6,905
(% of AGI for various income ranges: 4.3% for AGIs below $10k, 3.0% for AGIs $10k-25k, 5.3% for AGIs $25k-50k, 8.2% for AGIs $50k-75k, 9.9% for AGIs $75k-100k, 14.7% for AGIs over 100k)
Earned income credit: $1,970 (reported on 32.7% of returns)
Here:
$1,970
State:
$2,048
Percentage of individuals using paid preparers for their 2004 taxes: 73.2%
Here:
73%
State:
65%
(% for various income ranges: 75.3% for AGIs below $10k, 75.2% for AGIs $10k-25k, 72.2% for AGIs $25k-50k, 66.3% for AGIs $50k-75k, 63.6% for AGIs $75k-100k, 88.9% for AGIs over 100k)
Household received Food Stamps/SNAP in the past 12 months: 119 Household did not receive Food Stamps/SNAP in the past 12 months: 708
Women who had a birth in the past 12 months: 44 (0 now married, 34 unmarried) Women who did not have a birth in the past 12 months: 598 (319 now married, 278 unmarried)
Housing units in zip code 36852 with a mortgage: 399 (8 second mortgage, 8 both second mortgage and home equity loan) Median monthly owner costs for units with a mortgage: $1,145 Median monthly owner costs for units without a mortgage: $573
Residents with income below the poverty level in 2022:
This zip code:
19.9%
Whole state:
16.2%
Residents with income below 50% of the poverty level in 2022:
This zip code:
9.4%
Whole state:
8.6%
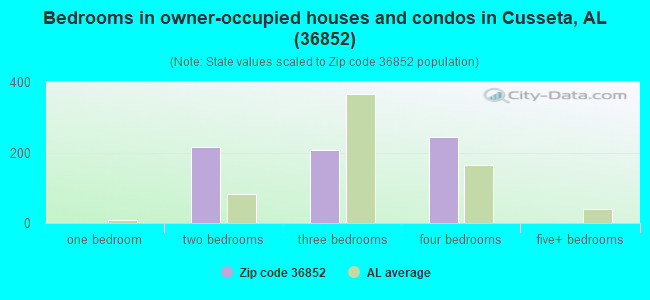
Median number of rooms in houses and condos:
Here:
5.9
State:
6.5
Median number of rooms in apartments:
Here:
5.1
State:
4.7
Notable locations in this zip code not listed on our city pages
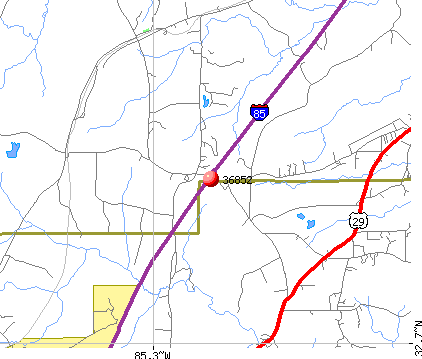
Notable locations in zip code 36852: Cusseta Volunteer Rural Fire and Rescue (A), Lee Chambers Fire Department Station 2 (B). Display/hide their locations on the map
Churches in zip code 36852 include: Wallace Chapel Church (A), Gethsemane Church (B), True Faith Church (C), Sweet Home Church (D), Mount Nebo Church (E), Old Path Church (F), Galilee Church (G). Display/hide their locations on the map
Size of family households: 205 2-persons, 89 3-persons, 122 4-persons, 161 5-persons, 1 7-or-more-persons
Size of nonfamily households: 230 1-person, 10 2-persons
571 married couples with children.
130 single-parent households (130 women).
99.1% of residents of 36852 zip code speak English at home.
0.2% of residents speak other Indo-European language at home (100% very well).
Foreign born population: 4 (0.2%) (100.0% of them are naturalized citizens)
This zip code:
0.2%
Whole state:
3.8%
25%France
25%Taiwan
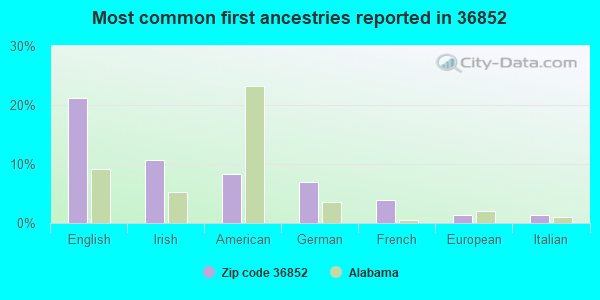
21%English
11%Irish
8%American
7%German
4%French
1%European
1%Italian
Year of entry for the foreign-born population
02010 or later
02000 to 2009
01990 to 1999
3Before 1990
Housing units lacking complete plumbing facilities: 7.2% Housing units lacking complete kitchen facilities: 7.1%
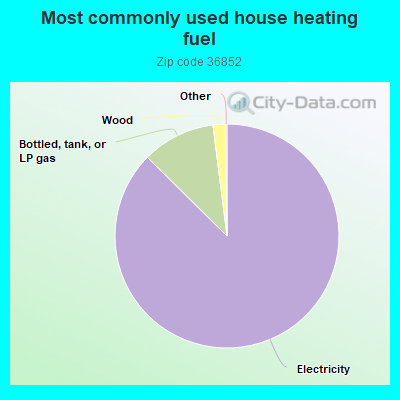
87.6%Electricity
10.6%Bottled, tank, or LP gas
1.8%Wood
Population in 1990: 4,597.
Place of birth for U.S.-born residents:
This state: 1,803
Midwest: 81
South: 307
West: 96
54% of the 36852 zip code residents lived in the same house 5 years ago. Out of people who lived in different houses, 37% lived in this county. Out of people who lived in different counties, 50% lived in Alabama.
95% of the 36852 zip code residents lived in the same house 1 year ago. Out of people who lived in different houses, 62% moved from this county. Out of people who lived in different houses, 34% moved from different county within same state.
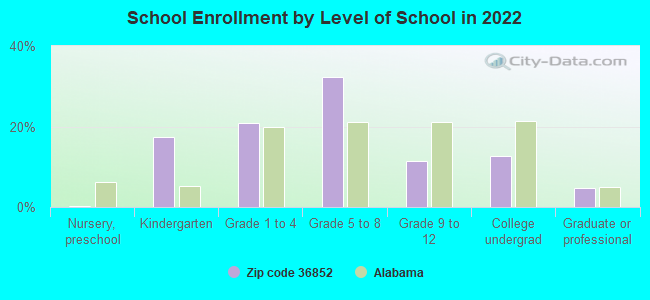
Private vs. public school enrollment:
Students in private schools in grades 1 to 8 (elementary and middle school): 30
Here:
7.7%
Alabama:
14.7%
Students in private schools in grades 9 to 12 (high school):
Here:
0.0%
Alabama:
16.3%
Students in private undergraduate colleges: 2
Here:
3.0%
Alabama:
14.6%
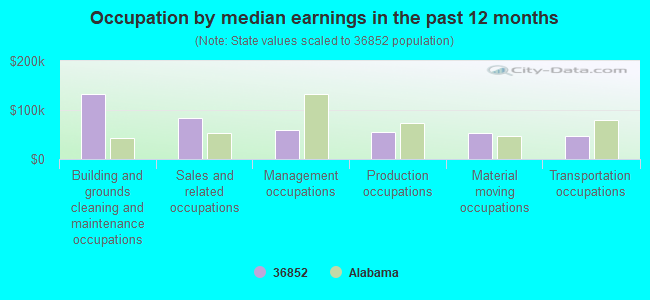
Occupation by median earnings in the past 12 months ($)
131,971Building and grounds cleaning and maintenance occupations
83,087Sales and related occupations
59,767Management occupations
54,995Production occupations
52,330Material moving occupations
47,593Transportation occupations
Top industries in this zip code by the number of employees in 2005:
Health Care and Social Assistance: Child Day Care Services (10-19 employees: 1 establishment, 1-4 employees: 1 establishment)
Accommodation and Food Services: Full-Service Restaurants (10-19: 1)
Mining: Dimension Stone Mining and Quarrying (10-19: 1)
Administrative and Support and Waste Management and Remediation Services: Landscaping Services (5-9: 1, 1-4: 1)
Real Estate and Rental and Leasing: Lessors of Residential Buildings and Dwellings (5-9: 1, 1-4: 1)
Fatal accident statistics in 2013:
Fatal accident count: 3
Vehicles involved in fatal accidents: 4
Fatal accidents caused by drunken drivers: 2
Fatalities: 3
Persons involved in fatal accidents: 7
Pedestrians involved in fatal accidents: 0
Fatal accident statistics in 2012:
Fatal accident count: 1
Vehicles involved in fatal accidents: 1
Fatal accidents caused by drunken drivers: 0
Fatalities: 2
Persons involved in fatal accidents: 4
Pedestrians involved in fatal accidents: 0
Home Mortgage Disclosure Act Aggregated Statistics For Year 2009 (Based on 1 partial tract)
A) FHA, FSA/RHS & VA Home Purchase Loans
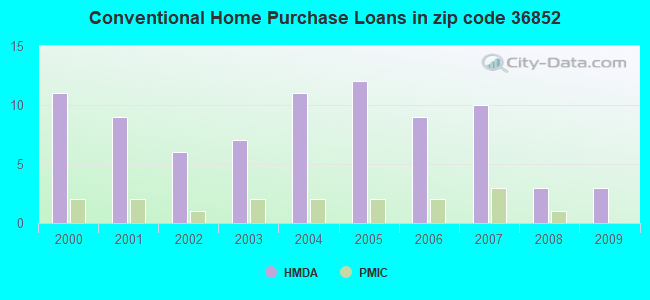
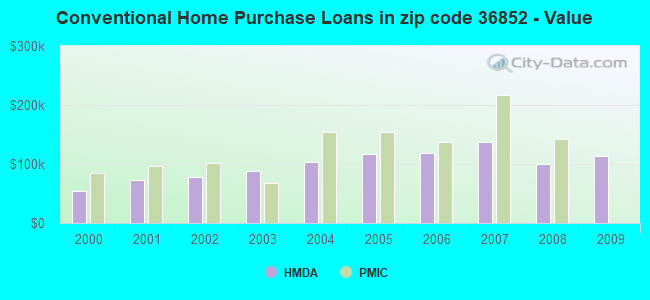
B) Conventional Home Purchase Loans
C) Refinancings
D) Home Improvement Loans
F) Non-occupant Loans on < 5 Family Dwellings (A B C & D)
G) Loans On Manufactured Home Dwelling (A B C & D)
Number
Average Value
Number
Average Value
Number
Average Value
Number
Average Value
Number
Average Value
Number
Average Value
LOANS ORIGINATED
2
$163,635
3
$114,367
14
$161,799
1
$69,440
2
$103,225
2
$38,475
APPLICATIONS APPROVED, NOT ACCEPTED
0
$0
0
$0
1
$87,860
0
$0
0
$0
0
$0
APPLICATIONS DENIED
1
$70,150
1
$101,000
7
$149,507
1
$65,810
1
$110,500
2
$61,525
APPLICATIONS WITHDRAWN
0
$0
0
$0
5
$137,804
0
$0
1
$65,340
0
$0
FILES CLOSED FOR INCOMPLETENESS
0
$0
0
$0
1
$168,090
0
$0
0
$0
0
$0
Aggregated Statistics For Year 2008 (Based on 1 partial tract)
A) FHA, FSA/RHS & VA Home Purchase Loans
B) Conventional Home Purchase Loans
C) Refinancings
D) Home Improvement Loans
F) Non-occupant Loans on < 5 Family Dwellings (A B C & D)
G) Loans On Manufactured Home Dwelling (A B C & D)
Number
Average Value
Number
Average Value
Number
Average Value
Number
Average Value
Number
Average Value
Number
Average Value
LOANS ORIGINATED
3
$137,867
3
$100,370
10
$163,716
2
$35,425
1
$191,430
4
$115,188
APPLICATIONS APPROVED, NOT ACCEPTED
0
$0
0
$0
1
$62,990
0
$0
0
$0
0
$0
APPLICATIONS DENIED
1
$59,820
0
$0
6
$145,765
3
$66,313
1
$148,380
2
$74,605
APPLICATIONS WITHDRAWN
1
$78,360
0
$0
4
$143,195
0
$0
0
$0
1
$60,410
FILES CLOSED FOR INCOMPLETENESS
0
$0
0
$0
1
$135,830
0
$0
0
$0
0
$0
Aggregated Statistics For Year 2007 (Based on 1 partial tract)
A) FHA, FSA/RHS & VA Home Purchase Loans
B) Conventional Home Purchase Loans
C) Refinancings
D) Home Improvement Loans
F) Non-occupant Loans on < 5 Family Dwellings (A B C & D)
G) Loans On Manufactured Home Dwelling (A B C & D)
Number
Average Value
Number
Average Value
Number
Average Value
Number
Average Value
Number
Average Value
Number
Average Value
LOANS ORIGINATED
4
$146,038
10
$138,097
11
$116,703
2
$79,530
4
$152,138
6
$66,568
APPLICATIONS APPROVED, NOT ACCEPTED
0
$0
1
$69,560
2
$172,080
1
$69,090
0
$0
1
$47,860
APPLICATIONS DENIED
0
$0
4
$76,890
6
$124,182
3
$28,113
1
$86,330
3
$57,673
APPLICATIONS WITHDRAWN
0
$0
1
$73,430
3
$137,943
1
$94,070
0
$0
1
$75,540
FILES CLOSED FOR INCOMPLETENESS
0
$0
1
$66,630
1
$96,070
0
$0
0
$0
0
$0
Aggregated Statistics For Year 2006 (Based on 1 partial tract)
A) FHA, FSA/RHS & VA Home Purchase Loans
B) Conventional Home Purchase Loans
C) Refinancings
D) Home Improvement Loans
F) Non-occupant Loans on < 5 Family Dwellings (A B C & D)
G) Loans On Manufactured Home Dwelling (A B C & D)
Number
Average Value
Number
Average Value
Number
Average Value
Number
Average Value
Number
Average Value
Number
Average Value
LOANS ORIGINATED
3
$158,357
9
$118,629
11
$101,176
2
$33,840
2
$164,335
6
$57,418
APPLICATIONS APPROVED, NOT ACCEPTED
0
$0
1
$143,110
2
$93,725
0
$0
0
$0
1
$45,980
APPLICATIONS DENIED
0
$0
4
$74,045
8
$96,934
4
$31,992
0
$0
4
$43,430
APPLICATIONS WITHDRAWN
0
$0
1
$143,930
4
$112,930
2
$38,590
0
$0
1
$72,840
FILES CLOSED FOR INCOMPLETENESS
0
$0
0
$0
1
$161,290
0
$0
0
$0
0
$0
Aggregated Statistics For Year 2005 (Based on 1 partial tract)
A) FHA, FSA/RHS & VA Home Purchase Loans
B) Conventional Home Purchase Loans
C) Refinancings
D) Home Improvement Loans
F) Non-occupant Loans on < 5 Family Dwellings (A B C & D)
G) Loans On Manufactured Home Dwelling (A B C & D)
Number
Average Value
Number
Average Value
Number
Average Value
Number
Average Value
Number
Average Value
Number
Average Value
LOANS ORIGINATED
3
$128,013
12
$116,616
12
$112,569
2
$51,555
3
$108,933
5
$52,692
APPLICATIONS APPROVED, NOT ACCEPTED
0
$0
2
$66,275
2
$154,365
1
$36,130
0
$0
1
$35,540
APPLICATIONS DENIED
0
$0
4
$54,838
11
$93,659
4
$28,152
1
$56,660
4
$54,868
APPLICATIONS WITHDRAWN
0
$0
1
$124,920
7
$107,547
1
$121,290
0
$0
2
$53,255
FILES CLOSED FOR INCOMPLETENESS
0
$0
0
$0
0
$0
0
$0
0
$0
0
$0
Aggregated Statistics For Year 2004 (Based on 1 partial tract)
A) FHA, FSA/RHS & VA Home Purchase Loans
B) Conventional Home Purchase Loans
C) Refinancings
D) Home Improvement Loans
F) Non-occupant Loans on < 5 Family Dwellings (A B C & D)
G) Loans On Manufactured Home Dwelling (A B C & D)
Number
Average Value
Number
Average Value
Number
Average Value
Number
Average Value
Number
Average Value
Number
Average Value
LOANS ORIGINATED
1
$129,730
11
$103,288
11
$106,956
3
$40,507
4
$88,328
6
$53,860
APPLICATIONS APPROVED, NOT ACCEPTED
0
$0
2
$84,810
3
$104,787
1
$61,580
0
$0
1
$41,060
APPLICATIONS DENIED
0
$0
4
$81,055
7
$102,470
2
$8,740
0
$0
4
$49,412
APPLICATIONS WITHDRAWN
0
$0
2
$73,725
4
$85,688
1
$102,640
0
$0
2
$73,780
FILES CLOSED FOR INCOMPLETENESS
0
$0
0
$0
2
$157,180
0
$0
0
$0
0
$0
Aggregated Statistics For Year 2003 (Based on 1 partial tract)
A) FHA, FSA/RHS & VA Home Purchase Loans
B) Conventional Home Purchase Loans
C) Refinancings
D) Home Improvement Loans
F) Non-occupant Loans on < 5 Family Dwellings (A B C & D)
Number
Average Value
Number
Average Value
Number
Average Value
Number
Average Value
Number
Average Value
LOANS ORIGINATED
1
$127,390
7
$87,891
22
$111,467
1
$50,910
2
$55,250
APPLICATIONS APPROVED, NOT ACCEPTED
0
$0
1
$68,030
3
$113,467
0
$0
0
$0
APPLICATIONS DENIED
0
$0
3
$58,650
7
$101,380
2
$30,085
1
$22,990
APPLICATIONS WITHDRAWN
0
$0
0
$0
3
$98,140
0
$0
0
$0
FILES CLOSED FOR INCOMPLETENESS
0
$0
0
$0
0
$0
0
$0
0
$0
Aggregated Statistics For Year 2002 (Based on 1 partial tract)
A) FHA, FSA/RHS & VA Home Purchase Loans
B) Conventional Home Purchase Loans
C) Refinancings
D) Home Improvement Loans
F) Non-occupant Loans on < 5 Family Dwellings (A B C & D)
Number
Average Value
Number
Average Value
Number
Average Value
Number
Average Value
Number
Average Value
LOANS ORIGINATED
1
$98,650
6
$77,300
16
$96,164
1
$14,660
2
$52,845
APPLICATIONS APPROVED, NOT ACCEPTED
0
$0
2
$42,695
2
$60,350
0
$0
0
$0
APPLICATIONS DENIED
0
$0
5
$62,122
5
$93,536
2
$17,890
0
$0
APPLICATIONS WITHDRAWN
0
$0
1
$126,800
2
$118,355
0
$0
0
$0
FILES CLOSED FOR INCOMPLETENESS
0
$0
0
$0
0
$0
0
$0
0
$0
Aggregated Statistics For Year 2001 (Based on 1 partial tract)
A) FHA, FSA/RHS & VA Home Purchase Loans
B) Conventional Home Purchase Loans
C) Refinancings
D) Home Improvement Loans
F) Non-occupant Loans on < 5 Family Dwellings (A B C & D)
Number
Average Value
Number
Average Value
Number
Average Value
Number
Average Value
Number
Average Value
LOANS ORIGINATED
2
$71,555
9
$72,857
12
$98,366
2
$29,620
2
$72,315
APPLICATIONS APPROVED, NOT ACCEPTED
0
$0
3
$37,223
2
$66,335
0
$0
0
$0
APPLICATIONS DENIED
0
$0
7
$53,673
5
$57,218
0
$0
0
$0
APPLICATIONS WITHDRAWN
0
$0
2
$67,035
3
$82,580
0
$0
0
$0
FILES CLOSED FOR INCOMPLETENESS
0
$0
0
$0
1
$32,140
0
$0
0
$0
Aggregated Statistics For Year 2000 (Based on 1 partial tract)
B) Conventional Home Purchase Loans
C) Refinancings
D) Home Improvement Loans
F) Non-occupant Loans on < 5 Family Dwellings (A B C & D)
Detailed PMIC statistics for the following Tracts:0418.00
2003 - 2018 National Fire Incident Reporting System (NFIRS) incidents
According to the data from the years 2003 - 2018 the average number of fire incidents per year is 8. The highest number of reported fires - 25 took place in 2006, and the least - 0 in 2008. The data has a growing trend.
When looking into fire subcategories, the most incidents belonged to: Outside Fires (53.5%), and Structure Fires (26.4%).
Fire incident types reported to NFIRS in Zip Code 36852


 Nearest zip codes: 36854, 36801, 36863, 36874, 36862, 31833.


 According to the data from the years 2003 - 2018 the average number of fire incidents per year is 8. The highest number of reported fires - 25 took place in 2006, and the least - 0 in 2008. The data has a growing trend.
 When looking into fire subcategories, the most incidents belonged to: Outside Fires (53.5%), and Structure Fires (26.4%).