Estimated zip code population in 2022: 2,764 Zip code population in 2010: 2,230 Zip code population in 2000: 1,777
Houses and condos: 1,201 Renter-occupied apartments: 99
% of renters here:
10%
State:
33%
March 2022 cost of living index in zip code 37060: 83.0 (low, U.S. average is 100)
Land area: 38.4 sq. mi. Water area: 0.0 sq. mi.
Population density: 72 people per square mile
(very low).
OSM Map
General Map
Google Map
MSN Map
OSM Map
General Map
Google Map
MSN Map
OSM Map
General Map
Google Map
MSN Map
OSM Map
General Map
Google Map
MSN Map
Please wait while loading the map...
Real estate property taxes paid for housing units in 2022:
This zip code:
0.3% ($1,571)
Tennessee:
0.5% ($1,376)
Median real estate property taxes paid for housing units with mortgages in 2022: $1,602 (0.4%) Median real estate property taxes paid for housing units with no mortgage in 2022: $1,527 (0.3%)
Business Search- 14 Million verified businesses
Males: 1,396
(50.5%)
Females: 1,367
(49.5%)
For population 25 years and over in 37060:
High school or higher: 92.3%
Bachelor's degree or higher: 33.6%
Graduate or professional degree: 9.6%
Unemployed: 1.1%
Mean travel time to work (commute): 35.6 minutes
For population 15 years and over in 37060:
Never married: 19.5%
Now married: 63.7%
Separated: 1.2%
Widowed: 6.3%
Divorced: 9.3%
Zip code 37060 compared to state average:
Median house value above state average.
Unemployed percentage significantly below state average.
Black race population percentage significantly below state average.
Hispanic race population percentage significantly below state average.
Foreign-born population percentage significantly below state average.
Renting percentage significantly below state average.
Length of stay since moving in above state average.
Estimated median house/condo value in 2022: $452,416
37060:
$452,416
Tennessee:
$284,800
According to our research of Tennessee and other state lists, there were 2 registered sex offenders living in 37060 zip code as of May 28, 2024. The ratio of all residents to sex offenders in zip code 37060 is 1,114 to 1. The ratio of registered sex offenders to all residents in this zip code is much lower than the state average.
Median resident age:
This zip code:
41.7 years
Tennessee median age:
39.2 years
Average household size:
This zip code:
2.7 people
Tennessee:
2.4 people
Averages for the 2020 tax year for zip code 37060, filed in 2021:
Average Adjusted Gross Income (AGI) in 2020: $72,899 (Individual Income Tax Returns)
Here:
$72,899
State:
$69,014
Salary/wage: $69,619 (reported on 80.7% of returns)
Here:
$69,619
State:
$55,872
(% of AGI for various income ranges: 1219.6% for AGIs below $25k, 3591.4% for AGIs $25k-50k, 6282.5% for AGIs $50k-75k, 9260.9% for AGIs $75k-100k, 18270.0% for AGIs $100k-200k, 45605.0% for AGIs over 200k)
Taxable interest for individuals: $991 (reported on 31.4% of returns)
This zip code:
$991
Tennessee:
$1,945
(% of AGI for various income ranges: 17.5% for AGIs below $25k, 48.1% for AGIs $25k-50k, 18.8% for AGIs $50k-75k, 34.5% for AGIs $75k-100k, 94.4% for AGIs $100k-200k, 167.5% for AGIs over 200k)
Ordinary dividends: $2,367 (reported on 15.0% of returns)
Here:
$2,367
State:
$8,105
(% of AGI for various income ranges: 22.5% for AGIs below $25k, 21.0% for AGIs $25k-50k, 11.2% for AGIs $50k-75k, 109.1% for AGIs $75k-100k, 101.9% for AGIs $100k-200k, 222.5% for AGIs over 200k)
Net capital gain/loss in AGI: +$12,238 (reported on 15.0% of returns)
Here:
+$12,238
State:
+$33,664
(% of AGI for various income ranges: 1.4% for AGIs below $25k, 18.6% for AGIs $25k-50k, 262.7% for AGIs $75k-100k, 251.3% for AGIs $100k-200k, 4590.0% for AGIs over 200k)
Profit/loss from business: +$17,412 (reported on 22.9% of returns)
Here:
+$17,412
State:
+$18,991
(% of AGI for various income ranges: 91.1% for AGIs below $25k, 314.3% for AGIs $25k-50k, 516.2% for AGIs $50k-75k, 59.1% for AGIs $75k-100k, 1110.0% for AGIs $100k-200k, 4975.0% for AGIs over 200k)
Taxable individual retirement arrangement distribution: $16,800 (reported on 8.6% of returns)
37060:
$16,800
Tennessee:
$20,036
(% of AGI for various income ranges: 161.8% for AGIs below $25k, 366.2% for AGIs $50k-75k, 610.6% for AGIs $100k-200k)
Total itemized deductions: $35,067 (reported on 8.6% of returns)
Here:
$35,067
State:
$40,136
(% of AGI for various income ranges: 379.5% for AGIs $25k-50k, 879.4% for AGIs $100k-200k, 5010.0% for AGIs over 200k)
Charity contributions: $11,778 (reported on 6.4% of returns)
Here:
$11,778
State:
$19,852
(% of AGI for various income ranges: 41.9% for AGIs $25k-50k, 234.4% for AGIs $100k-200k, 1492.5% for AGIs over 200k)
Taxes paid: $5,083 (reported on 8.6% of returns)
37060:
$5,083
State:
$6,038
(% of AGI for various income ranges: 45.2% for AGIs $25k-50k, 152.5% for AGIs $100k-200k, 677.5% for AGIs over 200k)
Earned income credit: $2,431 (reported on 11.4% of returns)
Here:
$2,431
State:
$2,391
(% of AGI for various income ranges: 85.7% for AGIs below $25k, 71.0% for AGIs $25k-50k)
Percentage of individuals using paid preparers for their 2020 taxes: 93.6%
Here:
94%
State:
93%
(% for various income ranges: 92.7% for AGIs below $25k, 92.9% for AGIs $25k-50k, 95.2% for AGIs $50k-75k, 93.3% for AGIs $75k-100k, 92.6% for AGIs $100k-200k, 100.0% for AGIs over 200k)
Averages for the 2012 tax year for zip code 37060, filed in 2013:
Average Adjusted Gross Income (AGI) in 2012: $50,963 (Individual Income Tax Returns)
Here:
$50,963
State:
$53,767
Salary/wage: $48,224 (reported on 84.3% of returns)
Here:
$48,224
State:
$45,421
(% of AGI for various income ranges: 78.7% for AGIs below $25k, 79.3% for AGIs $25k-50k, 80.9% for AGIs $50k-75k, 83.6% for AGIs $75k-100k, 77.6% for AGIs $100k-200k)
Taxable interest for individuals: $677 (reported on 32.4% of returns)
This zip code:
$677
Tennessee:
$1,732
(% of AGI for various income ranges: 1.1% for AGIs below $25k, 0.5% for AGIs $25k-50k, 0.4% for AGIs $50k-75k, 0.2% for AGIs $75k-100k, 0.3% for AGIs $100k-200k)
Ordinary dividends: $2,313 (reported on 13.9% of returns)
Here:
$2,313
State:
$6,739
(% of AGI for various income ranges: 1.0% for AGIs below $25k, 0.4% for AGIs $25k-50k, 0.5% for AGIs $50k-75k, 1.0% for AGIs $100k-200k)
Net capital gain/loss in AGI: +$850 (reported on 11.1% of returns)
Here:
+$850
State:
+$19,082
(% of AGI for various income ranges: 0.5% for AGIs $50k-75k, 0.5% for AGIs $75k-100k)
Profit/loss from business: +$12,727 (reported on 20.4% of returns)
Here:
+$12,727
State:
+$15,240
(% of AGI for various income ranges: 9.4% for AGIs below $25k, 6.2% for AGIs $25k-50k, 4.3% for AGIs $50k-75k, 4.6% for AGIs $75k-100k, 4.2% for AGIs $100k-200k)
Taxable individual retirement arrangement distribution: $7,912 (reported on 7.4% of returns)
37060:
$7,912
Tennessee:
$15,505
(% of AGI for various income ranges: 3.7% for AGIs below $25k, 3.1% for AGIs $25k-50k, 1.6% for AGIs $75k-100k)
Total itemized deductions: $19,591 (19% of AGI, reported on 21.3% of returns)
Here:
$19,591
State:
$21,976
Here:
19.3% of AGI
State:
17.8% of AGI
(% of AGI for various income ranges: 5.5% for AGIs below $25k, 7.0% for AGIs $25k-50k, 8.0% for AGIs $50k-75k, 9.4% for AGIs $75k-100k, 9.0% for AGIs $100k-200k)
Charity contributions: $4,939 (reported on 16.7% of returns)
Here:
$4,939
State:
$6,709
(% of AGI for various income ranges: 1.5% for AGIs $25k-50k, 1.2% for AGIs $50k-75k, 1.9% for AGIs $75k-100k, 2.2% for AGIs $100k-200k)
Taxes paid: $3,961 (reported on 21.3% of returns)
37060:
$3,961
State:
$4,829
(% of AGI for various income ranges: 0.9% for AGIs below $25k, 1.4% for AGIs $25k-50k, 1.3% for AGIs $50k-75k, 1.8% for AGIs $75k-100k, 2.1% for AGIs $100k-200k)
Earned income credit: $2,095 (reported on 17.6% of returns)
Here:
$2,095
State:
$2,404
(% of AGI for various income ranges: 6.1% for AGIs below $25k, 1.1% for AGIs $25k-50k)
Percentage of individuals using paid preparers for their 2012 taxes: 55.6%
Here:
56%
State:
52%
(% for various income ranges: 53.8% for AGIs below $25k, 51.9% for AGIs $25k-50k, 57.9% for AGIs $50k-75k, 54.5% for AGIs $75k-100k, 66.7% for AGIs $100k-200k)
Averages for the 2004 tax year for zip code 37060, filed in 2005:
Average Adjusted Gross Income (AGI) in 2004: $41,070 (Individual Income Tax Returns)
Here:
$41,070
State:
$44,088
Salary/wage: $37,695 (reported on 85.2% of returns)
Here:
$37,695
State:
$38,825
(% of AGI for various income ranges: 124.8% for AGIs below $10k, 76.5% for AGIs $10k-25k, 83.1% for AGIs $25k-50k, 83.6% for AGIs $50k-75k, 84.8% for AGIs $75k-100k, 61.5% for AGIs over 100k)
Taxable interest for individuals: $1,451 (reported on 35.5% of returns)
This zip code:
$1,451
Tennessee:
$1,802
(% of AGI for various income ranges: 6.6% for AGIs below $10k, 2.6% for AGIs $10k-25k, 0.6% for AGIs $25k-50k, 0.9% for AGIs $50k-75k, 0.5% for AGIs $75k-100k, 1.9% for AGIs over 100k)
Taxable dividends: $1,510 (reported on 15.4% of returns)
Here:
$1,510
State:
$3,727
(% of AGI for various income ranges: 1.9% for AGIs below $10k, 0.4% for AGIs $10k-25k, 0.6% for AGIs $25k-50k, 0.3% for AGIs $50k-75k, 0.5% for AGIs $75k-100k, 0.9% for AGIs over 100k)
Net capital gain/loss: +$9,402 (reported on 17.4% of returns)
Here:
+$9,402
State:
+$15,776
(% of AGI for various income ranges: -0.7% for AGIs below $10k, -0.1% for AGIs $10k-25k, -0.3% for AGIs $25k-50k, 1.7% for AGIs $50k-75k, 1.7% for AGIs $75k-100k, 13.6% for AGIs over 100k)
Profit/loss from business: +$12,020 (reported on 20.8% of returns)
Here:
+$12,020
State:
+$12,882
(% of AGI for various income ranges: 17.3% for AGIs below $10k, 10.5% for AGIs $10k-25k, 6.1% for AGIs $25k-50k, 3.1% for AGIs $50k-75k, 5.9% for AGIs $75k-100k, 6.9% for AGIs over 100k)
IRA payment deduction: $2,909 (reported on 1.2% of returns)
37060:
$2,909
Tennessee:
$2,934
Total itemized deductions: $14,915 (21% of AGI, reported on 22.6% of returns)
Here:
$14,915
State:
$18,035
Here:
21.3% of AGI
State:
19.9% of AGI
(% of AGI for various income ranges: 7.4% for AGIs $10k-25k, 9.9% for AGIs $25k-50k, 8.0% for AGIs $50k-75k, 9.4% for AGIs $75k-100k, 6.9% for AGIs over 100k)
Charity contributions deductions: $3,415 (5% of AGI, reported on 18.7% of returns)
Here:
$3,415
State:
$5,167
Here:
4.5% of AGI
State:
5.3% of AGI
(% of AGI for various income ranges: 0.5% for AGIs $10k-25k, 1.3% for AGIs $25k-50k, 1.2% for AGIs $50k-75k, 2.2% for AGIs $75k-100k, 2.2% for AGIs over 100k)
Total tax: $5,674 (reported on 76.9% of returns)
37060:
$5,674
State:
$7,482
(% of AGI for various income ranges: 5.9% for AGIs below $10k, 4.9% for AGIs $10k-25k, 7.2% for AGIs $25k-50k, 8.8% for AGIs $50k-75k, 10.9% for AGIs $75k-100k, 18.0% for AGIs over 100k)
Earned income credit: $1,615 (reported on 15.7% of returns)
Here:
$1,615
State:
$1,826
Percentage of individuals using paid preparers for their 2004 taxes: 63.3%
Here:
63%
State:
60%
(% for various income ranges: 52.7% for AGIs below $10k, 68.6% for AGIs $10k-25k, 64.0% for AGIs $25k-50k, 63.2% for AGIs $50k-75k, 62.5% for AGIs $75k-100k, 75.4% for AGIs over 100k)
Household received Food Stamps/SNAP in the past 12 months: 33 Household did not receive Food Stamps/SNAP in the past 12 months: 994
Women who had a birth in the past 12 months: 17 (18 now married, 0 unmarried) Women who did not have a birth in the past 12 months: 497 (370 now married, 127 unmarried)
Housing units in zip code 37060 with a mortgage: 586 (30 second mortgage, 22 both second mortgage and home equity loan) Houses without a mortgage: 28
Median monthly owner costs for units with a mortgage: $1,437 Median monthly owner costs for units without a mortgage: $493
Residents with income below the poverty level in 2022:
This zip code:
5.5%
Whole state:
13.3%
Residents with income below 50% of the poverty level in 2022:
This zip code:
4.1%
Whole state:
7.1%
Median number of rooms in houses and condos:
Here:
7.0
State:
6.5
Median number of rooms in apartments:
Here:
5.5
State:
4.4
Notable locations in this zip code not listed on our city pages
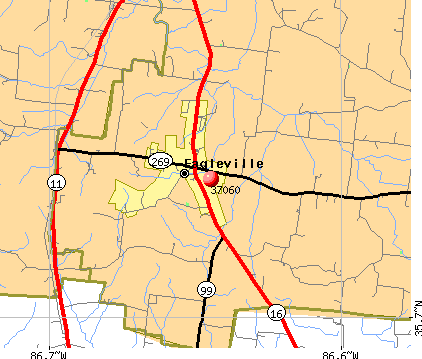
Churches in zip code 37060 include: Union Ridge Church (A), Mount Vernon Church (B), Mount Pleasant Church (C), Eagleville Baptist Church (D). Display/hide their locations on the map
Cemeteries: Hughes Cemetery (1), Scott Cemetery (2), Kelley Cemetery (3), King Cemetery (4), Guy Cemetery (5), Wood Cemetery (6), Wilson Cemetery (7). Display/hide their locations on the map
In group quarters: 4 (-1 institutionalized population)
Size of family households: 305 2-persons, 186 3-persons, 150 4-persons, 89 5-persons, 33 6-persons, 12 7-or-more-persons
Size of nonfamily households: 211 1-person, 32 2-persons, 1 3-persons
653 married couples with children.
56 single-parent households (8 men, 48 women).
98.3% of residents of 37060 zip code speak English at home.
0.6% of residents speak Spanish at home (56% very well, 19% well, 25% not well).
0.1% of residents speak other Indo-European language at home (100% very well).
0.6% of residents speak Asian or Pacific Island language at home (100% very well).
Foreign born population: 47 (1.7%) (26.4% of them are naturalized citizens)
This zip code:
1.7%
Whole state:
5.6%
74%United Kingdom, excluding England and Scotland
62%Sweden
9%Japan
6%El Salvador
4%Costa Rica
4%Honduras
4%Brazil
43%American
13%English
8%German
7%Irish
2%Scottish
2%French
2%Norwegian
Year of entry for the foreign-born population
12010 or later
412000 to 2009
31990 to 1999
2Before 1990
Facilities with environmental interests located in this zip code:
EAGLEVILLE SCHOOL (500 HWY 99 in EAGLEVILLE, TN)
(Geographic Names Information System) (National Center for Education Statistics) - STATE ID-0035 Organizations: RUTHERFORD COUNTY SCHOOL DIST (SCHOOL DISTRICT)
Housing units lacking complete plumbing facilities: 7.5% Housing units lacking complete kitchen facilities: 3.1%
54.6%Electricity
33.5%Utility gas
6.0%Bottled, tank, or LP gas
4.6%Wood
1.8%Fuel oil, kerosene, etc.
Population in 1990: 1,562. Population change in the 1990s: +215 (+13.8%).
Place of birth for U.S.-born residents:
This state: 1,685
Northeast: 18
Midwest: 272
South: 324
West: 427
62% of the 37060 zip code residents lived in the same house 5 years ago. Out of people who lived in different houses, 42% lived in this county. Out of people who lived in different counties, 50% lived in Tennessee.
91% of the 37060 zip code residents lived in the same house 1 year ago. Out of people who lived in different houses, 47% moved from this county. Out of people who lived in different houses, 18% moved from different county within same state. Out of people who lived in different houses, 36% moved from different state.
Private vs. public school enrollment:
Students in private schools in grades 1 to 8 (elementary and middle school): 13
Here:
2.8%
Tennessee:
15.0%
Students in private schools in grades 9 to 12 (high school): 2
Here:
2.6%
Tennessee:
16.2%
Students in private undergraduate colleges: 7
Here:
16.6%
Tennessee:
23.5%
Occupation by median earnings in the past 12 months ($)
122,136Computer and mathematical occupations
114,637Health diagnosing and treating practitioners and other technical occupations
88,682Management occupations
85,791Architecture and engineering occupations
79,505Transportation occupations
79,434Business and financial operations occupations
Companies with federal contracts located in this zip code:
PANSYSTEM SRL (VIA VERDI 26 D in CASTEL D'AZZANO, In; small business) : $672,000 in 4 contractsfrom 1999 to 2000
$168,000 with Public Buildings Service for Lease or Rental of Facilities -- Office Buildings. Taking place in WA. Signed on 2000-03-15. Completion date: 2000-03-15.
$168,000, same as above.Signed on 1999-12-15. Completion date: 1999-12-15.
$168,000, same as above.Signed on 2000-09-15. Completion date: 2000-09-15.
$168,000, same as above.Signed on 2000-06-15. Completion date: 2000-06-15.
Top industries in this zip code by the number of employees in 2005:
Health Care and Social Assistance: Nursing Care Facilities (100-249 employees: 1 establishment)
Construction: Drywall and Insulation Contractors (20-49: 1)
Construction: New Single-Family Housing Construction (except Operative Builders) (10-19: 1, 5-9: 1, 1-4: 1)
Accommodation and Food Services: Full-Service Restaurants (5-9: 1, 1-4: 1)
Construction: New Housing Operative Builders (5-9: 1)
People in group quarters in 2000:
11 people in homes for the mentally ill
Fatal accident statistics in 2012:
Fatal accident count: 1
Vehicles involved in fatal accidents: 1
Fatal accidents caused by drunken drivers: 0
Fatalities: 1
Persons involved in fatal accidents: 1
Pedestrians involved in fatal accidents: 0
Home Mortgage Disclosure Act Aggregated Statistics For Year 2009 (Based on 2 partial tracts)
A) FHA, FSA/RHS & VA Home Purchase Loans
B) Conventional Home Purchase Loans
C) Refinancings
D) Home Improvement Loans
F) Non-occupant Loans on < 5 Family Dwellings (A B C & D)
G) Loans On Manufactured Home Dwelling (A B C & D)
Number
Average Value
Number
Average Value
Number
Average Value
Number
Average Value
Number
Average Value
Number
Average Value
LOANS ORIGINATED
39
$169,208
23
$169,869
117
$173,018
6
$81,293
4
$119,490
5
$106,510
APPLICATIONS APPROVED, NOT ACCEPTED
1
$133,660
2
$310,360
10
$169,422
1
$7,000
1
$241,430
1
$69,980
APPLICATIONS DENIED
3
$102,637
2
$75,230
45
$139,789
8
$35,602
1
$125,960
2
$68,230
APPLICATIONS WITHDRAWN
3
$122,467
6
$177,867
32
$179,805
1
$34,290
2
$65,780
2
$104,620
FILES CLOSED FOR INCOMPLETENESS
1
$88,870
0
$0
4
$159,730
0
$0
0
$0
0
$0
Aggregated Statistics For Year 2008 (Based on 2 partial tracts)
A) FHA, FSA/RHS & VA Home Purchase Loans
B) Conventional Home Purchase Loans
C) Refinancings
D) Home Improvement Loans
F) Non-occupant Loans on < 5 Family Dwellings (A B C & D)
G) Loans On Manufactured Home Dwelling (A B C & D)
Number
Average Value
Number
Average Value
Number
Average Value
Number
Average Value
Number
Average Value
Number
Average Value
LOANS ORIGINATED
24
$155,968
38
$162,483
78
$157,975
9
$60,882
8
$111,880
6
$110,452
APPLICATIONS APPROVED, NOT ACCEPTED
1
$225,340
5
$100,072
5
$172,570
3
$57,150
1
$86,080
3
$75,580
APPLICATIONS DENIED
3
$145,327
10
$115,467
57
$141,163
13
$72,510
1
$125,260
4
$74,702
APPLICATIONS WITHDRAWN
3
$118,500
5
$180,968
29
$134,941
1
$4,200
1
$179,150
1
$107,070
FILES CLOSED FOR INCOMPLETENESS
1
$102,170
3
$139,493
3
$129,930
0
$0
1
$74,180
0
$0
Aggregated Statistics For Year 2007 (Based on 2 partial tracts)
A) FHA, FSA/RHS & VA Home Purchase Loans
B) Conventional Home Purchase Loans
C) Refinancings
D) Home Improvement Loans
F) Non-occupant Loans on < 5 Family Dwellings (A B C & D)
G) Loans On Manufactured Home Dwelling (A B C & D)
Number
Average Value
Number
Average Value
Number
Average Value
Number
Average Value
Number
Average Value
Number
Average Value
LOANS ORIGINATED
13
$173,658
102
$153,400
73
$131,064
13
$54,208
7
$104,270
12
$79,311
APPLICATIONS APPROVED, NOT ACCEPTED
0
$0
10
$165,363
10
$136,041
3
$17,030
0
$0
1
$43,390
APPLICATIONS DENIED
2
$227,085
24
$137,511
56
$141,122
22
$47,332
1
$287,620
11
$77,933
APPLICATIONS WITHDRAWN
1
$143,460
13
$158,747
21
$155,855
4
$29,568
0
$0
1
$25,190
FILES CLOSED FOR INCOMPLETENESS
0
$0
2
$144,510
9
$142,914
0
$0
0
$0
0
$0
Aggregated Statistics For Year 2006 (Based on 2 partial tracts)
A) FHA, FSA/RHS & VA Home Purchase Loans
B) Conventional Home Purchase Loans
C) Refinancings
D) Home Improvement Loans
F) Non-occupant Loans on < 5 Family Dwellings (A B C & D)
G) Loans On Manufactured Home Dwelling (A B C & D)
Number
Average Value
Number
Average Value
Number
Average Value
Number
Average Value
Number
Average Value
Number
Average Value
LOANS ORIGINATED
18
$158,427
112
$122,934
74
$131,723
15
$40,122
15
$105,063
4
$63,682
APPLICATIONS APPROVED, NOT ACCEPTED
0
$0
12
$124,214
15
$162,074
3
$70,913
3
$123,163
2
$75,230
APPLICATIONS DENIED
3
$141,360
16
$133,881
43
$151,547
10
$23,233
3
$44,320
6
$91,323
APPLICATIONS WITHDRAWN
2
$145,560
15
$113,507
38
$151,028
1
$52,490
1
$97,970
1
$79,080
FILES CLOSED FOR INCOMPLETENESS
0
$0
1
$176,350
10
$156,895
1
$10,500
0
$0
0
$0
Aggregated Statistics For Year 2005 (Based on 2 partial tracts)
A) FHA, FSA/RHS & VA Home Purchase Loans
B) Conventional Home Purchase Loans
C) Refinancings
D) Home Improvement Loans
F) Non-occupant Loans on < 5 Family Dwellings (A B C & D)
G) Loans On Manufactured Home Dwelling (A B C & D)
Number
Average Value
Number
Average Value
Number
Average Value
Number
Average Value
Number
Average Value
Number
Average Value
LOANS ORIGINATED
15
$128,717
87
$122,023
78
$116,660
15
$44,274
10
$77,678
12
$83,276
APPLICATIONS APPROVED, NOT ACCEPTED
0
$0
8
$139,872
11
$90,402
2
$86,075
1
$151,160
1
$77,680
APPLICATIONS DENIED
1
$187,550
20
$113,997
58
$116,227
17
$36,801
4
$77,852
11
$85,566
APPLICATIONS WITHDRAWN
2
$124,215
18
$113,368
52
$130,365
3
$118,733
1
$7,000
4
$75,752
FILES CLOSED FOR INCOMPLETENESS
1
$60,180
4
$89,925
3
$150,923
1
$18,890
0
$0
0
$0
Aggregated Statistics For Year 2004 (Based on 2 partial tracts)
A) FHA, FSA/RHS & VA Home Purchase Loans
B) Conventional Home Purchase Loans
C) Refinancings
D) Home Improvement Loans
F) Non-occupant Loans on < 5 Family Dwellings (A B C & D)
G) Loans On Manufactured Home Dwelling (A B C & D)
Number
Average Value
Number
Average Value
Number
Average Value
Number
Average Value
Number
Average Value
Number
Average Value
LOANS ORIGINATED
14
$135,061
53
$113,922
101
$115,252
11
$35,690
8
$68,842
8
$81,614
APPLICATIONS APPROVED, NOT ACCEPTED
1
$79,780
8
$95,522
21
$119,632
1
$12,600
1
$75,580
3
$101,237
APPLICATIONS DENIED
3
$126,197
21
$107,403
83
$107,896
6
$40,122
2
$225,335
17
$86,116
APPLICATIONS WITHDRAWN
1
$97,270
7
$95,073
48
$104,037
4
$41,462
1
$7,000
3
$113,600
FILES CLOSED FOR INCOMPLETENESS
0
$0
1
$221,140
12
$136,694
2
$146,960
0
$0
0
$0
Aggregated Statistics For Year 2003 (Based on 2 partial tracts)
A) FHA, FSA/RHS & VA Home Purchase Loans
B) Conventional Home Purchase Loans
C) Refinancings
D) Home Improvement Loans
F) Non-occupant Loans on < 5 Family Dwellings (A B C & D)
Number
Average Value
Number
Average Value
Number
Average Value
Number
Average Value
Number
Average Value
LOANS ORIGINATED
22
$129,368
52
$106,921
183
$102,813
8
$18,282
8
$65,081
APPLICATIONS APPROVED, NOT ACCEPTED
0
$0
6
$70,447
36
$109,169
1
$30,090
1
$149,060
APPLICATIONS DENIED
7
$100,571
17
$77,719
67
$93,053
6
$12,130
3
$63,683
APPLICATIONS WITHDRAWN
3
$119,200
9
$115,311
37
$107,296
1
$68,580
0
$0
FILES CLOSED FOR INCOMPLETENESS
0
$0
2
$43,040
8
$123,165
0
$0
0
$0
Aggregated Statistics For Year 2002 (Based on 2 partial tracts)
A) FHA, FSA/RHS & VA Home Purchase Loans
B) Conventional Home Purchase Loans
C) Refinancings
D) Home Improvement Loans
F) Non-occupant Loans on < 5 Family Dwellings (A B C & D)
Number
Average Value
Number
Average Value
Number
Average Value
Number
Average Value
Number
Average Value
LOANS ORIGINATED
21
$102,604
38
$99,040
106
$107,373
6
$18,545
4
$64,732
APPLICATIONS APPROVED, NOT ACCEPTED
1
$161,650
4
$67,005
22
$99,849
1
$4,900
2
$22,745
APPLICATIONS DENIED
2
$97,970
11
$84,295
58
$93,930
9
$24,493
0
$0
APPLICATIONS WITHDRAWN
2
$104,970
1
$69,280
34
$96,202
1
$5,600
0
$0
FILES CLOSED FOR INCOMPLETENESS
0
$0
0
$0
6
$71,030
1
$31,490
1
$71,380
Aggregated Statistics For Year 2001 (Based on 2 partial tracts)
A) FHA, FSA/RHS & VA Home Purchase Loans
B) Conventional Home Purchase Loans
C) Refinancings
D) Home Improvement Loans
F) Non-occupant Loans on < 5 Family Dwellings (A B C & D)
Number
Average Value
Number
Average Value
Number
Average Value
Number
Average Value
Number
Average Value
LOANS ORIGINATED
29
$106,346
32
$91,608
119
$102,435
11
$20,295
6
$136,578
APPLICATIONS APPROVED, NOT ACCEPTED
1
$59,480
5
$52,486
15
$69,513
1
$55,980
1
$48,290
APPLICATIONS DENIED
1
$104,970
17
$67,510
59
$86,170
10
$11,407
1
$122,470
APPLICATIONS WITHDRAWN
1
$164,450
6
$112,085
43
$84,871
1
$7,000
1
$70,680
FILES CLOSED FOR INCOMPLETENESS
1
$58,780
0
$0
5
$89,014
0
$0
0
$0
Aggregated Statistics For Year 2000 (Based on 2 partial tracts)
A) FHA, FSA/RHS & VA Home Purchase Loans
B) Conventional Home Purchase Loans
C) Refinancings
D) Home Improvement Loans
F) Non-occupant Loans on < 5 Family Dwellings (A B C & D)
Number
Average Value
Number
Average Value
Number
Average Value
Number
Average Value
Number
Average Value
LOANS ORIGINATED
22
$113,113
53
$88,611
41
$274,441
15
$13,809
2
$59,485
APPLICATIONS APPROVED, NOT ACCEPTED
1
$67,180
11
$68,008
15
$72,453
5
$13,856
0
$0
APPLICATIONS DENIED
2
$81,525
21
$52,851
41
$77,985
13
$19,810
2
$25,195
APPLICATIONS WITHDRAWN
6
$89,808
5
$96,992
23
$92,373
1
$10,500
0
$0
FILES CLOSED FOR INCOMPLETENESS
0
$0
1
$83,980
8
$137,948
0
$0
0
$0
Aggregated Statistics For Year 1999 (Based on 1 partial tract)
A) FHA, FSA/RHS & VA Home Purchase Loans
B) Conventional Home Purchase Loans
C) Refinancings
D) Home Improvement Loans
F) Non-occupant Loans on < 5 Family Dwellings (A B C & D)
Detailed PMIC statistics for the following Tracts:0408.02
2004 - 2018 National Fire Incident Reporting System (NFIRS) incidents
According to the data from the years 2004 - 2018 the average number of fire incidents per year is 28. The highest number of fires - 49 took place in 2010, and the least - 5 in 2005. The data has an increasing trend.
When looking into fire subcategories, the most incidents belonged to: Outside Fires (48.3%), and Structure Fires (39.7%).
Fire incident types reported to NFIRS in Zip Code 37060


 Nearest zip codes: 37046, 37153, 37034, 37014, 37180, 37128.


 According to the data from the years 2004 - 2018 the average number of fire incidents per year is 28. The highest number of fires - 49 took place in 2010, and the least - 5 in 2005. The data has an increasing trend.
 When looking into fire subcategories, the most incidents belonged to: Outside Fires (48.3%), and Structure Fires (39.7%).