Estimated zip code population in 2022: 5,300 Zip code population in 2010: 5,153 Zip code population in 2000: 4,744
Houses and condos: 2,252 Renter-occupied apartments: 450
% of renters here:
25%
State:
33%
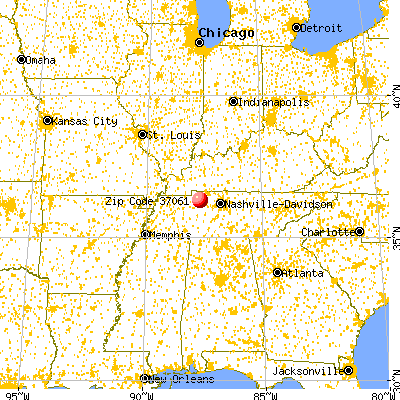
March 2022 cost of living index in zip code 37061: 79.2 (low, U.S. average is 100)
Land area: 96.2 sq. mi. Water area: 0.0 sq. mi.
Population density: 55 people per square mile
(very low).
OSM Map
General Map
Google Map
MSN Map
OSM Map
General Map
Google Map
MSN Map
OSM Map
General Map
Google Map
MSN Map
OSM Map
General Map
Google Map
MSN Map
Please wait while loading the map...
Real estate property taxes paid for housing units in 2022:
This zip code:
0.4% ($917)
Tennessee:
0.5% ($1,376)
Median real estate property taxes paid for housing units with mortgages in 2022: $980 (0.4%) Median real estate property taxes paid for housing units with no mortgage in 2022: $811 (0.5%)
Averages for the 2020 tax year for zip code 37061, filed in 2021:
Average Adjusted Gross Income (AGI) in 2020: $49,463 (Individual Income Tax Returns)
Here:
$49,463
State:
$69,014
Salary/wage: $44,797 (reported on 81.7% of returns)
Here:
$44,797
State:
$55,872
(% of AGI for various income ranges: 1157.9% for AGIs below $25k, 3559.2% for AGIs $25k-50k, 6192.9% for AGIs $50k-75k, 9128.6% for AGIs $75k-100k, 15115.3% for AGIs $100k-200k)
Taxable interest for individuals: $1,087 (reported on 24.4% of returns)
This zip code:
$1,087
Tennessee:
$1,945
(% of AGI for various income ranges: 21.1% for AGIs below $25k, 8.8% for AGIs $25k-50k, 49.6% for AGIs $50k-75k, 45.7% for AGIs $75k-100k, 120.0% for AGIs $100k-200k)
Ordinary dividends: $2,100 (reported on 8.9% of returns)
Here:
$2,100
State:
$8,105
(% of AGI for various income ranges: 6.4% for AGIs below $25k, 5.4% for AGIs $25k-50k, 17.1% for AGIs $50k-75k, 64.3% for AGIs $75k-100k, 135.3% for AGIs $100k-200k)
Net capital gain/loss in AGI: +$12,000 (reported on 8.0% of returns)
Here:
+$12,000
State:
+$33,664
(% of AGI for various income ranges: 6.1% for AGIs below $25k, 22.5% for AGIs $25k-50k, 62.1% for AGIs $50k-75k, 107.9% for AGIs $75k-100k, 1063.3% for AGIs $100k-200k)
Profit/loss from business: +$15,855 (reported on 14.6% of returns)
Here:
+$15,855
State:
+$18,991
(% of AGI for various income ranges: 143.0% for AGIs below $25k, 208.3% for AGIs $25k-50k, 327.9% for AGIs $50k-75k, 88.6% for AGIs $75k-100k, 1421.3% for AGIs $100k-200k)
Taxable individual retirement arrangement distribution: $11,454 (reported on 6.1% of returns)
37061:
$11,454
Tennessee:
$20,036
(% of AGI for various income ranges: 33.4% for AGIs below $25k, 36.9% for AGIs $25k-50k, 202.9% for AGIs $50k-75k, 414.0% for AGIs $100k-200k)
Total itemized deductions: $23,950 (reported on 1.9% of returns)
Here:
$23,950
State:
$40,136
(% of AGI for various income ranges: 638.7% for AGIs $100k-200k)
Charity contributions: $9,267 (reported on 1.4% of returns)
Here:
$9,267
State:
$19,852
(% of AGI for various income ranges: 185.3% for AGIs $100k-200k)
Taxes paid: $4,275 (reported on 1.9% of returns)
37061:
$4,275
State:
$6,038
(% of AGI for various income ranges: 114.0% for AGIs $100k-200k)
Earned income credit: $2,538 (reported on 22.1% of returns)
Here:
$2,538
State:
$2,391
(% of AGI for various income ranges: 130.7% for AGIs below $25k, 82.5% for AGIs $25k-50k)
Percentage of individuals using paid preparers for their 2020 taxes: 93.9%
Here:
94%
State:
93%
(% for various income ranges: 93.7% for AGIs below $25k, 93.1% for AGIs $25k-50k, 93.5% for AGIs $50k-75k, 94.7% for AGIs $75k-100k, 95.7% for AGIs $100k-200k, 100.0% for AGIs over 200k)
Averages for the 2012 tax year for zip code 37061, filed in 2013:
Average Adjusted Gross Income (AGI) in 2012: $39,908 (Individual Income Tax Returns)
Here:
$39,908
State:
$53,767
Salary/wage: $36,250 (reported on 82.9% of returns)
Here:
$36,250
State:
$45,421
(% of AGI for various income ranges: 71.8% for AGIs below $25k, 81.7% for AGIs $25k-50k, 81.4% for AGIs $50k-75k, 76.3% for AGIs $75k-100k, 66.6% for AGIs $100k-200k)
Taxable interest for individuals: $1,015 (reported on 27.1% of returns)
This zip code:
$1,015
Tennessee:
$1,732
(% of AGI for various income ranges: 1.2% for AGIs below $25k, 0.8% for AGIs $25k-50k, 0.4% for AGIs $50k-75k, 0.4% for AGIs $75k-100k, 0.7% for AGIs $100k-200k)
Ordinary dividends: $1,814 (reported on 7.0% of returns)
Here:
$1,814
State:
$6,739
(% of AGI for various income ranges: 0.8% for AGIs below $25k, 0.2% for AGIs $25k-50k, 0.2% for AGIs $50k-75k, 0.1% for AGIs $75k-100k, 0.4% for AGIs $100k-200k)
Net capital gain/loss in AGI: +$5,091 (reported on 5.5% of returns)
Here:
+$5,091
State:
+$19,082
(% of AGI for various income ranges: 0.6% for AGIs below $25k, 1.4% for AGIs $50k-75k, 1.3% for AGIs $100k-200k)
Profit/loss from business: +$9,241 (reported on 16.1% of returns)
Here:
+$9,241
State:
+$15,240
(% of AGI for various income ranges: 10.1% for AGIs below $25k, 1.7% for AGIs $25k-50k, 3.2% for AGIs $50k-75k, 1.5% for AGIs $75k-100k, 3.7% for AGIs $100k-200k)
Taxable individual retirement arrangement distribution: $10,777 (reported on 6.5% of returns)
37061:
$10,777
Tennessee:
$15,505
(% of AGI for various income ranges: 1.5% for AGIs below $25k, 1.5% for AGIs $25k-50k, 1.2% for AGIs $50k-75k, 6.3% for AGIs $75k-100k)
Total itemized deductions: $16,700 (22% of AGI, reported on 14.1% of returns)
Here:
$16,700
State:
$21,976
Here:
21.6% of AGI
State:
17.8% of AGI
(% of AGI for various income ranges: 2.3% for AGIs below $25k, 6.1% for AGIs $25k-50k, 6.3% for AGIs $50k-75k, 6.5% for AGIs $75k-100k, 7.0% for AGIs $100k-200k)
Charity contributions: $4,510 (reported on 10.1% of returns)
Here:
$4,510
State:
$6,709
(% of AGI for various income ranges: 0.9% for AGIs $25k-50k, 1.3% for AGIs $50k-75k, 1.5% for AGIs $75k-100k, 1.6% for AGIs $100k-200k)
Taxes paid: $3,311 (reported on 13.6% of returns)
37061:
$3,311
State:
$4,829
(% of AGI for various income ranges: 0.3% for AGIs below $25k, 0.9% for AGIs $25k-50k, 1.1% for AGIs $50k-75k, 1.3% for AGIs $75k-100k, 1.7% for AGIs $100k-200k)
Earned income credit: $2,415 (reported on 26.6% of returns)
Here:
$2,415
State:
$2,404
(% of AGI for various income ranges: 8.8% for AGIs below $25k, 1.4% for AGIs $25k-50k)
Percentage of individuals using paid preparers for their 2012 taxes: 47.2%
Here:
47%
State:
52%
(% for various income ranges: 41.3% for AGIs below $25k, 46.3% for AGIs $25k-50k, 50.0% for AGIs $50k-75k, 64.3% for AGIs $75k-100k, 66.7% for AGIs $100k-200k)
Averages for the 2004 tax year for zip code 37061, filed in 2005:
Average Adjusted Gross Income (AGI) in 2004: $32,177 (Individual Income Tax Returns)
Here:
$32,177
State:
$44,088
Salary/wage: $29,873 (reported on 84.6% of returns)
Here:
$29,873
State:
$38,825
(% of AGI for various income ranges: 129.9% for AGIs below $10k, 75.8% for AGIs $10k-25k, 85.7% for AGIs $25k-50k, 84.9% for AGIs $50k-75k, 73.8% for AGIs $75k-100k, 54.4% for AGIs over 100k)
Taxable interest for individuals: $1,544 (reported on 32.4% of returns)
This zip code:
$1,544
Tennessee:
$1,802
(% of AGI for various income ranges: 4.4% for AGIs below $10k, 2.3% for AGIs $10k-25k, 1.0% for AGIs $25k-50k, 1.9% for AGIs $50k-75k, 1.1% for AGIs $75k-100k, 1.2% for AGIs over 100k)
Taxable dividends: $1,340 (reported on 7.8% of returns)
Here:
$1,340
State:
$3,727
(% of AGI for various income ranges: 0.3% for AGIs below $10k, 0.6% for AGIs $10k-25k, 0.3% for AGIs $25k-50k, 0.2% for AGIs $50k-75k, 0.1% for AGIs $75k-100k, 0.5% for AGIs over 100k)
Net capital gain/loss: +$7,651 (reported on 7.6% of returns)
Here:
+$7,651
State:
+$15,776
(% of AGI for various income ranges: -0.1% for AGIs below $10k, 0.9% for AGIs $10k-25k, 0.6% for AGIs $25k-50k, 1.1% for AGIs $50k-75k, 3.3% for AGIs $75k-100k, 5.4% for AGIs over 100k)
Profit/loss from business: +$8,822 (reported on 20.2% of returns)
Here:
+$8,822
State:
+$12,882
(% of AGI for various income ranges: 23.5% for AGIs below $10k, 7.2% for AGIs $10k-25k, 2.4% for AGIs $25k-50k, 2.0% for AGIs $50k-75k, 9.5% for AGIs $75k-100k, 9.8% for AGIs over 100k)
IRA payment deduction: $2,295 (reported on 2.2% of returns)
37061:
$2,295
Tennessee:
$2,934
Total itemized deductions: $17,183 (27% of AGI, reported on 12.8% of returns)
Here:
$17,183
State:
$18,035
Here:
26.5% of AGI
State:
19.9% of AGI
(% of AGI for various income ranges: 5.7% for AGIs $10k-25k, 5.6% for AGIs $25k-50k, 5.9% for AGIs $50k-75k, 7.5% for AGIs $75k-100k, 12.3% for AGIs over 100k)
Charity contributions deductions: $3,793 (5% of AGI, reported on 10.3% of returns)
Here:
$3,793
State:
$5,167
Here:
5.4% of AGI
State:
5.3% of AGI
(% of AGI for various income ranges: 0.6% for AGIs $10k-25k, 0.8% for AGIs $25k-50k, 1.1% for AGIs $50k-75k, 1.9% for AGIs $75k-100k, 2.6% for AGIs over 100k)
Total tax: $3,792 (reported on 69.8% of returns)
37061:
$3,792
State:
$7,482
(% of AGI for various income ranges: 5.0% for AGIs below $10k, 3.6% for AGIs $10k-25k, 5.8% for AGIs $25k-50k, 8.7% for AGIs $50k-75k, 11.6% for AGIs $75k-100k, 15.3% for AGIs over 100k)
Earned income credit: $1,820 (reported on 25.6% of returns)
Here:
$1,820
State:
$1,826
Percentage of individuals using paid preparers for their 2004 taxes: 57.6%
Here:
58%
State:
60%
(% for various income ranges: 55.9% for AGIs below $10k, 59.6% for AGIs $10k-25k, 54.5% for AGIs $25k-50k, 59.7% for AGIs $50k-75k, 51.1% for AGIs $75k-100k, 75.8% for AGIs over 100k)
Household received Food Stamps/SNAP in the past 12 months: 374 Household did not receive Food Stamps/SNAP in the past 12 months: 1,427
Women who had a birth in the past 12 months: 52 (14 now married, 37 unmarried) Women who did not have a birth in the past 12 months: 1,120 (419 now married, 701 unmarried)
Housing units in zip code 37061 with a mortgage: 575 (145 second mortgage, 9 home equity loan, 133 both second mortgage and home equity loan) Median monthly owner costs for units with a mortgage: $1,186 Median monthly owner costs for units without a mortgage: $428
Residents with income below the poverty level in 2022:
This zip code:
10.6%
Whole state:
13.3%
Residents with income below 50% of the poverty level in 2022:
This zip code:
7.5%
Whole state:
7.1%
Median number of rooms in houses and condos:
Here:
6.1
State:
6.5
Median number of rooms in apartments:
Here:
4.8
State:
4.4
Notable locations in this zip code not listed on our city pages
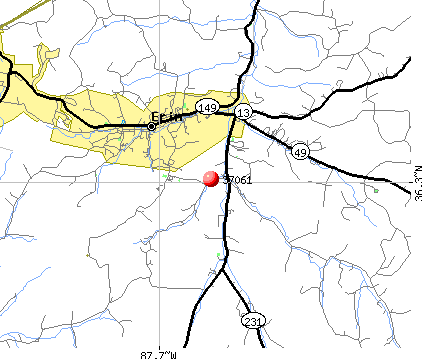
Notable locations in zip code 37061: Tennessee Department of Agriculture Division of Forestry Erin Fire Tower (A), Houston County Fire Department Erin Station (B), Erin Fire Department (C), Houston County Courthouse (D), Erin City Hall (E), Houston County Ambulance Service (F). Display/hide their locations on the map
Churches in zip code 37061 include: Mount Sinai Church (A), Lockart Chapel (B), Steels Chapel (C), Lewis Branch Church (D), Salmon Branch Church (E), Spring Hill Church (F), Griffin Chapel (G), Pleasant Ridge Church (H), Peach Grove Church (I). Display/hide their locations on the map
Cemeteries: Vanhook Cemetery (1), Jones Cemetery (2), Adkins Cemetery (3), Batson Cemetery (4), Bethany Cemetery (5), Cedar Hill Cemetery (6), Cooksey Cemetery (7). Display/hide their locations on the map
Streams, rivers, and creeks: Erin Branch (A), Clark Branch (B), Hagerville Branch (C), Cave Orchard Branch (D), Pollard Branch (E), Bateman Branch (F), Averitt Branch (G), Adkins Branch (H), Musterground Creek (I). Display/hide their locations on the map
In group quarters: 186 (-1 institutionalized population)
Size of family households: 607 2-persons, 270 3-persons, 96 4-persons, 69 5-persons, 49 6-persons, 31 7-or-more-persons
Size of nonfamily households: 567 1-person, 119 2-persons
719 married couples with children.
117 single-parent households (42 men, 75 women).
98.7% of residents of 37061 zip code speak English at home.
0.4% of residents speak Spanish at home (91% very well, 9% not at all).
0.5% of residents speak other Indo-European language at home (62% very well, 38% well).
Foreign born population: 62 (1.2%) (86.5% of them are naturalized citizens)
This zip code:
1.2%
Whole state:
5.6%
19%France
8%Belgium
6%Honduras
3%El Salvador
49%American
10%Irish
4%English
4%German
2%Scotch-Irish
1%African
1%European
Year of entry for the foreign-born population
282010 or later
342000 to 2009
331990 to 1999
28Before 1990
Facilities with environmental interests located in this zip code:
BURCLIFF INDUSTRIES (HWY 149 2 MILES PAST CUMBERLAN in ERIN, TN)
(Resource Conservation and Recovery Act (tracking hazardous waste)) Business NAICS classification: ALL OTHER MISCELLANEOUS MANUFACTURING.
COMMUNITY NEWSPAPER INC (1440. N S01T50 Y Y Y in ERIN, TN)
(Resource Conservation and Recovery Act (tracking hazardous waste))
Housing units lacking complete plumbing facilities: 3.5% Housing units lacking complete kitchen facilities: 4.7%
62.7%Electricity
17.3%Utility gas
14.3%Bottled, tank, or LP gas
4.9%Wood
0.8%Fuel oil, kerosene, etc.
Population in 1990: 4,804.
Place of birth for U.S.-born residents:
This state: 3,195
Northeast: 264
Midwest: 665
South: 753
West: 285
63% of the 37061 zip code residents lived in the same house 5 years ago. Out of people who lived in different houses, 58% lived in this county. Out of people who lived in different counties, 50% lived in Tennessee.
90% of the 37061 zip code residents lived in the same house 1 year ago. Out of people who lived in different houses, 29% moved from this county. Out of people who lived in different houses, 55% moved from different county within same state. Out of people who lived in different houses, 19% moved from different state.
Private vs. public school enrollment:
Students in private schools in grades 1 to 8 (elementary and middle school): 66
Here:
11.1%
Tennessee:
15.0%
Students in private schools in grades 9 to 12 (high school): 47
Here:
12.7%
Tennessee:
16.2%
Students in private undergraduate colleges: 10
Here:
5.2%
Tennessee:
23.5%
Occupation by median earnings in the past 12 months ($)
135,397Architecture and engineering occupations
86,781Law enforcement workers including supervisors
78,483Life, physical, and social science occupations
68,808Management occupations
65,526Health diagnosing and treating practitioners and other technical occupations
55,110Health technologists and technicians
Companies with federal contracts located in this zip code:
PRIDE CONCRETE,LLC (610 OLD 149 HWY in ERIN, TN; small business) : $49,922 in 4 contractsfrom 2001 to 2003
$21,250 with Army for Maintenance, Repair or Alteration of Real Property -- Miscellaneous Buildings. Taking place in KY. Signed on 2002-09-30. Completion date: 2002-10-31.
$20,206 with Army for Maintenance, Repair or Alteration of Real Property -- Other Administrative Facilities and Service Buildings. Taking place in KY. Signed on 2003-05-16. Completion date: 2003-06-16.
$4,470 with Army for Maintenance, Repair or Alteration of Real Property -- Other Warehouse Buildings. Taking place in KY. Signed on 2001-06-22. Completion date: 2001-07-23.
$3,996 with Army for Maintenance, Repair or Alteration of Real Property -- Miscellaneous Buildings. Taking place in KY. Signed on 2003-09-28. Completion date: 2003-10-30.
GLASTONBURY SOUTHERN GAGE (46 INDUSTRIAL PARK RD in ERIN, TN; small business) : $3,604 in 3 contractsfrom 2005 to 2006
$3,172 with Air Force for Inspection Gages and Precision Layout Tools. Signed on 2006-04-11. Completion date: 2006-04-25.
$413 with Navy for Bushings, Rings, Shims, and Spacers. Signed on 2005-09-20. Completion date: 2005-11-17.
$19, same as above.Signed on 2005-09-28. Completion date: 2005-11-17.
Top industries in this zip code by the number of employees in 2005:
Health Care and Social Assistance: Nursing Care Facilities (100-249 employees: 1 establishment, 5-9 employees: 1 establishment)
Health Care and Social Assistance: General Medical and Surgical Hospitals (100-249: 1)
Health Care and Social Assistance: Offices of Physicians (except Mental Health Specialists) (20-49: 1, 5-9: 1, 1-4: 2)
Health Care and Social Assistance: Child Day Care Services (20-49: 1, 5-9: 1)
Health Care and Social Assistance: Home Health Care Services (20-49: 1, 1-4: 1)
People in group quarters in 2010:
142 people in nursing facilities/skilled-nursing facilities
20 people in local jails and other municipal confinement facilities
People in group quarters in 2000:
160 people in nursing homes
17 people in local jails and other confinement facilities (including police lockups)
Fatal accident statistics in 2014:
Fatal accident count: 1
Vehicles involved in fatal accidents: 2
Fatal accidents caused by drunken drivers: 1
Fatalities: 1
Persons involved in fatal accidents: 2
Pedestrians involved in fatal accidents: 0
Fatal accident statistics in 2013:
Fatal accident count: 3
Vehicles involved in fatal accidents: 6
Fatal accidents caused by drunken drivers: 0
Fatalities: 3
Persons involved in fatal accidents: 6
Pedestrians involved in fatal accidents: 0
2002 - 2018 National Fire Incident Reporting System (NFIRS) incidents
According to the data from the years 2002 - 2018 the average number of fire incidents per year is 27. The highest number of fires - 47 took place in 2008, and the least - 0 in 2003. The data has an increasing trend.
When looking into fire subcategories, the most incidents belonged to: Structure Fires (44.8%), and Outside Fires (35.2%).
Fire incident types reported to NFIRS in Zip Code 37061


 Nearest zip codes: 37050, 37178, 37165, 37181, 37142, 37079.


 According to the data from the years 2002 - 2018 the average number of fire incidents per year is 27. The highest number of fires - 47 took place in 2008, and the least - 0 in 2003. The data has an increasing trend.
 When looking into fire subcategories, the most incidents belonged to: Structure Fires (44.8%), and Outside Fires (35.2%).