Estimated zip code population in 2022: 6,166 Zip code population in 2010: 5,503 Zip code population in 2000: 5,474
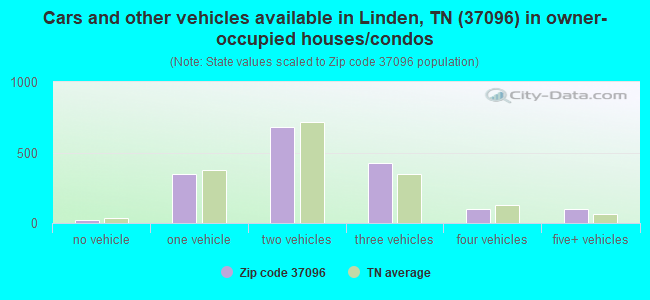
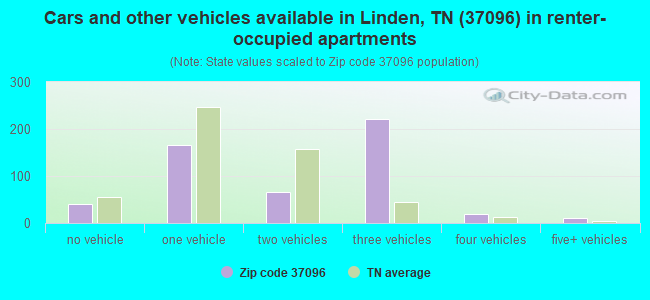
Houses and condos: 3,520 Renter-occupied apartments: 512
% of renters here:
23%
State:
33%
March 2022 cost of living index in zip code 37096: 77.9 (low, U.S. average is 100)
Land area: 296.5 sq. mi. Water area: 5.4 sq. mi.
Population density: 21 people per square mile
(very low).
OSM Map
General Map
Google Map
MSN Map
OSM Map
General Map
Google Map
MSN Map
OSM Map
General Map
Google Map
MSN Map
OSM Map
General Map
Google Map
MSN Map
Please wait while loading the map...
Real estate property taxes paid for housing units in 2022:
This zip code:
0.5% ($716)
Tennessee:
0.5% ($1,376)
Median real estate property taxes paid for housing units with mortgages in 2022: $581 (0.4%) Median real estate property taxes paid for housing units with no mortgage in 2022: $764 (0.5%)
Business Search- 14 Million verified businesses
Males: 3,030
(49.2%)
Females: 3,135
(50.8%)
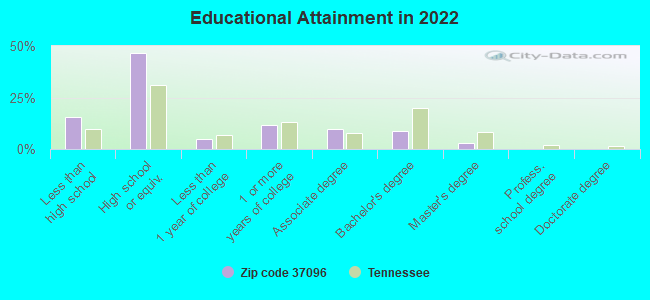
For population 25 years and over in 37096:
High school or higher: 82.5%
Bachelor's degree or higher: 11.3%
Graduate or professional degree: 2.9%
Unemployed: 8.4%
Mean travel time to work (commute): 22.7 minutes
For population 15 years and over in 37096:
Never married: 27.4%
Now married: 55.5%
Separated: 2.3%
Widowed: 7.1%
Divorced: 7.7%
Zip code 37096 compared to state average:
Median house value below state average.
Unemployed percentage above state average.
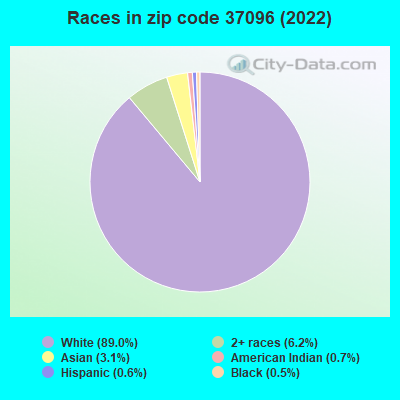
Black race population percentage significantly below state average.
Hispanic race population percentage significantly below state average.
Foreign-born population percentage significantly below state average.
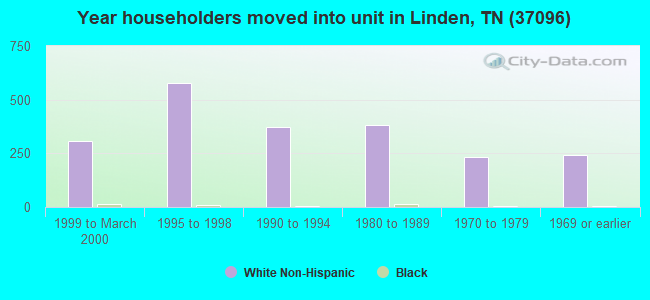
Length of stay since moving in significantly above state average.
Percentage of population with a bachelor's degree or higher significantly below state average.
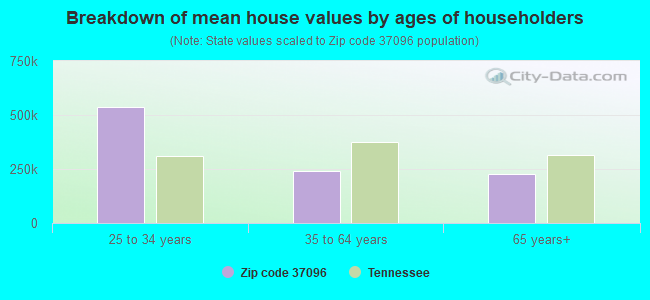
Estimated median house/condo value in 2022: $149,456
37096:
$149,456
Tennessee:
$284,800
According to our research of Tennessee and other state lists, there were 17 registered sex offenders living in 37096 zip code as of May 28, 2024. The ratio of all residents to sex offenders in zip code 37096 is 330 to 1. The ratio of registered sex offenders to all residents in this zip code is near the state average.
Median resident age:
This zip code:
42.8 years
Tennessee median age:
39.2 years
Average household size:
This zip code:
2.8 people
Tennessee:
2.4 people
Averages for the 2020 tax year for zip code 37096, filed in 2021:
Average Adjusted Gross Income (AGI) in 2020: $47,374 (Individual Income Tax Returns)
Here:
$47,374
State:
$69,014
Salary/wage: $42,324 (reported on 78.9% of returns)
Here:
$42,324
State:
$55,872
(% of AGI for various income ranges: 1099.6% for AGIs below $25k, 3334.3% for AGIs $25k-50k, 6000.8% for AGIs $50k-75k, 8228.6% for AGIs $75k-100k, 11438.7% for AGIs $100k-200k)
Taxable interest for individuals: $1,014 (reported on 29.8% of returns)
This zip code:
$1,014
Tennessee:
$1,945
(% of AGI for various income ranges: 15.6% for AGIs below $25k, 24.6% for AGIs $25k-50k, 57.6% for AGIs $50k-75k, 77.1% for AGIs $75k-100k, 67.3% for AGIs $100k-200k)
Ordinary dividends: $2,788 (reported on 6.6% of returns)
Here:
$2,788
State:
$8,105
(% of AGI for various income ranges: 7.0% for AGIs below $25k, 9.1% for AGIs $25k-50k, 51.6% for AGIs $50k-75k, 141.3% for AGIs $100k-200k)
Net capital gain/loss in AGI: +$13,240 (reported on 8.3% of returns)
Here:
+$13,240
State:
+$33,664
(% of AGI for various income ranges: 14.0% for AGIs below $25k, 46.8% for AGIs $25k-50k, 184.8% for AGIs $50k-75k, 212.1% for AGIs $75k-100k, 1012.7% for AGIs $100k-200k)
Profit/loss from business: +$11,552 (reported on 18.2% of returns)
Here:
+$11,552
State:
+$18,991
(% of AGI for various income ranges: 186.0% for AGIs below $25k, 184.5% for AGIs $25k-50k, 199.2% for AGIs $50k-75k, 388.6% for AGIs $75k-100k, 1050.7% for AGIs $100k-200k)
Taxable individual retirement arrangement distribution: $12,929 (reported on 7.0% of returns)
37096:
$12,929
Tennessee:
$20,036
(% of AGI for various income ranges: 48.1% for AGIs below $25k, 85.0% for AGIs $25k-50k, 218.8% for AGIs $50k-75k, 536.7% for AGIs $100k-200k)
Total itemized deductions: $38,200 (reported on 2.1% of returns)
Here:
$38,200
State:
$40,136
(% of AGI for various income ranges: 375.2% for AGIs $50k-75k, 648.0% for AGIs $100k-200k)
Charity contributions: $10,525 (reported on 1.7% of returns)
Here:
$10,525
State:
$19,852
(% of AGI for various income ranges: 300.7% for AGIs $75k-100k)
Taxes paid: $4,680 (reported on 2.1% of returns)
37096:
$4,680
State:
$6,038
(% of AGI for various income ranges: 14.8% for AGIs $25k-50k, 100.7% for AGIs $100k-200k)
Earned income credit: $2,500 (reported on 24.4% of returns)
Here:
$2,500
State:
$2,391
(% of AGI for various income ranges: 128.1% for AGIs below $25k, 87.3% for AGIs $25k-50k)
Percentage of individuals using paid preparers for their 2020 taxes: 95.0%
Here:
95%
State:
93%
(% for various income ranges: 94.9% for AGIs below $25k, 97.1% for AGIs $25k-50k, 93.9% for AGIs $50k-75k, 94.7% for AGIs $75k-100k, 94.7% for AGIs $100k-200k, 75.0% for AGIs over 200k)
Averages for the 2012 tax year for zip code 37096, filed in 2013:
Average Adjusted Gross Income (AGI) in 2012: $37,410 (Individual Income Tax Returns)
Here:
$37,410
State:
$53,767
Salary/wage: $32,522 (reported on 80.9% of returns)
Here:
$32,522
State:
$45,421
(% of AGI for various income ranges: 72.3% for AGIs below $25k, 78.0% for AGIs $25k-50k, 78.5% for AGIs $50k-75k, 72.1% for AGIs $75k-100k, 53.8% for AGIs $100k-200k)
Taxable interest for individuals: $1,168 (reported on 31.6% of returns)
This zip code:
$1,168
Tennessee:
$1,732
(% of AGI for various income ranges: 1.5% for AGIs below $25k, 0.8% for AGIs $25k-50k, 0.8% for AGIs $50k-75k, 1.3% for AGIs $75k-100k, 0.7% for AGIs $100k-200k)
Ordinary dividends: $1,924 (reported on 7.9% of returns)
Here:
$1,924
State:
$6,739
(% of AGI for various income ranges: 0.3% for AGIs below $25k, 0.2% for AGIs $25k-50k, 0.6% for AGIs $50k-75k, 0.3% for AGIs $75k-100k, 0.6% for AGIs $100k-200k)
Net capital gain/loss in AGI: +$6,053 (reported on 7.9% of returns)
Here:
+$6,053
State:
+$19,082
(% of AGI for various income ranges: 0.9% for AGIs below $25k, 0.4% for AGIs $25k-50k, 0.3% for AGIs $50k-75k, 3.3% for AGIs $75k-100k, 2.0% for AGIs $100k-200k)
Profit/loss from business: +$6,554 (reported on 19.1% of returns)
Here:
+$6,554
State:
+$15,240
(% of AGI for various income ranges: 9.5% for AGIs below $25k, 4.0% for AGIs $25k-50k, 1.3% for AGIs $50k-75k, 1.4% for AGIs $75k-100k, 1.3% for AGIs $100k-200k)
Taxable individual retirement arrangement distribution: $14,267 (reported on 7.0% of returns)
37096:
$14,267
Tennessee:
$15,505
(% of AGI for various income ranges: 2.0% for AGIs below $25k, 2.4% for AGIs $25k-50k, 2.4% for AGIs $50k-75k, 8.8% for AGIs $75k-100k)
Total itemized deductions: $21,092 (28% of AGI, reported on 11.6% of returns)
Here:
$21,092
State:
$21,976
Here:
27.9% of AGI
State:
17.8% of AGI
(% of AGI for various income ranges: 2.6% for AGIs below $25k, 5.0% for AGIs $25k-50k, 6.6% for AGIs $50k-75k, 9.4% for AGIs $75k-100k, 9.1% for AGIs $100k-200k)
Charity contributions: $4,540 (reported on 7.0% of returns)
Here:
$4,540
State:
$6,709
(% of AGI for various income ranges: 0.8% for AGIs $25k-50k, 0.8% for AGIs $50k-75k, 1.9% for AGIs $75k-100k, 0.9% for AGIs $100k-200k)
Taxes paid: $3,192 (reported on 11.2% of returns)
37096:
$3,192
State:
$4,829
(% of AGI for various income ranges: 0.3% for AGIs below $25k, 0.6% for AGIs $25k-50k, 0.9% for AGIs $50k-75k, 1.6% for AGIs $75k-100k, 1.4% for AGIs $100k-200k)
Earned income credit: $2,465 (reported on 28.8% of returns)
Here:
$2,465
State:
$2,404
(% of AGI for various income ranges: 8.7% for AGIs below $25k, 1.8% for AGIs $25k-50k)
Percentage of individuals using paid preparers for their 2012 taxes: 64.7%
Here:
65%
State:
52%
(% for various income ranges: 61.8% for AGIs below $25k, 65.4% for AGIs $25k-50k, 67.9% for AGIs $50k-75k, 71.4% for AGIs $75k-100k, 72.7% for AGIs $100k-200k)
Averages for the 2004 tax year for zip code 37096, filed in 2005:
Average Adjusted Gross Income (AGI) in 2004: $31,053 (Individual Income Tax Returns)
Here:
$31,053
State:
$44,088
Salary/wage: $28,122 (reported on 83.3% of returns)
Here:
$28,122
State:
$38,825
(% of AGI for various income ranges: 93.5% for AGIs below $10k, 78.1% for AGIs $10k-25k, 82.8% for AGIs $25k-50k, 83.0% for AGIs $50k-75k, 80.6% for AGIs $75k-100k, 35.0% for AGIs over 100k)
Taxable interest for individuals: $1,651 (reported on 35.8% of returns)
This zip code:
$1,651
Tennessee:
$1,802
(% of AGI for various income ranges: 4.4% for AGIs below $10k, 2.0% for AGIs $10k-25k, 1.3% for AGIs $25k-50k, 1.4% for AGIs $50k-75k, 1.7% for AGIs $75k-100k, 3.5% for AGIs over 100k)
Taxable dividends: $2,341 (reported on 8.5% of returns)
Here:
$2,341
State:
$3,727
(% of AGI for various income ranges: 0.9% for AGIs below $10k, 0.5% for AGIs $10k-25k, 0.3% for AGIs $25k-50k, 0.6% for AGIs $50k-75k, 0.6% for AGIs $75k-100k, 1.7% for AGIs over 100k)
Net capital gain/loss: +$9,061 (reported on 8.2% of returns)
Here:
+$9,061
State:
+$15,776
(% of AGI for various income ranges: -0.7% for AGIs below $10k, 0.6% for AGIs $10k-25k, 0.6% for AGIs $25k-50k, 1.4% for AGIs $50k-75k, 3.3% for AGIs $75k-100k, 10.4% for AGIs over 100k)
Profit/loss from business: +$6,805 (reported on 20.5% of returns)
Here:
+$6,805
State:
+$12,882
(% of AGI for various income ranges: 3.5% for AGIs below $10k, 5.8% for AGIs $10k-25k, 4.3% for AGIs $25k-50k, 2.6% for AGIs $50k-75k, 5.5% for AGIs $75k-100k, 6.0% for AGIs over 100k)
IRA payment deduction: $2,886 (reported on 1.6% of returns)
37096:
$2,886
Tennessee:
$2,934
Total itemized deductions: $16,847 (29% of AGI, reported on 9.3% of returns)
Here:
$16,847
State:
$18,035
Here:
29.4% of AGI
State:
19.9% of AGI
(% of AGI for various income ranges: 8.3% for AGIs below $10k, 3.2% for AGIs $10k-25k, 4.4% for AGIs $25k-50k, 5.4% for AGIs $50k-75k, 8.1% for AGIs $75k-100k, 5.3% for AGIs over 100k)
Charity contributions deductions: $3,932 (6% of AGI, reported on 6.7% of returns)
Here:
$3,932
State:
$5,167
Here:
6.2% of AGI
State:
5.3% of AGI
(% of AGI for various income ranges: 0.4% for AGIs $10k-25k, 0.7% for AGIs $25k-50k, 1.0% for AGIs $50k-75k, 1.8% for AGIs $75k-100k, 1.1% for AGIs over 100k)
Total tax: $3,831 (reported on 70.2% of returns)
37096:
$3,831
State:
$7,482
(% of AGI for various income ranges: 4.5% for AGIs below $10k, 4.0% for AGIs $10k-25k, 6.0% for AGIs $25k-50k, 8.7% for AGIs $50k-75k, 11.0% for AGIs $75k-100k, 19.9% for AGIs over 100k)
Earned income credit: $1,691 (reported on 22.4% of returns)
Here:
$1,691
State:
$1,826
Percentage of individuals using paid preparers for their 2004 taxes: 71.3%
Here:
71%
State:
60%
(% for various income ranges: 65.0% for AGIs below $10k, 71.6% for AGIs $10k-25k, 74.8% for AGIs $25k-50k, 73.3% for AGIs $50k-75k, 68.8% for AGIs $75k-100k, 81.6% for AGIs over 100k)
Household received Food Stamps/SNAP in the past 12 months: 336 Household did not receive Food Stamps/SNAP in the past 12 months: 1,844
Women who had a birth in the past 12 months: 68 (65 now married, 3 unmarried) Women who did not have a birth in the past 12 months: 1,284 (718 now married, 565 unmarried)
Housing units in zip code 37096 with a mortgage: 440 (31 second mortgage, 31 both second mortgage and home equity loan) Median monthly owner costs for units with a mortgage: $1,091 Median monthly owner costs for units without a mortgage: $358
Residents with income below the poverty level in 2022:
This zip code:
13.7%
Whole state:
13.3%
Residents with income below 50% of the poverty level in 2022:
This zip code:
7.0%
Whole state:
7.1%
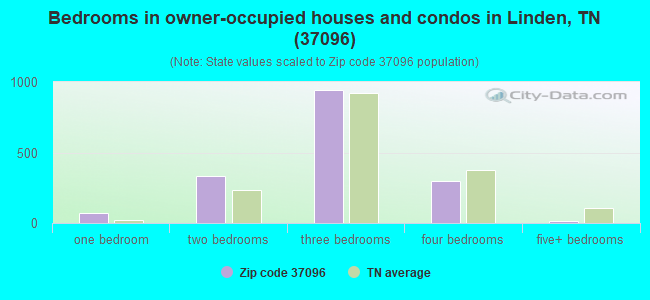
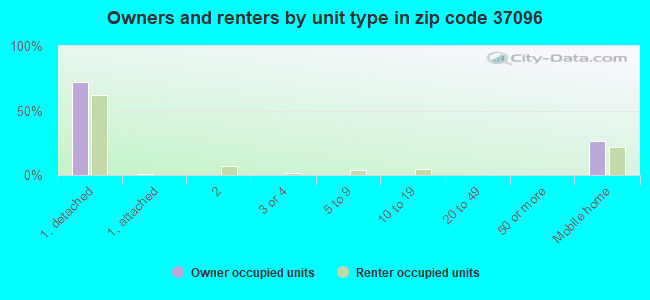
Median number of rooms in houses and condos:
Here:
5.8
State:
6.5
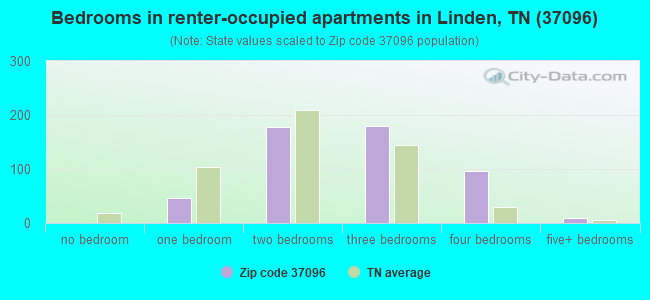
Median number of rooms in apartments:
Here:
5.5
State:
4.4
Notable locations in this zip code not listed on our city pages
Notable locations in zip code 37096: Camp Linden (A), Cedar Creek Dock (B), New Era Dock (C), Rameys Dock (D), Cypress Creek Boat Dock (E), Toms Creek Dock (F), Standing Rock (G), Camp Linden (H), Matheny Camp (I), Webbs Landing (J), Blunts Landing (K), Cedar Creek Landing (L), Densons Landing (M), East Perryville Landing (N), Jennings Bluff Landing (O), Kellys Landing (P), Lick Creek Landing (Q), Marvins Bluff Landing (R), Mousetail Landing (S), New Era Landing (T). Display/hide their locations on the map
Churches in zip code 37096 include: Bethel United Methodist Church (A), Fairview Church (B), Farmers Valley Church (C), Short Creek Church (D), Simmons Church (E), Sinking Creek Church (F), Chappell Methodist Church (G), Lick Creek Church (H), Rockhouse Church (I). Display/hide their locations on the map
Cemeteries: Strickland Cemetery (1), Howard Cemetery (2), Howell Cemetery (3), Sutton Cemetery (4), Hufstedler Cemetery (5), Tanner Cemetery (6), Hunt Cemetery (7). Display/hide their locations on the map
Streams, rivers, and creeks: Little Opossum Creek (A), Lineberry Fork (B), Lick Creek (C), Lee Branch (D), Jack Branch (E), Hurricane Creek (F), Howell Fork (G), Howell Branch (H), Holder Branch (I). Display/hide their locations on the map
In group quarters: 153 (-1 institutionalized population)
Size of family households: 794 2-persons, 398 3-persons, 153 4-persons, 241 5-persons, 15 6-persons, 6 7-or-more-persons
Size of nonfamily households: 492 1-person, 68 2-persons, 17 3-persons
1,003 married couples with children.
209 single-parent households (53 men, 156 women).
97.3% of residents of 37096 zip code speak English at home.
0.5% of residents speak Spanish at home (100% very well).
1.3% of residents speak other Indo-European language at home (27% very well, 73% well).
0.4% of residents speak Asian or Pacific Island language at home (100% very well).
0.1% of residents speak other language at home (100% very well).
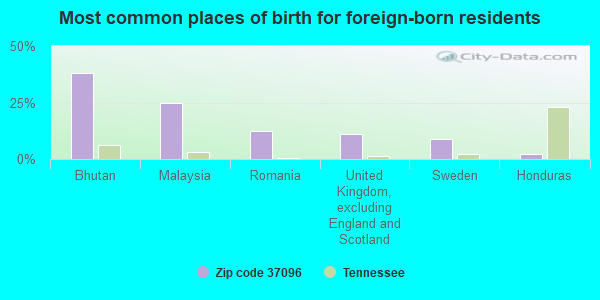
Foreign born population: 89 (1.4%) (87.0% of them are naturalized citizens)
This zip code:
1.4%
Whole state:
5.6%
38%Bhutan
25%Malaysia
12%Romania
11%United Kingdom, excluding England and Scotland
9%Sweden
2%Honduras
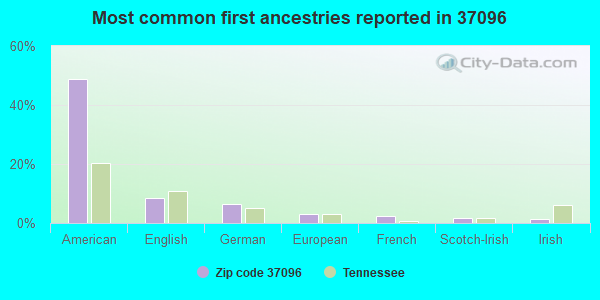
49%American
8%English
6%German
3%European
2%French
2%Scotch-Irish
1%Irish
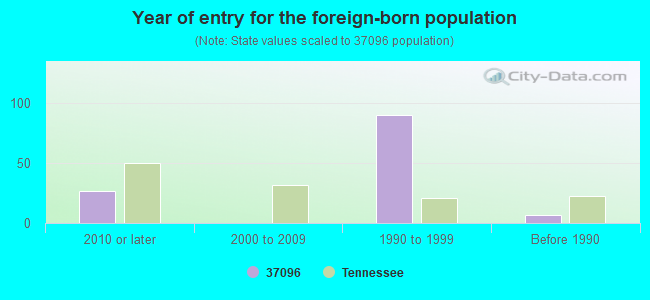
Year of entry for the foreign-born population
272010 or later
02000 to 2009
901990 to 1999
7Before 1990
Facilities with environmental interests located in this zip code:
3D ROCK COMPANY (MINE #001 in LINDEN, TN)
National Pollutant Discharge Elimination System NON-MAJOR (Tracking pollutant discharge elimination systems) - permit Business SIC classification: CONSTRUCTION SAND AND GRAVEL Alternative names: LONA LOMAX
Housing units lacking complete plumbing facilities: 6.2% Housing units lacking complete kitchen facilities: 8.1%
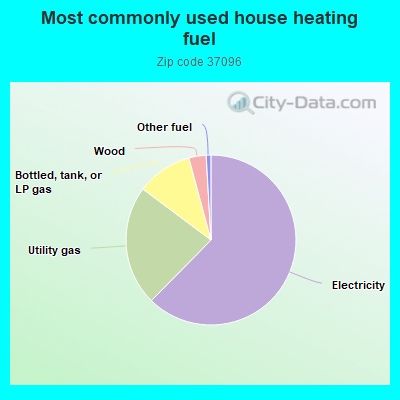
62.5%Electricity
22.9%Utility gas
10.6%Bottled, tank, or LP gas
3.3%Wood
0.9%Other fuel
Population in 1990: 4,172. Population change in the 1990s: +1,302 (+31.2%).
Place of birth for U.S.-born residents:
This state: 3,754
Northeast: 267
Midwest: 768
South: 1,088
West: 130
67% of the 37096 zip code residents lived in the same house 5 years ago. Out of people who lived in different houses, 41% lived in this county. Out of people who lived in different counties, 50% lived in Tennessee.
98% of the 37096 zip code residents lived in the same house 1 year ago. Out of people who lived in different houses, 15% moved from this county. Out of people who lived in different houses, 20% moved from different county within same state. Out of people who lived in different houses, 105% moved from different state.
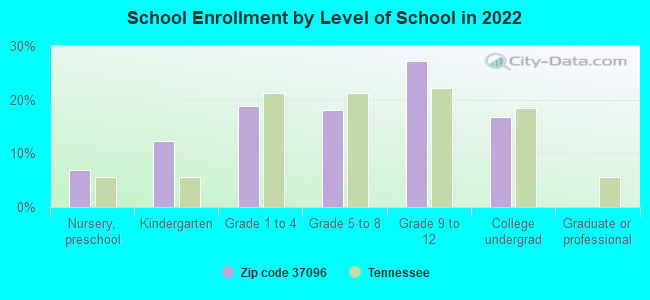
Private vs. public school enrollment:
Students in private schools in grades 1 to 8 (elementary and middle school): 150
Here:
26.4%
Tennessee:
15.0%
Students in private schools in grades 9 to 12 (high school):
Here:
0.0%
Tennessee:
16.2%
Students in private undergraduate colleges: 16
Here:
6.3%
Tennessee:
23.5%
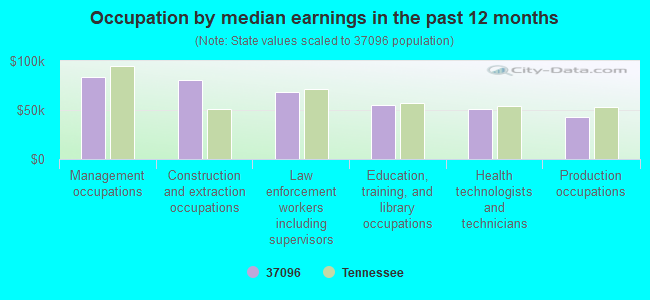
Occupation by median earnings in the past 12 months ($)
84,038Management occupations
80,161Construction and extraction occupations
68,624Law enforcement workers including supervisors
55,413Education, training, and library occupations
50,949Health technologists and technicians
42,716Production occupations
Top industries in this zip code by the number of employees in 2005:
Health Care and Social Assistance: General Medical and Surgical Hospitals (100-249 employees: 1 establishment)
Health Care and Social Assistance: Nursing Care Facilities (100-249: 1)
Health Care and Social Assistance: Residential Mental Health and Substance Abuse Facilities (50-99: 1)
Professional, Scientific, and Technical Services: All Other Professional, Scientific, and Technical Services (20-49: 1)
Mining: Construction Sand and Gravel Mining (20-49: 1)
Finance and Insurance: Commercial Banking (10-19: 2)
People in group quarters in 2010:
84 people in nursing facilities/skilled-nursing facilities
39 people in local jails and other municipal confinement facilities
People in group quarters in 2000:
106 people in nursing homes
25 people in other group homes
10 people in local jails and other confinement facilities (including police lockups)
Fatal accident statistics in 2014:
Fatal accident count: 3
Vehicles involved in fatal accidents: 3
Fatal accidents caused by drunken drivers: 0
Fatalities: 3
Persons involved in fatal accidents: 3
Pedestrians involved in fatal accidents: 0
Fatal accident statistics in 2013:
Fatal accident count: 3
Vehicles involved in fatal accidents: 3
Fatal accidents caused by drunken drivers: 1
Fatalities: 3
Persons involved in fatal accidents: 3
Pedestrians involved in fatal accidents: 0
2002 - 2018 National Fire Incident Reporting System (NFIRS) incidents
According to the data from the years 2002 - 2018 the average number of fires per year is 28. The highest number of fire incidents - 65 took place in 2010, and the least - 7 in 2003. The data has an increasing trend.
When looking into fire subcategories, the most reports belonged to: Outside Fires (47.0%), and Structure Fires (35.0%).
Fire incident types reported to NFIRS in Zip Code 37096

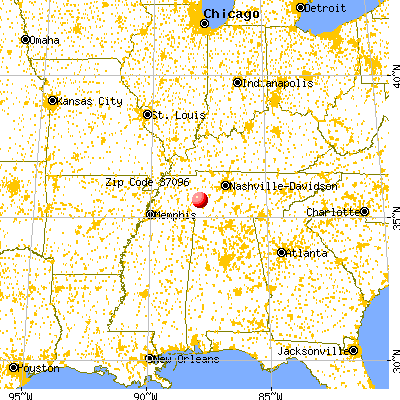


 Nearest zip codes: 37097, 38425, 38380, 38329, 38363, 38485.


 According to the data from the years 2002 - 2018 the average number of fires per year is 28. The highest number of fire incidents - 65 took place in 2010, and the least - 7 in 2003. The data has an increasing trend.
 When looking into fire subcategories, the most reports belonged to: Outside Fires (47.0%), and Structure Fires (35.0%).