Estimated zip code population in 2022: 1,544 Zip code population in 2010: 1,224 Zip code population in 2000: 906
Houses and condos: 613 Renter-occupied apartments: 85
% of renters here:
15%
State:
33%
March 2022 cost of living index in zip code 37141: 80.6 (low, U.S. average is 100)
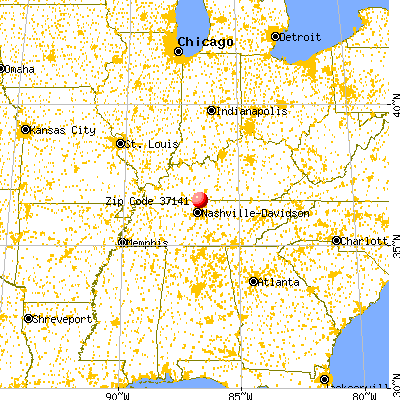
Land area: 21.3 sq. mi. Water area: 0.0 sq. mi.
Population density: 73 people per square mile
(very low).
OSM Map
General Map
Google Map
MSN Map
OSM Map
General Map
Google Map
MSN Map
OSM Map
General Map
Google Map
MSN Map
OSM Map
General Map
Google Map
MSN Map
Please wait while loading the map...
Real estate property taxes paid for housing units in 2022:
This zip code:
0.6% ($1,634)
Tennessee:
0.5% ($1,376)
Median real estate property taxes paid for housing units with mortgages in 2022: $1,340 (0.5%) Median real estate property taxes paid for housing units with no mortgage in 2022: $1,981 (0.7%)
Estimated median house/condo value in 2022: $281,242
37141:
$281,242
Tennessee:
$284,800
Median resident age:
This zip code:
45.0 years
Tennessee median age:
39.2 years
Average household size:
This zip code:
2.7 people
Tennessee:
2.4 people
Averages for the 2020 tax year for zip code 37141, filed in 2021:
Average Adjusted Gross Income (AGI) in 2020: $52,935 (Individual Income Tax Returns)
Here:
$52,935
State:
$69,014
Salary/wage: $47,088 (reported on 83.9% of returns)
Here:
$47,088
State:
$55,872
(% of AGI for various income ranges: 1385.3% for AGIs below $25k, 3025.4% for AGIs $25k-50k, 5794.3% for AGIs $50k-75k, 8138.0% for AGIs $75k-100k, 16788.3% for AGIs $100k-200k)
Taxable interest for individuals: $988 (reported on 25.8% of returns)
This zip code:
$988
Tennessee:
$1,945
(% of AGI for various income ranges: 25.9% for AGIs below $25k, 29.2% for AGIs $25k-50k, 45.7% for AGIs $50k-75k, 73.3% for AGIs $100k-200k)
Ordinary dividends: $2,680 (reported on 8.1% of returns)
Here:
$2,680
State:
$8,105
(% of AGI for various income ranges: 42.3% for AGIs $25k-50k, 131.7% for AGIs $100k-200k)
Net capital gain/loss in AGI: +$8,000 (reported on 8.1% of returns)
Here:
+$8,000
State:
+$33,664
(% of AGI for various income ranges: 57.7% for AGIs $25k-50k, 541.7% for AGIs $100k-200k)
Profit/loss from business: +$6,530 (reported on 16.1% of returns)
Here:
+$6,530
State:
+$18,991
(% of AGI for various income ranges: 84.7% for AGIs below $25k, 296.9% for AGIs $25k-50k, 246.0% for AGIs $75k-100k)
Taxable individual retirement arrangement distribution: $11,633 (reported on 4.8% of returns)
37141:
$11,633
Tennessee:
$20,036
(% of AGI for various income ranges: 268.5% for AGIs $25k-50k)
Earned income credit: $2,480 (reported on 16.1% of returns)
Here:
$2,480
State:
$2,391
(% of AGI for various income ranges: 89.4% for AGIs below $25k, 73.8% for AGIs $25k-50k)
Percentage of individuals using paid preparers for their 2020 taxes: 90.3%
Here:
90%
State:
93%
(% for various income ranges: 87.0% for AGIs below $25k, 93.3% for AGIs $25k-50k, 100.0% for AGIs $50k-75k, 83.3% for AGIs $75k-100k, 90.0% for AGIs $100k-200k)
Averages for the 2012 tax year for zip code 37141, filed in 2013:
Average Adjusted Gross Income (AGI) in 2012: $44,942 (Individual Income Tax Returns)
Here:
$44,942
State:
$53,767
Salary/wage: $41,242 (reported on 83.3% of returns)
Here:
$41,242
State:
$45,421
(% of AGI for various income ranges: 69.9% for AGIs below $25k, 79.4% for AGIs $25k-50k, 81.7% for AGIs $50k-75k, 85.8% for AGIs $75k-100k, 64.2% for AGIs $100k-200k)
Taxable interest for individuals: $736 (reported on 22.9% of returns)
This zip code:
$736
Tennessee:
$1,732
(% of AGI for various income ranges: 1.2% for AGIs below $25k, 0.5% for AGIs $25k-50k, 0.3% for AGIs $50k-75k, 0.1% for AGIs $75k-100k, 0.2% for AGIs $100k-200k)
Ordinary dividends: $700 (reported on 8.3% of returns)
Here:
$700
State:
$6,739
Net capital gain/loss in AGI: +$850 (reported on 8.3% of returns)
Here:
+$850
State:
+$19,082
Profit/loss from business: +$6,725 (reported on 16.7% of returns)
Here:
+$6,725
State:
+$15,240
Taxable individual retirement arrangement distribution: $5,033 (reported on 6.2% of returns)
37141:
$5,033
Tennessee:
$15,505
Total itemized deductions: $18,191 (24% of AGI, reported on 22.9% of returns)
Here:
$18,191
State:
$21,976
Here:
24.4% of AGI
State:
17.8% of AGI
(% of AGI for various income ranges: 12.0% for AGIs $25k-50k, 8.6% for AGIs $50k-75k, 9.9% for AGIs $75k-100k, 11.0% for AGIs $100k-200k)
Charity contributions: $4,638 (reported on 16.7% of returns)
Here:
$4,638
State:
$6,709
(% of AGI for various income ranges: 3.6% for AGIs $25k-50k, 2.2% for AGIs $75k-100k, 2.1% for AGIs $100k-200k)
Taxes paid: $3,182 (reported on 22.9% of returns)
37141:
$3,182
State:
$4,829
(% of AGI for various income ranges: 1.5% for AGIs $25k-50k, 1.3% for AGIs $50k-75k, 2.4% for AGIs $75k-100k, 2.2% for AGIs $100k-200k)
Earned income credit: $2,500 (reported on 22.9% of returns)
Here:
$2,500
State:
$2,404
(% of AGI for various income ranges: 8.7% for AGIs below $25k, 1.9% for AGIs $25k-50k)
Percentage of individuals using paid preparers for their 2012 taxes: 54.2%
Here:
54%
State:
52%
(% for various income ranges: 50.0% for AGIs below $25k, 53.8% for AGIs $25k-50k, 62.5% for AGIs $50k-75k, 40.0% for AGIs $75k-100k, 75.0% for AGIs $100k-200k)
Averages for the 2004 tax year for zip code 37141, filed in 2005:
Average Adjusted Gross Income (AGI) in 2004: $34,398 (Individual Income Tax Returns)
Here:
$34,398
State:
$44,088
Salary/wage: $33,989 (reported on 85.1% of returns)
Here:
$33,989
State:
$38,825
(% of AGI for various income ranges: 69.3% for AGIs below $10k, 73.8% for AGIs $10k-25k, 84.8% for AGIs $25k-50k, 90.0% for AGIs $50k-75k, 81.8% for AGIs $75k-100k)
Taxable interest for individuals: $906 (reported on 38.5% of returns)
This zip code:
$906
Tennessee:
$1,802
(% of AGI for various income ranges: 4.1% for AGIs below $10k, 1.8% for AGIs $10k-25k, 1.5% for AGIs $25k-50k, 0.3% for AGIs $50k-75k, 0.6% for AGIs $75k-100k)
Taxable dividends: $531 (reported on 11.1% of returns)
Here:
$531
State:
$3,727
Net capital gain/loss: +$362 (reported on 10.6% of returns)
Here:
+$362
State:
+$15,776
(% of AGI for various income ranges: 4.3% for AGIs below $10k, -0.1% for AGIs $25k-50k, -0.2% for AGIs $50k-75k, 0.2% for AGIs $75k-100k)
Profit/loss from business: +$5,730 (reported on 16.7% of returns)
Here:
+$5,730
State:
+$12,882
(% of AGI for various income ranges: 4.3% for AGIs below $10k, 9.0% for AGIs $10k-25k, 5.2% for AGIs $25k-50k, 0.0% for AGIs $50k-75k)
Profit/loss from farming: +$955 (reported on 10.0% of returns)
Here:
+$955
State:
-$6,038
Total itemized deductions: $14,972 (27% of AGI, reported on 24.4% of returns)
Here:
$14,972
State:
$18,035
Here:
26.6% of AGI
State:
19.9% of AGI
(% of AGI for various income ranges: 9.3% for AGIs $10k-25k, 9.0% for AGIs $25k-50k, 13.6% for AGIs $50k-75k, 10.9% for AGIs $75k-100k)
Charity contributions deductions: $2,841 (5% of AGI, reported on 18.6% of returns)
Here:
$2,841
State:
$5,167
Here:
5.1% of AGI
State:
5.3% of AGI
Total tax: $3,745 (reported on 74.4% of returns)
37141:
$3,745
State:
$7,482
(% of AGI for various income ranges: 3.6% for AGIs below $10k, 4.3% for AGIs $10k-25k, 6.9% for AGIs $25k-50k, 7.6% for AGIs $50k-75k, 13.0% for AGIs $75k-100k)
Earned income credit: $1,597 (reported on 17.4% of returns)
Here:
$1,597
State:
$1,826
Percentage of individuals using paid preparers for their 2004 taxes: 64.7%
Here:
65%
State:
60%
(% for various income ranges: 56.5% for AGIs below $10k, 65.3% for AGIs $10k-25k, 68.9% for AGIs $25k-50k, 62.0% for AGIs $50k-75k, 74.3% for AGIs $75k-100k)
Household received Food Stamps/SNAP in the past 12 months: 72 Household did not receive Food Stamps/SNAP in the past 12 months: 510
Women who had a birth in the past 12 months: 5 (6 now married, 0 unmarried) Women who did not have a birth in the past 12 months: 313 (225 now married, 88 unmarried)
Housing units in zip code 37141 with a mortgage: 202 (4 second mortgage) Houses without a mortgage: 3
Median monthly owner costs for units with a mortgage: $1,417 Median monthly owner costs for units without a mortgage: $508
Residents with income below the poverty level in 2022:
This zip code:
5.8%
Whole state:
13.3%
Residents with income below 50% of the poverty level in 2022:
This zip code:
2.2%
Whole state:
7.1%
Median number of rooms in houses and condos:
Here:
6.3
State:
6.5
Median number of rooms in apartments:
Here:
6.0
State:
4.4
Notable locations in this zip code not listed on our city pages
Churches in zip code 37141 include: Pleasant Hill Church (A), Bethany Church (B), Mount Pleasant Church (C), Orlinda Baptist Church (D). Display/hide their locations on the map
Cemeteries: House Cemetery (1), Jernigan Cemetery (2), Jones Cemetery (3), Yates Cemetery (4), Austin Cemetery (5), West Cemetery (6), Weir Cemetery (7). Display/hide their locations on the map
Size of family households: 267 2-persons, 54 3-persons, 144 4-persons, 23 5-persons
Size of nonfamily households: 80 1-person, 9 2-persons
210 married couples with children.
70 single-parent households (63 men, 7 women).
99.9% of residents of 37141 zip code speak English at home.
Foreign born population: 0 (0.0%)
:
0.0%
Whole state:
5.6%
59%American
9%English
6%Scotch-Irish
6%Scottish
5%Irish
2%German
1%European
Housing units lacking complete plumbing facilities: 1.2% Housing units lacking complete kitchen facilities: 2.2%
65.7%Electricity
24.0%Utility gas
9.4%Bottled, tank, or LP gas
1.3%Wood
Population in 1990: 614. Population change in the 1990s: +292 (+47.6%).
Place of birth for U.S.-born residents:
This state: 1,151
Northeast: 50
Midwest: 59
South: 237
West: 32
76% of the 37141 zip code residents lived in the same house 5 years ago. Out of people who lived in different houses, 55% lived in this county. Out of people who lived in different counties, 50% lived in Tennessee.
97% of the 37141 zip code residents lived in the same house 1 year ago. Out of people who lived in different houses, 68% moved from this county. Out of people who lived in different houses, 41% moved from different county within same state.
Private vs. public school enrollment:
Students in private schools in grades 1 to 8 (elementary and middle school):
Here:
0.0%
Tennessee:
15.0%
Students in private schools in grades 9 to 12 (high school): 2
Here:
1.7%
Tennessee:
16.2%
Students in private undergraduate colleges:
Here:
2.9%
Tennessee:
23.5%
Occupation by median earnings in the past 12 months ($)
84,873Production occupations
84,470Fire fighting and prevention, and other protective service workers including supervisors
65,247Management occupations
59,594Health technologists and technicians
57,263Construction and extraction occupations
45,331Education, training, and library occupations
Top industries in this zip code by the number of employees in 2005:
Other Services (except Public Administration): Religious Organizations (5-9 employees: 1 establishment, 1-4 employees: 1 establishment)
Other Services (except Public Administration): Car Washes (1-4: 1)
Health Care and Social Assistance: Services for the Elderly and Persons with Disabilities (1-4: 1)
Finance and Insurance: Commercial Banking (1-4: 1)
Fatal accident statistics in 2013:
Fatal accident count: 1
Vehicles involved in fatal accidents: 2
Fatal accidents caused by drunken drivers: 1
Fatalities: 2
Persons involved in fatal accidents: 2
Pedestrians involved in fatal accidents: 0
Fatal accident statistics in 2012:
Fatal accident count: 1
Vehicles involved in fatal accidents: 1
Fatal accidents caused by drunken drivers: 1
Fatalities: 1
Persons involved in fatal accidents: 1
Pedestrians involved in fatal accidents: 0
Home Mortgage Disclosure Act Aggregated Statistics For Year 2009 (Based on 2 partial tracts)
A) FHA, FSA/RHS & VA Home Purchase Loans
B) Conventional Home Purchase Loans
C) Refinancings
D) Home Improvement Loans
F) Non-occupant Loans on < 5 Family Dwellings (A B C & D)
G) Loans On Manufactured Home Dwelling (A B C & D)
Number
Average Value
Number
Average Value
Number
Average Value
Number
Average Value
Number
Average Value
Number
Average Value
LOANS ORIGINATED
13
$148,157
8
$141,642
55
$144,260
5
$59,028
9
$120,373
8
$70,199
APPLICATIONS APPROVED, NOT ACCEPTED
1
$57,390
1
$102,480
5
$115,012
0
$0
1
$39,820
1
$102,480
APPLICATIONS DENIED
2
$103,650
3
$60,707
28
$135,734
6
$38,942
1
$83,740
5
$70,740
APPLICATIONS WITHDRAWN
2
$72,030
2
$98,675
15
$129,613
2
$24,010
1
$57,970
3
$84,717
FILES CLOSED FOR INCOMPLETENESS
0
$0
0
$0
2
$245,660
0
$0
0
$0
0
$0
Aggregated Statistics For Year 2008 (Based on 2 partial tracts)
A) FHA, FSA/RHS & VA Home Purchase Loans
B) Conventional Home Purchase Loans
C) Refinancings
D) Home Improvement Loans
F) Non-occupant Loans on < 5 Family Dwellings (A B C & D)
G) Loans On Manufactured Home Dwelling (A B C & D)
Number
Average Value
Number
Average Value
Number
Average Value
Number
Average Value
Number
Average Value
Number
Average Value
LOANS ORIGINATED
15
$153,505
22
$156,675
47
$124,309
9
$63,180
11
$89,117
6
$96,038
APPLICATIONS APPROVED, NOT ACCEPTED
1
$182,120
1
$122,390
2
$216,670
1
$6,440
0
$0
1
$53,880
APPLICATIONS DENIED
4
$118,730
2
$109,800
30
$133,985
8
$16,324
1
$108,920
2
$74,955
APPLICATIONS WITHDRAWN
2
$176,560
3
$145,620
16
$140,727
1
$8,780
1
$124,730
1
$94,280
FILES CLOSED FOR INCOMPLETENESS
1
$42,750
1
$82,570
2
$92,820
0
$0
0
$0
0
$0
Aggregated Statistics For Year 2007 (Based on 2 partial tracts)
A) FHA, FSA/RHS & VA Home Purchase Loans
B) Conventional Home Purchase Loans
C) Refinancings
D) Home Improvement Loans
F) Non-occupant Loans on < 5 Family Dwellings (A B C & D)
G) Loans On Manufactured Home Dwelling (A B C & D)
Number
Average Value
Number
Average Value
Number
Average Value
Number
Average Value
Number
Average Value
Number
Average Value
LOANS ORIGINATED
9
$144,839
32
$130,168
55
$134,071
8
$38,869
13
$110,768
12
$88,718
APPLICATIONS APPROVED, NOT ACCEPTED
1
$63,240
3
$123,560
8
$136,884
0
$0
1
$123,560
1
$64,420
APPLICATIONS DENIED
1
$155,180
11
$120,207
41
$124,490
4
$43,920
2
$117,120
6
$96,917
APPLICATIONS WITHDRAWN
1
$57,970
4
$146,985
18
$108,238
1
$119,460
0
$0
2
$82,570
FILES CLOSED FOR INCOMPLETENESS
0
$0
0
$0
1
$135,860
1
$58,560
0
$0
0
$0
Aggregated Statistics For Year 2006 (Based on 2 partial tracts)
A) FHA, FSA/RHS & VA Home Purchase Loans
B) Conventional Home Purchase Loans
C) Refinancings
D) Home Improvement Loans
F) Non-occupant Loans on < 5 Family Dwellings (A B C & D)
G) Loans On Manufactured Home Dwelling (A B C & D)
Number
Average Value
Number
Average Value
Number
Average Value
Number
Average Value
Number
Average Value
Number
Average Value
LOANS ORIGINATED
6
$155,282
41
$104,880
32
$130,753
8
$52,778
8
$109,654
5
$75,426
APPLICATIONS APPROVED, NOT ACCEPTED
0
$0
8
$83,521
4
$127,222
2
$12,300
2
$72,030
2
$50,655
APPLICATIONS DENIED
0
$0
4
$85,498
34
$146,486
7
$41,661
2
$66,760
2
$73,785
APPLICATIONS WITHDRAWN
0
$0
3
$101,700
20
$114,192
3
$67,150
0
$0
1
$39,240
FILES CLOSED FOR INCOMPLETENESS
1
$67,930
2
$97,210
4
$115,510
1
$11,710
0
$0
1
$67,930
Aggregated Statistics For Year 2005 (Based on 2 partial tracts)
A) FHA, FSA/RHS & VA Home Purchase Loans
B) Conventional Home Purchase Loans
C) Refinancings
D) Home Improvement Loans
F) Non-occupant Loans on < 5 Family Dwellings (A B C & D)
G) Loans On Manufactured Home Dwelling (A B C & D)
Number
Average Value
Number
Average Value
Number
Average Value
Number
Average Value
Number
Average Value
Number
Average Value
LOANS ORIGINATED
6
$121,805
45
$98,042
47
$107,551
9
$78,340
7
$63,161
8
$78,105
APPLICATIONS APPROVED, NOT ACCEPTED
0
$0
12
$77,446
15
$87,645
3
$39,820
0
$0
1
$7,610
APPLICATIONS DENIED
1
$121,800
8
$137,762
30
$101,016
12
$36,844
1
$14,640
6
$92,915
APPLICATIONS WITHDRAWN
2
$126,490
10
$100,079
29
$111,143
4
$99,552
0
$0
4
$63,685
FILES CLOSED FOR INCOMPLETENESS
0
$0
0
$0
4
$104,238
1
$11,710
0
$0
0
$0
Aggregated Statistics For Year 2004 (Based on 2 partial tracts)
A) FHA, FSA/RHS & VA Home Purchase Loans
B) Conventional Home Purchase Loans
C) Refinancings
D) Home Improvement Loans
F) Non-occupant Loans on < 5 Family Dwellings (A B C & D)
G) Loans On Manufactured Home Dwelling (A B C & D)
Number
Average Value
Number
Average Value
Number
Average Value
Number
Average Value
Number
Average Value
Number
Average Value
LOANS ORIGINATED
8
$114,558
26
$106,354
64
$110,139
10
$18,622
4
$111,265
10
$84,853
APPLICATIONS APPROVED, NOT ACCEPTED
0
$0
4
$72,175
9
$89,271
1
$15,810
1
$94,870
1
$50,950
APPLICATIONS DENIED
3
$88,230
15
$65,041
49
$94,521
5
$40,992
1
$57,970
12
$75,396
APPLICATIONS WITHDRAWN
2
$126,195
4
$78,762
32
$95,691
2
$47,140
2
$138,200
4
$64,855
FILES CLOSED FOR INCOMPLETENESS
0
$0
0
$0
2
$89,890
0
$0
0
$0
0
$0
Aggregated Statistics For Year 2003 (Based on 2 partial tracts)
A) FHA, FSA/RHS & VA Home Purchase Loans
B) Conventional Home Purchase Loans
C) Refinancings
D) Home Improvement Loans
F) Non-occupant Loans on < 5 Family Dwellings (A B C & D)
Number
Average Value
Number
Average Value
Number
Average Value
Number
Average Value
Number
Average Value
LOANS ORIGINATED
9
$116,730
24
$94,648
83
$96,497
8
$38,138
2
$63,540
APPLICATIONS APPROVED, NOT ACCEPTED
2
$27,230
14
$56,803
9
$93,827
1
$2,340
1
$50,360
APPLICATIONS DENIED
3
$60,513
25
$72,193
34
$95,022
2
$40,405
1
$40,990
APPLICATIONS WITHDRAWN
1
$69,100
2
$102,775
27
$98,663
1
$28,110
1
$81,400
FILES CLOSED FOR INCOMPLETENESS
0
$0
0
$0
4
$111,118
1
$77,300
0
$0
Aggregated Statistics For Year 2002 (Based on 2 partial tracts)
A) FHA, FSA/RHS & VA Home Purchase Loans
B) Conventional Home Purchase Loans
C) Refinancings
D) Home Improvement Loans
F) Non-occupant Loans on < 5 Family Dwellings (A B C & D)
Number
Average Value
Number
Average Value
Number
Average Value
Number
Average Value
Number
Average Value
LOANS ORIGINATED
10
$106,638
22
$98,540
74
$98,713
5
$19,208
4
$72,908
APPLICATIONS APPROVED, NOT ACCEPTED
1
$66,170
7
$78,051
10
$98,908
0
$0
0
$0
APPLICATIONS DENIED
1
$96,040
18
$63,896
30
$104,217
8
$31,549
1
$21,080
APPLICATIONS WITHDRAWN
2
$71,445
4
$69,392
20
$98,644
2
$17,570
0
$0
FILES CLOSED FOR INCOMPLETENESS
0
$0
1
$59,150
5
$144,644
0
$0
0
$0
Aggregated Statistics For Year 2001 (Based on 2 partial tracts)
A) FHA, FSA/RHS & VA Home Purchase Loans
B) Conventional Home Purchase Loans
C) Refinancings
D) Home Improvement Loans
F) Non-occupant Loans on < 5 Family Dwellings (A B C & D)
Number
Average Value
Number
Average Value
Number
Average Value
Number
Average Value
Number
Average Value
LOANS ORIGINATED
13
$102,570
23
$82,442
83
$88,468
5
$21,316
6
$53,485
APPLICATIONS APPROVED, NOT ACCEPTED
0
$0
4
$57,095
5
$75,542
2
$15,810
0
$0
APPLICATIONS DENIED
2
$79,640
12
$76,860
39
$82,539
4
$13,175
1
$56,800
APPLICATIONS WITHDRAWN
1
$122,980
2
$79,935
23
$94,714
1
$9,960
1
$36,890
FILES CLOSED FOR INCOMPLETENESS
0
$0
0
$0
8
$85,205
0
$0
1
$51,530
Aggregated Statistics For Year 2000 (Based on 2 partial tracts)
A) FHA, FSA/RHS & VA Home Purchase Loans
B) Conventional Home Purchase Loans
C) Refinancings
D) Home Improvement Loans
F) Non-occupant Loans on < 5 Family Dwellings (A B C & D)
Number
Average Value
Number
Average Value
Number
Average Value
Number
Average Value
Number
Average Value
LOANS ORIGINATED
13
$105,633
29
$85,800
37
$77,916
4
$13,615
1
$31,620
APPLICATIONS APPROVED, NOT ACCEPTED
0
$0
4
$66,320
10
$75,074
1
$5,270
1
$49,780
APPLICATIONS DENIED
2
$86,085
19
$41,763
27
$71,747
8
$17,202
0
$0
APPLICATIONS WITHDRAWN
2
$114,190
5
$119,930
21
$75,682
1
$93,700
0
$0
FILES CLOSED FOR INCOMPLETENESS
0
$0
2
$67,050
5
$59,614
0
$0
1
$32,210
Aggregated Statistics For Year 1999 (Based on 1 partial tract)
A) FHA, FSA/RHS & VA Home Purchase Loans
B) Conventional Home Purchase Loans
C) Refinancings
D) Home Improvement Loans
F) Non-occupant Loans on < 5 Family Dwellings (A B C & D)
Detailed PMIC statistics for the following Tracts:0801.01
2002 - 2018 National Fire Incident Reporting System (NFIRS) incidents
According to the data from the years 2002 - 2018 the average number of fires per year is 17. The highest number of reported fire incidents - 37 took place in 2010, and the least - 8 in 2003. The data has a rising trend.
When looking into fire subcategories, the most reports belonged to: Outside Fires (46.3%), and Mobile Property/Vehicle Fires (27.6%).
Fire incident types reported to NFIRS in Zip Code 37141


+$955
-$6,038
 Nearest zip codes: 37049, 37188, 42202, 37048, 42134, 37172.


 According to the data from the years 2002 - 2018 the average number of fires per year is 17. The highest number of reported fire incidents - 37 took place in 2010, and the least - 8 in 2003. The data has a rising trend.
 When looking into fire subcategories, the most reports belonged to: Outside Fires (46.3%), and Mobile Property/Vehicle Fires (27.6%).