Estimated zip code population in 2022: 4,396 Zip code population in 2010: 4,020 Zip code population in 2000: 3,977
Houses and condos: 1,781 Renter-occupied apartments: 155
% of renters here:
10%
State:
33%
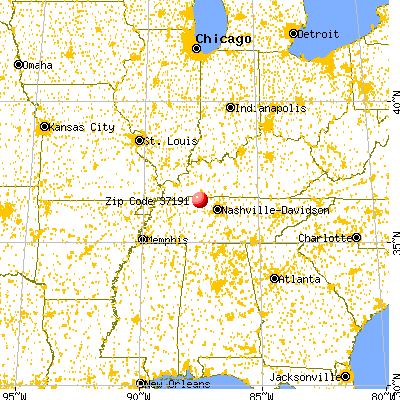
March 2022 cost of living index in zip code 37191: 79.4 (low, U.S. average is 100)
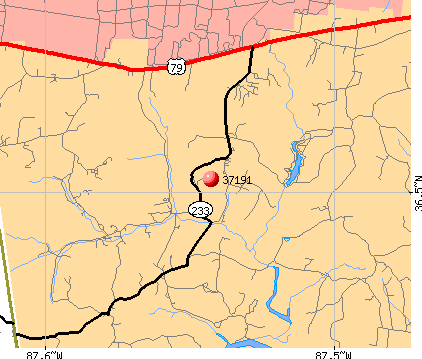
Land area: 41.5 sq. mi. Water area: 0.4 sq. mi.
Population density: 106 people per square mile
(very low).
OSM Map
General Map
Google Map
MSN Map
OSM Map
General Map
Google Map
MSN Map
OSM Map
General Map
Google Map
MSN Map
OSM Map
General Map
Google Map
MSN Map
Please wait while loading the map...
Real estate property taxes paid for housing units in 2022:
This zip code:
0.5% ($1,437)
Tennessee:
0.5% ($1,376)
Median real estate property taxes paid for housing units with mortgages in 2022: $1,447 (0.5%) Median real estate property taxes paid for housing units with no mortgage in 2022: $1,423 (0.7%)
Estimated median house/condo value in 2022: $271,793
37191:
$271,793
Tennessee:
$284,800
According to our research of Tennessee and other state lists, there were 12 registered sex offenders living in 37191 zip code as of May 28, 2024. The ratio of all residents to sex offenders in zip code 37191 is 322 to 1. The ratio of registered sex offenders to all residents in this zip code is near the state average.
Median resident age:
This zip code:
37.6 years
Tennessee median age:
39.2 years
Average household size:
This zip code:
2.9 people
Tennessee:
2.4 people
Averages for the 2020 tax year for zip code 37191, filed in 2021:
Average Adjusted Gross Income (AGI) in 2020: $56,991 (Individual Income Tax Returns)
Here:
$56,991
State:
$69,014
Salary/wage: $47,404 (reported on 82.0% of returns)
Here:
$47,404
State:
$55,872
(% of AGI for various income ranges: 1310.2% for AGIs below $25k, 3428.8% for AGIs $25k-50k, 6048.5% for AGIs $50k-75k, 8939.3% for AGIs $75k-100k, 13834.7% for AGIs $100k-200k)
Taxable interest for individuals: $862 (reported on 24.2% of returns)
This zip code:
$862
Tennessee:
$1,945
(% of AGI for various income ranges: 10.2% for AGIs below $25k, 18.1% for AGIs $25k-50k, 18.5% for AGIs $50k-75k, 16.7% for AGIs $75k-100k, 107.3% for AGIs $100k-200k)
Ordinary dividends: $1,189 (reported on 9.8% of returns)
Here:
$1,189
State:
$8,105
(% of AGI for various income ranges: 7.8% for AGIs below $25k, 4.8% for AGIs $25k-50k, 12.6% for AGIs $50k-75k, 10.0% for AGIs $75k-100k, 81.3% for AGIs $100k-200k)
Net capital gain/loss in AGI: +$10,670 (reported on 10.3% of returns)
Here:
+$10,670
State:
+$33,664
(% of AGI for various income ranges: 3.6% for AGIs below $25k, 1.9% for AGIs $25k-50k, 7.0% for AGIs $50k-75k, 301.3% for AGIs $75k-100k, 1092.7% for AGIs $100k-200k)
Profit/loss from business: +$11,528 (reported on 14.9% of returns)
Here:
+$11,528
State:
+$18,991
(% of AGI for various income ranges: 118.7% for AGIs below $25k, 111.7% for AGIs $25k-50k, 202.6% for AGIs $50k-75k, 342.7% for AGIs $75k-100k, 852.7% for AGIs $100k-200k)
Taxable individual retirement arrangement distribution: $13,109 (reported on 5.7% of returns)
37191:
$13,109
Tennessee:
$20,036
(% of AGI for various income ranges: 55.1% for AGIs below $25k, 184.8% for AGIs $50k-75k, 463.3% for AGIs $100k-200k)
Total itemized deductions: $33,920 (reported on 2.6% of returns)
Here:
$33,920
State:
$40,136
(% of AGI for various income ranges: 126.4% for AGIs $25k-50k, 776.7% for AGIs $100k-200k)
Charity contributions: $18,875 (reported on 2.1% of returns)
Here:
$18,875
State:
$19,852
(% of AGI for various income ranges: 503.3% for AGIs $100k-200k)
Taxes paid: $4,680 (reported on 2.6% of returns)
37191:
$4,680
State:
$6,038
(% of AGI for various income ranges: 17.9% for AGIs $25k-50k, 106.0% for AGIs $100k-200k)
Earned income credit: $2,097 (reported on 18.0% of returns)
Here:
$2,097
State:
$2,391
(% of AGI for various income ranges: 97.1% for AGIs below $25k, 70.7% for AGIs $25k-50k)
Percentage of individuals using paid preparers for their 2020 taxes: 94.8%
Here:
95%
State:
93%
(% for various income ranges: 93.4% for AGIs below $25k, 96.1% for AGIs $25k-50k, 94.3% for AGIs $50k-75k, 95.2% for AGIs $75k-100k, 95.7% for AGIs $100k-200k, 100.0% for AGIs over 200k)
Averages for the 2012 tax year for zip code 37191, filed in 2013:
Average Adjusted Gross Income (AGI) in 2012: $48,011 (Individual Income Tax Returns)
Here:
$48,011
State:
$53,767
Salary/wage: $43,015 (reported on 84.3% of returns)
Here:
$43,015
State:
$45,421
(% of AGI for various income ranges: 74.3% for AGIs below $25k, 81.6% for AGIs $25k-50k, 78.7% for AGIs $50k-75k, 79.2% for AGIs $75k-100k, 67.5% for AGIs $100k-200k)
Taxable interest for individuals: $465 (reported on 28.7% of returns)
This zip code:
$465
Tennessee:
$1,732
(% of AGI for various income ranges: 0.5% for AGIs below $25k, 0.4% for AGIs $25k-50k, 0.2% for AGIs $50k-75k, 0.2% for AGIs $75k-100k, 0.2% for AGIs $100k-200k)
Ordinary dividends: $2,524 (reported on 11.8% of returns)
Here:
$2,524
State:
$6,739
(% of AGI for various income ranges: 3.4% for AGIs below $25k, 0.6% for AGIs $25k-50k, 0.1% for AGIs $50k-75k, 0.4% for AGIs $100k-200k)
Net capital gain/loss in AGI: +$4,956 (reported on 10.1% of returns)
Here:
+$4,956
State:
+$19,082
(% of AGI for various income ranges: 0.2% for AGIs $25k-50k, 0.5% for AGIs $50k-75k, 0.4% for AGIs $75k-100k, 2.7% for AGIs $100k-200k)
Profit/loss from business: +$7,270 (reported on 12.9% of returns)
Here:
+$7,270
State:
+$15,240
(% of AGI for various income ranges: 4.5% for AGIs below $25k, 2.4% for AGIs $25k-50k, 2.8% for AGIs $50k-75k, 1.5% for AGIs $100k-200k)
Taxable individual retirement arrangement distribution: $8,380 (reported on 5.6% of returns)
37191:
$8,380
Tennessee:
$15,505
(% of AGI for various income ranges: 1.4% for AGIs $25k-50k, 1.0% for AGIs $50k-75k, 2.6% for AGIs $75k-100k)
Total itemized deductions: $17,628 (20% of AGI, reported on 18.0% of returns)
Here:
$17,628
State:
$21,976
Here:
19.6% of AGI
State:
17.8% of AGI
(% of AGI for various income ranges: 4.8% for AGIs below $25k, 4.9% for AGIs $25k-50k, 7.8% for AGIs $50k-75k, 6.7% for AGIs $75k-100k, 7.5% for AGIs $100k-200k)
Charity contributions: $4,752 (reported on 14.0% of returns)
Here:
$4,752
State:
$6,709
(% of AGI for various income ranges: 0.5% for AGIs below $25k, 1.0% for AGIs $25k-50k, 1.5% for AGIs $50k-75k, 1.6% for AGIs $75k-100k, 1.7% for AGIs $100k-200k)
Taxes paid: $3,430 (reported on 18.5% of returns)
37191:
$3,430
State:
$4,829
(% of AGI for various income ranges: 0.6% for AGIs below $25k, 0.8% for AGIs $25k-50k, 1.6% for AGIs $50k-75k, 1.3% for AGIs $75k-100k, 1.8% for AGIs $100k-200k)
Earned income credit: $2,391 (reported on 19.1% of returns)
Here:
$2,391
State:
$2,404
(% of AGI for various income ranges: 6.6% for AGIs below $25k, 1.5% for AGIs $25k-50k)
Percentage of individuals using paid preparers for their 2012 taxes: 45.5%
Here:
46%
State:
52%
(% for various income ranges: 36.9% for AGIs below $25k, 48.0% for AGIs $25k-50k, 48.1% for AGIs $50k-75k, 52.6% for AGIs $75k-100k, 58.8% for AGIs $100k-200k)
Averages for the 2004 tax year for zip code 37191, filed in 2005:
Average Adjusted Gross Income (AGI) in 2004: $37,035 (Individual Income Tax Returns)
Here:
$37,035
State:
$44,088
Salary/wage: $34,692 (reported on 87.5% of returns)
Here:
$34,692
State:
$38,825
(% of AGI for various income ranges: 150.2% for AGIs below $10k, 83.1% for AGIs $10k-25k, 85.3% for AGIs $25k-50k, 83.5% for AGIs $50k-75k, 82.6% for AGIs $75k-100k, 64.5% for AGIs over 100k)
Taxable interest for individuals: $848 (reported on 33.6% of returns)
This zip code:
$848
Tennessee:
$1,802
(% of AGI for various income ranges: 5.0% for AGIs below $10k, 0.9% for AGIs $10k-25k, 1.1% for AGIs $25k-50k, 0.5% for AGIs $50k-75k, 0.4% for AGIs $75k-100k, 0.6% for AGIs over 100k)
Taxable dividends: $555 (reported on 13.1% of returns)
Here:
$555
State:
$3,727
(% of AGI for various income ranges: 1.8% for AGIs below $10k, 0.1% for AGIs $10k-25k, 0.2% for AGIs $25k-50k, 0.1% for AGIs $50k-75k, 0.2% for AGIs $75k-100k, 0.4% for AGIs over 100k)
Net capital gain/loss: +$3,628 (reported on 10.4% of returns)
Here:
+$3,628
State:
+$15,776
(% of AGI for various income ranges: 3.7% for AGIs below $10k, 0.4% for AGIs $10k-25k, 0.2% for AGIs $25k-50k, 1.2% for AGIs $50k-75k, 0.9% for AGIs $75k-100k, 2.6% for AGIs over 100k)
Profit/loss from business: +$7,057 (reported on 14.2% of returns)
Here:
+$7,057
State:
+$12,882
(% of AGI for various income ranges: 5.6% for AGIs below $10k, 5.6% for AGIs $10k-25k, 2.0% for AGIs $25k-50k, 2.0% for AGIs $50k-75k, 1.2% for AGIs $75k-100k, 4.4% for AGIs over 100k)
IRA payment deduction: $2,159 (reported on 2.5% of returns)
37191:
$2,159
Tennessee:
$2,934
Total itemized deductions: $14,379 (23% of AGI, reported on 22.4% of returns)
Here:
$14,379
State:
$18,035
Here:
23.1% of AGI
State:
19.9% of AGI
(% of AGI for various income ranges: 14.1% for AGIs below $10k, 4.4% for AGIs $10k-25k, 7.9% for AGIs $25k-50k, 9.3% for AGIs $50k-75k, 11.7% for AGIs $75k-100k, 8.6% for AGIs over 100k)
Charity contributions deductions: $3,542 (5% of AGI, reported on 17.3% of returns)
Here:
$3,542
State:
$5,167
Here:
5.3% of AGI
State:
5.3% of AGI
(% of AGI for various income ranges: 0.9% for AGIs $10k-25k, 1.1% for AGIs $25k-50k, 1.7% for AGIs $50k-75k, 2.1% for AGIs $75k-100k, 2.9% for AGIs over 100k)
Total tax: $4,443 (reported on 72.5% of returns)
37191:
$4,443
State:
$7,482
(% of AGI for various income ranges: 6.1% for AGIs below $10k, 3.8% for AGIs $10k-25k, 5.7% for AGIs $25k-50k, 8.0% for AGIs $50k-75k, 10.5% for AGIs $75k-100k, 18.4% for AGIs over 100k)
Earned income credit: $1,680 (reported on 19.5% of returns)
Here:
$1,680
State:
$1,826
Percentage of individuals using paid preparers for their 2004 taxes: 57.4%
Here:
57%
State:
60%
(% for various income ranges: 48.0% for AGIs below $10k, 62.1% for AGIs $10k-25k, 57.4% for AGIs $25k-50k, 54.3% for AGIs $50k-75k, 68.1% for AGIs $75k-100k, 66.1% for AGIs over 100k)
Household received Food Stamps/SNAP in the past 12 months: 82 Household did not receive Food Stamps/SNAP in the past 12 months: 1,463
Women who had a birth in the past 12 months: 108 (91 now married, 18 unmarried) Women who did not have a birth in the past 12 months: 984 (551 now married, 432 unmarried)
Housing units in zip code 37191 with a mortgage: 1,065 (46 second mortgage, 46 both second mortgage and home equity loan) Houses without a mortgage: 51
Median monthly owner costs for units with a mortgage: $1,430 Median monthly owner costs for units without a mortgage: $413
Residents with income below the poverty level in 2022:
This zip code:
4.0%
Whole state:
13.3%
Residents with income below 50% of the poverty level in 2022:
This zip code:
1.8%
Whole state:
7.1%
Median number of rooms in houses and condos:
Here:
6.7
State:
6.5
Median number of rooms in apartments:
Here:
5.1
State:
4.4
Notable locations in this zip code not listed on our city pages
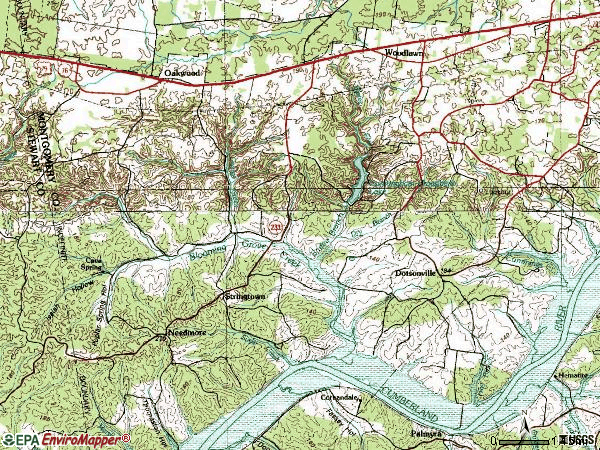
Notable locations in zip code 37191: Gate Number Ten (A), Bud Martins Landing (B), Haynes Landing (C), Legs Landing (D), York Landing (E), Woodlawn Volunteer Fire Service Station 19 (F). Display/hide their locations on the map
Churches in zip code 37191 include: Dotsonville Baptist Church (A), Woodlawn First Baptist Church (B), Griffey Church (C), Wilees Chapel (D), Haynes Chapel (E), Blooming Grove Church (F), Elizabeth Church (G). Display/hide their locations on the map
Streams, rivers, and creeks: Bascomb Eldrige Creek (A), Bartee Branch (B), Dry Branch (C), Cooper Creek (D), Cummings Creek (E), Outlaw Branch (F), Blooming Grove Creek (G). Display/hide their locations on the map
687 married couples with children.
93 single-parent households (93 men).
96.9% of residents of 37191 zip code speak English at home.
1.7% of residents speak Spanish at home (100% very well).
0.9% of residents speak other Indo-European language at home (74% very well, 26% well).
0.1% of residents speak Asian or Pacific Island language at home (100% very well).
Foreign born population: 91 (2.1%) (65.6% of them are naturalized citizens)
This zip code:
2.1%
Whole state:
5.6%
32%Sweden
20%Thailand
15%France
10%Bulgaria
28%American
17%English
17%Irish
7%German
4%European
3%Italian
3%Norwegian
Year of entry for the foreign-born population
202010 or later
372000 to 2009
421990 to 1999
20Before 1990
Facilities with environmental interests located in this zip code:
BI-COUNTY SOLID WASTE MANAGEMENT SYSTEM (HIGHWAY 79 NORTH in WOODLAWN, TN)
AIR MINOR (AIRS/AFS) CRITERIA AND HAZARDOUS AIR POLLUTANT INVENTORY (Inventory of air pollution sources) Business SIC classification: REFUSE SYSTEMS Business NAICS classification: SOLID WASTE COMBUSTORS AND INCINERATORS.
BI-COUNTY SOLID WASTE MANAGEMENT SYSTEM LANDFILL (3212 DOVER RD in WOODLAWN, TN)
CRITERIA AND HAZARDOUS AIR POLLUTANT INVENTORY (Inventory of air pollution sources) Business SIC classification: REFUSE SYSTEMS Business NAICS classification: SOLID WASTE LANDFILL.
Housing units lacking complete plumbing facilities: 5.9% Housing units lacking complete kitchen facilities: 2.7%
90.5%Electricity
4.3%Bottled, tank, or LP gas
2.5%Utility gas
2.0%No fuel used
0.8%Wood
Population in 1990: 2,568. Population change in the 1990s: +1,409 (+54.9%).
Place of birth for U.S.-born residents:
This state: 1,611
Northeast: 188
Midwest: 907
South: 953
West: 666
42% of the 37191 zip code residents lived in the same house 5 years ago. Out of people who lived in different houses, 41% lived in this county. Out of people who lived in different counties, 50% lived in Tennessee.
87% of the 37191 zip code residents lived in the same house 1 year ago. Out of people who lived in different houses, 69% moved from this county. Out of people who lived in different houses, 25% moved from different county within same state.
Private vs. public school enrollment:
Students in private schools in grades 1 to 8 (elementary and middle school): 37
Here:
10.5%
Tennessee:
15.0%
Students in private schools in grades 9 to 12 (high school): 17
Here:
8.8%
Tennessee:
16.2%
Students in private undergraduate colleges: 28
Here:
14.3%
Tennessee:
23.5%
Occupation by median earnings in the past 12 months ($)
95,379Management occupations
94,582Health diagnosing and treating practitioners and other technical occupations
89,333Sales and related occupations
87,041Business and financial operations occupations
63,376Transportation occupations
60,315Education, training, and library occupations
Companies with federal contracts located in this zip code (WOODLAWN, TN):
KENNEDY SEPTICTANK SERVICE (2699 ST PAUL ROAD; small business) : $2,241,430 in 304 contractsfrom 2000 to 2006
Contracts for Lease or Rental of Equipment -- Plumbing, Heating, and Waste Disposal Equipment, Lease or Rental of Equipment -- Water Purification and Sewage Treatment Equipment, Other Housekeeping Services, Kitchen Equipment and Appliances, and moreby Army, Navy Signed by year:2000: $450,951; 2001: $194,818; 2002: $336,916; 2003: $373,557; 2004: $371,005; 2005: $366,366; 2006: $147,817.
Biggest contracts:
$230,272 with Army for Lease or Rental of Equipment -- Plumbing, Heating, and Waste Disposal Equipment. Taking place in KY. Signed on 2000-05-08. Completion date: 2002-05-31.
$52,160, same as above.Signed on 2005-04-27. Completion date: 2005-05-31.
$51,024, same as above.Signed on 2001-04-26. Completion date: 2002-05-31.
$49,140, same as above.Signed on 2006-06-07. Effective on 2006-06-06. Completion date: 2006-06-30.
LITTLE, WILLIAM (2220 DOVER RD; small business) : $202,069 in 23 contractsfrom 2003 to 2006
Contracts for Maintenance, Repair or Alteration of Real Property -- Restoration of real property, Maintenance, Repair or Alteration of Real Property -- Other Warehouse Buildings, Maintenance, Repair or Alteration of Real Property -- Conference Space and Facilities, Maintenance, Repair or Alteration of Real Property -- Heating and Cooling Plants, and moreby Army Signed by year:2000: $0; 2001: $0; 2002: $0; 2003: $72,242; 2004: $8,831; 2005: $64,532; 2006: $56,464.
Biggest contracts:
$19,342 with Army for Maintenance, Repair or Alteration of Real Property -- Restoration of real property. Taking place in KY. Signed on 2004-08-04. Completion date: 2004-09-24.
$18,940 with Army for Maintenance, Repair or Alteration of Real Property -- Other Warehouse Buildings. Taking place in KY. Signed on 2003-08-29. Completion date: 2003-11-10.
$16,283 with Army for Maintenance, Repair or Alteration of Real Property -- Conference Space and Facilities. Signed on 2005-09-01. Completion date: 2005-10-17.
$15,010 with Army for Maintenance, Repair or Alteration of Real Property -- Heating and Cooling Plants. Taking place in KY. Signed on 2006-02-10. Completion date: 2006-04-06.
G H & H CONTRACTORS (4415 LAKE RD; small business) : $150,034 in 18 contractsfrom 2000 to 2006
Contracts for Maintenance, Repair or Alteration of Real Property -- Other Administrative Facilities and Service Buildings, Maintenance, Repair or Alteration of Real Property -- Family Housing Facilities, Maintenance, Repair or Alteration of Real Property -- Other Warehouse Buildings, Maintenance, Repair or Alteration of Real Property -- Office Buildings, and moreby Army Signed by year:2000: $32,599; 2001: $1,375; 2002: $72,995; 2003: $2,179; 2004: $0; 2005: $28,266; 2006: $12,620.
Biggest contracts:
$21,530 with Army for Maintenance, Repair or Alteration of Real Property -- Other Administrative Facilities and Service Buildings. Taking place in KY. Signed on 2002-09-24. Completion date: 2002-10-24.
$21,000 with Army for Maintenance, Repair or Alteration of Real Property -- Family Housing Facilities. Taking place in KY. Signed on 2002-08-28. Completion date: 2002-09-27.
$20,650 with Army for Maintenance, Repair or Alteration of Real Property -- Other Warehouse Buildings. Taking place in KY. Signed on 2000-06-30. Completion date: 2000-08-11.
$15,900 with Army for Maintenance, Repair or Alteration of Real Property -- Office Buildings. Taking place in KY. Signed on 2002-09-27. Completion date: 2002-10-28.
BROADY, MARQUETTA (2355 DOVER RD; small business) : $28,950 in 5 contractsfrom 2004 to 2006
Contracts for Maintenance, Repair or Alteration of Real Property -- Maintenance Buildings, Maintenance, Repair or Alteration of Real Property -- Restoration of real property, Maintenance, Repair or Alteration of Real Property -- Other Non-Building Facilities by Army Signed by year:2000: $0; 2001: $0; 2002: $0; 2003: $0; 2004: $19,600; 2005: $0; 2006: $9,350.
Biggest contracts:
$22,768 with Army for Maintenance, Repair or Alteration of Real Property -- Maintenance Buildings. Taking place in KY. Signed on 2005-03-31. Completion date: 2005-04-21.
$9,800 with Army for Maintenance, Repair or Alteration of Real Property -- Restoration of real property. Taking place in KY. Signed on 2004-09-02. Completion date: 2004-10-08.
$9,800, same as above.Signed on 2004-09-22. Completion date: 2004-10-08.
$9,350 with Army for Maintenance, Repair or Alteration of Real Property -- Other Non-Building Facilities. Taking place in KY. Signed on 2006-02-03. Completion date: 2006-02-26.
DREAMSCAPES (2357 OUTLAW RD; small business) : $24,247 in 2 contractsfrom 2002 to 2006
$27,010 with Air Force for Landscaping/Groundskeeping Services. Taking place in OK. Signed on 2002-09-30. Completion date: 2002-10-23.
-$2,763 with Air Force for Landscaping/Groundskeeping Services. Taking place in IL. Signed on 2006-06-16. Completion date: 2003-04-30.
C K OUTFITTERS (2890 DOVER RD; small business)
$24,000 with Army for Household Furniture. Signed on 2003-02-11. Completion date: 2003-02-13.
A & K PORTABLE TOILETS LLC (2699 SAINT PAUL RD; small business) : $20,710 in 2 contractsfrom 2004 to 2005
$20,160 with Air Force for Maintenance, Repair and Rebuilding of Equipment -- Miscellaneous. Taking place in GA. Signed on 2004-12-07. Completion date: 2005-09-30.
$550, same as above.Signed on 2005-07-18. Completion date: 2005-09-30.
UNIQUE CLEANING CORPORATION (2661 LYLEWOOD RD; small business)
$3,600 with Army for Custodial Janitorial Services. Signed on 2003-06-10. Completion date: 2003-07-03.
Top industries in this zip code by the number of employees in 2005:
Administrative and Support and Waste Management and Remediation Services: Septic Tank and Related Services (20-49 employees: 1 establishment, 5-9 employees: 1 establishment)
Arts, Entertainment, and Recreation: Fitness and Recreational Sports Centers (20-49: 1)
Other Services (except Public Administration): Religious Organizations (5-9: 1, 1-4: 6)
Construction: Water and Sewer Line and Related Structures Construction (10-19: 1)
Health Care and Social Assistance: Home Health Care Services (5-9: 1)
Construction: Masonry Contractors (5-9: 1)
Accommodation and Food Services: Full-Service Restaurants (5-9: 1)
Accommodation and Food Services: Limited-Service Restaurants (5-9: 1)
Fatal accident statistics in 2014:
Fatal accident count: 2
Vehicles involved in fatal accidents: 2
Fatal accidents caused by drunken drivers: 0
Fatalities: 2
Persons involved in fatal accidents: 2
Pedestrians involved in fatal accidents: 0
Home Mortgage Disclosure Act Aggregated Statistics For Year 2009 (Based on 2 partial tracts)
A) FHA, FSA/RHS & VA Home Purchase Loans
B) Conventional Home Purchase Loans
C) Refinancings
D) Home Improvement Loans
F) Non-occupant Loans on < 5 Family Dwellings (A B C & D)
G) Loans On Manufactured Home Dwelling (A B C & D)
Number
Average Value
Number
Average Value
Number
Average Value
Number
Average Value
Number
Average Value
Number
Average Value
LOANS ORIGINATED
126
$138,970
27
$104,008
182
$132,002
21
$40,213
26
$118,212
13
$105,321
APPLICATIONS APPROVED, NOT ACCEPTED
4
$103,930
1
$67,510
32
$108,669
2
$17,765
4
$71,655
4
$82,315
APPLICATIONS DENIED
11
$139,113
4
$130,580
82
$124,218
31
$37,672
5
$108,728
4
$30,498
APPLICATIONS WITHDRAWN
12
$163,151
1
$72,250
51
$122,225
11
$35,316
4
$83,205
5
$113,228
FILES CLOSED FOR INCOMPLETENESS
1
$105,410
0
$0
15
$152,630
1
$23,690
0
$0
0
$0
Aggregated Statistics For Year 2008 (Based on 2 partial tracts)
A) FHA, FSA/RHS & VA Home Purchase Loans
B) Conventional Home Purchase Loans
C) Refinancings
D) Home Improvement Loans
F) Non-occupant Loans on < 5 Family Dwellings (A B C & D)
G) Loans On Manufactured Home Dwelling (A B C & D)
Number
Average Value
Number
Average Value
Number
Average Value
Number
Average Value
Number
Average Value
Number
Average Value
LOANS ORIGINATED
89
$135,261
30
$123,296
116
$131,856
21
$37,562
13
$77,532
11
$101,858
APPLICATIONS APPROVED, NOT ACCEPTED
0
$0
1
$111,330
17
$111,542
2
$46,190
0
$0
2
$131,470
APPLICATIONS DENIED
11
$139,436
6
$49,153
99
$107,098
52
$59,334
1
$88,830
14
$77,155
APPLICATIONS WITHDRAWN
8
$140,204
1
$31,980
36
$109,721
9
$36,848
2
$52,705
2
$84,090
FILES CLOSED FOR INCOMPLETENESS
1
$114,890
0
$0
12
$106,892
1
$90,010
0
$0
2
$100,675
Aggregated Statistics For Year 2007 (Based on 2 partial tracts)
A) FHA, FSA/RHS & VA Home Purchase Loans
B) Conventional Home Purchase Loans
C) Refinancings
D) Home Improvement Loans
F) Non-occupant Loans on < 5 Family Dwellings (A B C & D)
G) Loans On Manufactured Home Dwelling (A B C & D)
Number
Average Value
Number
Average Value
Number
Average Value
Number
Average Value
Number
Average Value
Number
Average Value
LOANS ORIGINATED
141
$133,997
109
$102,608
137
$118,725
37
$28,810
27
$72,643
15
$89,699
APPLICATIONS APPROVED, NOT ACCEPTED
4
$121,698
12
$129,889
19
$102,981
2
$12,435
5
$71,774
2
$104,225
APPLICATIONS DENIED
8
$132,949
27
$98,086
90
$113,005
47
$47,300
5
$45,244
13
$74,344
APPLICATIONS WITHDRAWN
15
$120,888
15
$112,281
37
$107,556
4
$63,662
0
$0
1
$105,410
FILES CLOSED FOR INCOMPLETENESS
1
$146,870
4
$56,555
9
$101,069
1
$26,060
0
$0
0
$0
Aggregated Statistics For Year 2006 (Based on 2 partial tracts)
A) FHA, FSA/RHS & VA Home Purchase Loans
B) Conventional Home Purchase Loans
C) Refinancings
D) Home Improvement Loans
F) Non-occupant Loans on < 5 Family Dwellings (A B C & D)
G) Loans On Manufactured Home Dwelling (A B C & D)
Number
Average Value
Number
Average Value
Number
Average Value
Number
Average Value
Number
Average Value
Number
Average Value
LOANS ORIGINATED
136
$125,433
120
$82,039
120
$114,916
40
$28,041
24
$75,505
20
$77,696
APPLICATIONS APPROVED, NOT ACCEPTED
4
$91,200
18
$77,381
17
$112,239
11
$25,626
2
$91,200
6
$36,518
APPLICATIONS DENIED
8
$100,970
34
$87,576
99
$106,883
32
$30,905
6
$94,950
13
$104,501
APPLICATIONS WITHDRAWN
8
$117,848
20
$94,574
99
$98,114
8
$61,292
9
$75,539
4
$68,102
FILES CLOSED FOR INCOMPLETENESS
0
$0
6
$95,937
20
$101,503
1
$568,510
0
$0
1
$171,740
Aggregated Statistics For Year 2005 (Based on 2 partial tracts)
A) FHA, FSA/RHS & VA Home Purchase Loans
B) Conventional Home Purchase Loans
C) Refinancings
D) Home Improvement Loans
F) Non-occupant Loans on < 5 Family Dwellings (A B C & D)
G) Loans On Manufactured Home Dwelling (A B C & D)
Number
Average Value
Number
Average Value
Number
Average Value
Number
Average Value
Number
Average Value
Number
Average Value
LOANS ORIGINATED
127
$112,649
102
$80,667
133
$91,769
27
$28,952
25
$55,714
17
$56,224
APPLICATIONS APPROVED, NOT ACCEPTED
5
$93,330
23
$76,162
19
$98,118
8
$44,268
2
$65,735
1
$76,990
APPLICATIONS DENIED
14
$83,923
47
$81,018
136
$109,287
50
$30,084
9
$96,068
25
$58,272
APPLICATIONS WITHDRAWN
6
$127,125
8
$124,954
109
$103,412
7
$128,423
5
$78,644
1
$101,860
FILES CLOSED FOR INCOMPLETENESS
6
$85,475
1
$62,770
18
$99,818
0
$0
0
$0
2
$83,500
Aggregated Statistics For Year 2004 (Based on 2 partial tracts)
A) FHA, FSA/RHS & VA Home Purchase Loans
B) Conventional Home Purchase Loans
C) Refinancings
D) Home Improvement Loans
F) Non-occupant Loans on < 5 Family Dwellings (A B C & D)
G) Loans On Manufactured Home Dwelling (A B C & D)
Number
Average Value
Number
Average Value
Number
Average Value
Number
Average Value
Number
Average Value
Number
Average Value
LOANS ORIGINATED
153
$104,645
97
$86,425
214
$88,979
28
$15,186
36
$67,577
18
$72,709
APPLICATIONS APPROVED, NOT ACCEPTED
5
$94,752
17
$77,752
43
$93,072
9
$13,687
4
$67,215
7
$73,094
APPLICATIONS DENIED
6
$119,032
38
$66,202
140
$89,964
34
$30,376
11
$54,698
11
$51,037
APPLICATIONS WITHDRAWN
6
$116,663
17
$79,215
96
$107,336
7
$37,563
4
$63,070
5
$93,094
FILES CLOSED FOR INCOMPLETENESS
0
$0
6
$120,413
14
$102,704
5
$34,348
1
$116,070
0
$0
Aggregated Statistics For Year 2003 (Based on 2 partial tracts)
A) FHA, FSA/RHS & VA Home Purchase Loans
B) Conventional Home Purchase Loans
C) Refinancings
D) Home Improvement Loans
F) Non-occupant Loans on < 5 Family Dwellings (A B C & D)
Number
Average Value
Number
Average Value
Number
Average Value
Number
Average Value
Number
Average Value
LOANS ORIGINATED
99
$103,234
45
$78,644
383
$89,875
24
$17,470
30
$67,590
APPLICATIONS APPROVED, NOT ACCEPTED
1
$85,280
7
$100,674
39
$97,607
2
$26,055
2
$95,345
APPLICATIONS DENIED
8
$84,832
27
$78,258
168
$96,846
24
$18,062
7
$67,849
APPLICATIONS WITHDRAWN
5
$78,408
6
$64,155
85
$98,807
0
$0
0
$0
FILES CLOSED FOR INCOMPLETENESS
2
$133,835
4
$71,952
19
$78,295
0
$0
2
$91,790
Aggregated Statistics For Year 2002 (Based on 2 partial tracts)
A) FHA, FSA/RHS & VA Home Purchase Loans
B) Conventional Home Purchase Loans
C) Refinancings
D) Home Improvement Loans
F) Non-occupant Loans on < 5 Family Dwellings (A B C & D)
Number
Average Value
Number
Average Value
Number
Average Value
Number
Average Value
Number
Average Value
LOANS ORIGINATED
101
$100,510
54
$80,846
238
$84,640
14
$16,920
24
$59,467
APPLICATIONS APPROVED, NOT ACCEPTED
0
$0
9
$61,852
50
$84,637
0
$0
2
$73,435
APPLICATIONS DENIED
13
$75,255
43
$50,489
137
$84,084
18
$21,714
5
$42,164
APPLICATIONS WITHDRAWN
6
$124,362
11
$84,415
78
$77,791
2
$63,365
2
$76,395
FILES CLOSED FOR INCOMPLETENESS
5
$76,750
0
$0
20
$97,417
1
$36,720
2
$78,170
Aggregated Statistics For Year 2001 (Based on 2 partial tracts)
A) FHA, FSA/RHS & VA Home Purchase Loans
B) Conventional Home Purchase Loans
C) Refinancings
D) Home Improvement Loans
F) Non-occupant Loans on < 5 Family Dwellings (A B C & D)
Number
Average Value
Number
Average Value
Number
Average Value
Number
Average Value
Number
Average Value
LOANS ORIGINATED
129
$96,276
44
$70,095
237
$84,637
31
$15,053
18
$53,364
APPLICATIONS APPROVED, NOT ACCEPTED
0
$0
21
$52,283
34
$93,568
9
$13,950
6
$62,773
APPLICATIONS DENIED
4
$71,952
58
$57,260
134
$67,502
25
$20,230
6
$72,248
APPLICATIONS WITHDRAWN
6
$101,463
6
$120,612
75
$80,381
4
$22,800
0
$0
FILES CLOSED FOR INCOMPLETENESS
0
$0
1
$127,920
27
$88,260
0
$0
0
$0
Aggregated Statistics For Year 2000 (Based on 2 partial tracts)
A) FHA, FSA/RHS & VA Home Purchase Loans
B) Conventional Home Purchase Loans
C) Refinancings
D) Home Improvement Loans
F) Non-occupant Loans on < 5 Family Dwellings (A B C & D)
Number
Average Value
Number
Average Value
Number
Average Value
Number
Average Value
Number
Average Value
LOANS ORIGINATED
115
$92,239
44
$77,470
81
$59,703
30
$20,016
9
$49,877
APPLICATIONS APPROVED, NOT ACCEPTED
4
$100,970
12
$43,428
24
$75,259
15
$26,847
6
$82,908
APPLICATIONS DENIED
8
$71,509
34
$51,417
105
$67,048
21
$21,376
2
$98,305
APPLICATIONS WITHDRAWN
4
$101,858
6
$65,142
65
$54,683
7
$27,410
2
$69,285
FILES CLOSED FOR INCOMPLETENESS
1
$92,380
1
$54,480
7
$67,680
1
$35,530
0
$0
Aggregated Statistics For Year 1999 (Based on 1 partial tract)
A) FHA, FSA/RHS & VA Home Purchase Loans
B) Conventional Home Purchase Loans
C) Refinancings
D) Home Improvement Loans
E) Loans on Dwellings For 5+ Families
F) Non-occupant Loans on < 5 Family Dwellings (A B C & D)
Detailed PMIC statistics for the following Tracts:1015.00
2002 - 2018 National Fire Incident Reporting System (NFIRS) incidents
Based on the data from the years 2002 - 2018 the average number of fires per year is 34. The highest number of reported fires - 46 took place in 2006, and the least - 20 in 2003. The data has a decreasing trend.
When looking into fire subcategories, the most incidents belonged to: Outside Fires (47.4%), and Structure Fires (20.9%).
Fire incident types reported to NFIRS in Zip Code 37191


 Nearest zip codes: 37142, 37079, 37042, 42223, 37050, 37052.


 Based on the data from the years 2002 - 2018 the average number of fires per year is 34. The highest number of reported fires - 46 took place in 2006, and the least - 20 in 2003. The data has a decreasing trend.
 When looking into fire subcategories, the most incidents belonged to: Outside Fires (47.4%), and Structure Fires (20.9%).