Estimated zip code population in 2022: 5,335 Zip code population in 2010: 3,730 Zip code population in 2000: 2,503
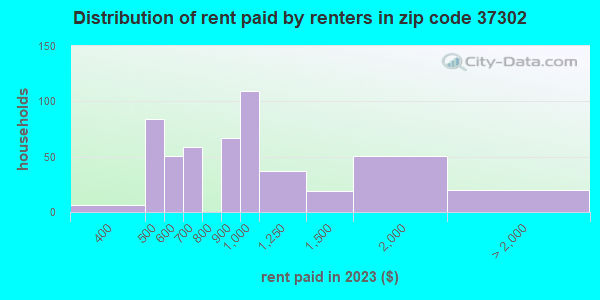
Houses and condos: 2,144 Renter-occupied apartments: 575
% of renters here:
28%
State:
33%
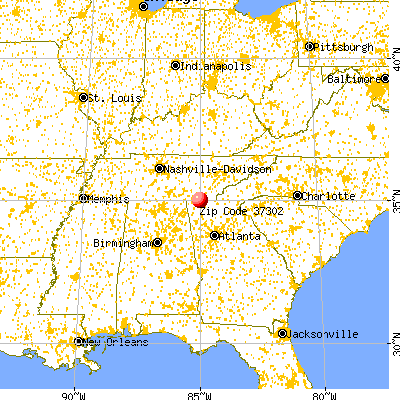
March 2022 cost of living index in zip code 37302: 81.9 (low, U.S. average is 100)
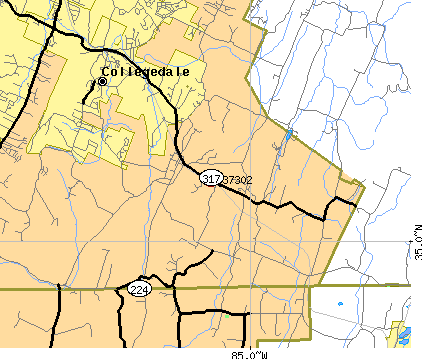
Land area: 16.4 sq. mi. Water area: 0.0 sq. mi.
Population density: 325 people per square mile
(very low).
OSM Map
General Map
Google Map
MSN Map
OSM Map
General Map
Google Map
MSN Map
OSM Map
General Map
Google Map
MSN Map
OSM Map
General Map
Google Map
MSN Map
Please wait while loading the map...
Real estate property taxes paid for housing units in 2022:
This zip code:
0.5% ($1,983)
Tennessee:
0.5% ($1,376)
Median real estate property taxes paid for housing units with mortgages in 2022: $1,784 (0.4%) Median real estate property taxes paid for housing units with no mortgage in 2022: $2,458 (0.8%)
Business Search- 14 Million verified businesses
Males: 2,482
(46.5%)
Females: 2,853
(53.5%)
For population 25 years and over in 37302:
High school or higher: 93.8%
Bachelor's degree or higher: 38.9%
Graduate or professional degree: 12.1%
Unemployed: 1.1%
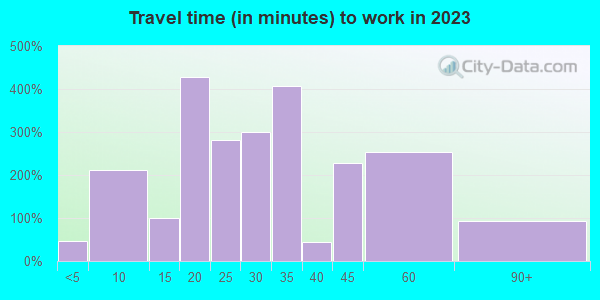
Mean travel time to work (commute): 26.2 minutes
For population 15 years and over in 37302:
Never married: 22.4%
Now married: 65.6%
Separated: 0.0%
Widowed: 3.3%
Divorced: 8.8%
Zip code 37302 compared to state average:
Median house value above state average.
Unemployed percentage significantly below state average.
Black race population percentage significantly below state average.
Hispanic race population percentage below state average.
Median age above state average.
Length of stay since moving in significantly below state average.
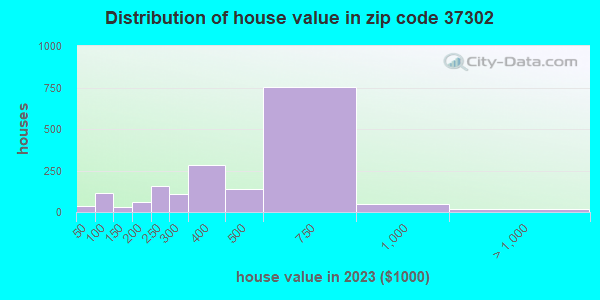
Estimated median house/condo value in 2022: $437,814
37302:
$437,814
Tennessee:
$284,800
According to our research of Tennessee and other state lists, there were 5 registered sex offenders living in 37302 zip code as of May 28, 2024. The ratio of all residents to sex offenders in zip code 37302 is 781 to 1. The ratio of registered sex offenders to all residents in this zip code is lower than the state average.
Median resident age:
This zip code:
44.8 years
Tennessee median age:
39.2 years
Average household size:
This zip code:
2.6 people
Tennessee:
2.4 people
Averages for the 2020 tax year for zip code 37302, filed in 2021:
Average Adjusted Gross Income (AGI) in 2020: $104,084 (Individual Income Tax Returns)
Here:
$104,084
State:
$69,014
Salary/wage: $84,503 (reported on 83.3% of returns)
Here:
$84,503
State:
$55,872
(% of AGI for various income ranges: 1254.5% for AGIs below $25k, 3478.8% for AGIs $25k-50k, 7040.5% for AGIs $50k-75k, 8872.9% for AGIs $75k-100k, 17438.6% for AGIs $100k-200k, 58413.3% for AGIs over 200k)
Taxable interest for individuals: $1,618 (reported on 34.8% of returns)
This zip code:
$1,618
Tennessee:
$1,945
(% of AGI for various income ranges: 23.2% for AGIs below $25k, 39.1% for AGIs $25k-50k, 47.4% for AGIs $50k-75k, 33.5% for AGIs $75k-100k, 75.8% for AGIs $100k-200k, 716.7% for AGIs over 200k)
Ordinary dividends: $5,428 (reported on 20.3% of returns)
Here:
$5,428
State:
$8,105
(% of AGI for various income ranges: 51.6% for AGIs below $25k, 41.9% for AGIs $25k-50k, 98.4% for AGIs $50k-75k, 64.7% for AGIs $75k-100k, 121.4% for AGIs $100k-200k, 1592.2% for AGIs over 200k)
Net capital gain/loss in AGI: +$23,659 (reported on 20.3% of returns)
Here:
+$23,659
State:
+$33,664
(% of AGI for various income ranges: 0.3% for AGIs below $25k, 22.8% for AGIs $25k-50k, 74.7% for AGIs $50k-75k, 124.1% for AGIs $75k-100k, 446.1% for AGIs $100k-200k, 9833.3% for AGIs over 200k)
Profit/loss from business: +$24,680 (reported on 20.3% of returns)
Here:
+$24,680
State:
+$18,991
(% of AGI for various income ranges: 218.9% for AGIs below $25k, 176.6% for AGIs $25k-50k, 356.3% for AGIs $50k-75k, 475.3% for AGIs $75k-100k, 916.9% for AGIs $100k-200k, 5744.4% for AGIs over 200k)
Taxable individual retirement arrangement distribution: $20,453 (reported on 8.4% of returns)
37302:
$20,453
Tennessee:
$20,036
(% of AGI for various income ranges: 53.2% for AGIs below $25k, 91.9% for AGIs $25k-50k, 195.3% for AGIs $50k-75k, 271.8% for AGIs $75k-100k, 378.3% for AGIs $100k-200k, 1327.8% for AGIs over 200k)
Self-employed (Keogh) retirement plans: $20,000 (reported on 0.9% of returns)
37302:
$20,000
Tennessee:
$28,955
(% of AGI for various income ranges: 111.1% for AGIs $100k-200k)
Total itemized deductions: $44,278 (reported on 11.9% of returns)
Here:
$44,278
State:
$40,136
(% of AGI for various income ranges: 283.8% for AGIs $25k-50k, 397.4% for AGIs $50k-75k, 380.6% for AGIs $75k-100k, 826.7% for AGIs $100k-200k, 7410.0% for AGIs over 200k)
Charity contributions: $29,038 (reported on 10.6% of returns)
Here:
$29,038
State:
$19,852
(% of AGI for various income ranges: 41.6% for AGIs below $25k, 180.5% for AGIs $50k-75k, 134.7% for AGIs $75k-100k, 428.3% for AGIs $100k-200k, 5218.9% for AGIs over 200k)
Taxes paid: $5,570 (reported on 11.9% of returns)
37302:
$5,570
State:
$6,038
(% of AGI for various income ranges: 24.5% for AGIs below $25k, 45.3% for AGIs $50k-75k, 58.2% for AGIs $75k-100k, 136.1% for AGIs $100k-200k, 817.8% for AGIs over 200k)
Earned income credit: $2,125 (reported on 10.6% of returns)
Here:
$2,125
State:
$2,391
(% of AGI for various income ranges: 87.1% for AGIs below $25k, 55.9% for AGIs $25k-50k)
Percentage of individuals using paid preparers for their 2020 taxes: 93.4%
Here:
93%
State:
93%
(% for various income ranges: 91.4% for AGIs below $25k, 94.9% for AGIs $25k-50k, 92.6% for AGIs $50k-75k, 91.7% for AGIs $75k-100k, 94.6% for AGIs $100k-200k, 95.7% for AGIs over 200k)
Averages for the 2012 tax year for zip code 37302, filed in 2013:
Average Adjusted Gross Income (AGI) in 2012: $76,490 (Individual Income Tax Returns)
Here:
$76,490
State:
$53,767
Salary/wage: $65,620 (reported on 84.2% of returns)
Here:
$65,620
State:
$45,421
(% of AGI for various income ranges: 76.5% for AGIs below $25k, 78.9% for AGIs $25k-50k, 76.2% for AGIs $50k-75k, 80.8% for AGIs $75k-100k, 80.2% for AGIs $100k-200k, 59.8% for AGIs over 200k)
Taxable interest for individuals: $1,758 (reported on 33.3% of returns)
This zip code:
$1,758
Tennessee:
$1,732
(% of AGI for various income ranges: 1.5% for AGIs below $25k, 0.8% for AGIs $25k-50k, 1.2% for AGIs $50k-75k, 0.3% for AGIs $75k-100k, 0.6% for AGIs $100k-200k, 0.8% for AGIs over 200k)
Ordinary dividends: $5,779 (reported on 17.6% of returns)
Here:
$5,779
State:
$6,739
(% of AGI for various income ranges: 0.5% for AGIs below $25k, 1.3% for AGIs $25k-50k, 1.2% for AGIs $50k-75k, 0.3% for AGIs $75k-100k, 0.8% for AGIs $100k-200k, 2.2% for AGIs over 200k)
Net capital gain/loss in AGI: +$10,191 (reported on 13.9% of returns)
Here:
+$10,191
State:
+$19,082
(% of AGI for various income ranges: 0.4% for AGIs $25k-50k, 0.7% for AGIs $100k-200k, 4.6% for AGIs over 200k)
Profit/loss from business: +$15,897 (reported on 20.0% of returns)
Here:
+$15,897
State:
+$15,240
(% of AGI for various income ranges: 8.4% for AGIs below $25k, 4.5% for AGIs $25k-50k, 3.6% for AGIs $50k-75k, 2.9% for AGIs $75k-100k, 5.5% for AGIs $100k-200k, 2.8% for AGIs over 200k)
Taxable individual retirement arrangement distribution: $14,000 (reported on 9.7% of returns)
37302:
$14,000
Tennessee:
$15,505
(% of AGI for various income ranges: 3.4% for AGIs below $25k, 2.1% for AGIs $25k-50k, 3.2% for AGIs $50k-75k, 3.6% for AGIs $100k-200k)
Total itemized deductions: $28,102 (18% of AGI, reported on 33.9% of returns)
Here:
$28,102
State:
$21,976
Here:
18.0% of AGI
State:
17.8% of AGI
(% of AGI for various income ranges: 10.4% for AGIs below $25k, 8.6% for AGIs $25k-50k, 13.0% for AGIs $50k-75k, 13.3% for AGIs $75k-100k, 14.5% for AGIs $100k-200k, 11.7% for AGIs over 200k)
Charity contributions: $11,761 (reported on 29.7% of returns)
Here:
$11,761
State:
$6,709
(% of AGI for various income ranges: 1.1% for AGIs below $25k, 2.5% for AGIs $25k-50k, 3.0% for AGIs $50k-75k, 4.1% for AGIs $75k-100k, 4.0% for AGIs $100k-200k, 6.7% for AGIs over 200k)
Taxes paid: $5,416 (reported on 33.9% of returns)
37302:
$5,416
State:
$4,829
(% of AGI for various income ranges: 1.3% for AGIs below $25k, 1.4% for AGIs $25k-50k, 2.2% for AGIs $50k-75k, 2.6% for AGIs $75k-100k, 3.4% for AGIs $100k-200k, 2.0% for AGIs over 200k)
Earned income credit: $2,070 (reported on 13.9% of returns)
Here:
$2,070
State:
$2,404
(% of AGI for various income ranges: 5.1% for AGIs below $25k, 1.1% for AGIs $25k-50k)
Percentage of individuals using paid preparers for their 2012 taxes: 47.9%
Here:
48%
State:
52%
(% for various income ranges: 40.0% for AGIs below $25k, 50.0% for AGIs $25k-50k, 56.5% for AGIs $50k-75k, 46.7% for AGIs $75k-100k, 48.1% for AGIs $100k-200k, 75.0% for AGIs over 200k)
Averages for the 2004 tax year for zip code 37302, filed in 2005:
Average Adjusted Gross Income (AGI) in 2004: $49,526 (Individual Income Tax Returns)
Here:
$49,526
State:
$44,088
Salary/wage: $46,391 (reported on 85.6% of returns)
Here:
$46,391
State:
$38,825
(% of AGI for various income ranges: 124.5% for AGIs below $10k, 74.2% for AGIs $10k-25k, 82.6% for AGIs $25k-50k, 80.6% for AGIs $50k-75k, 89.0% for AGIs $75k-100k, 75.6% for AGIs over 100k)
Taxable interest for individuals: $1,641 (reported on 43.8% of returns)
This zip code:
$1,641
Tennessee:
$1,802
(% of AGI for various income ranges: 6.9% for AGIs below $10k, 2.1% for AGIs $10k-25k, 1.7% for AGIs $25k-50k, 1.1% for AGIs $50k-75k, 0.6% for AGIs $75k-100k, 1.4% for AGIs over 100k)
Taxable dividends: $1,468 (reported on 17.4% of returns)
Here:
$1,468
State:
$3,727
(% of AGI for various income ranges: 2.4% for AGIs below $10k, 0.8% for AGIs $10k-25k, 0.6% for AGIs $25k-50k, 0.4% for AGIs $50k-75k, 0.4% for AGIs $75k-100k, 0.4% for AGIs over 100k)
Net capital gain/loss: +$7,059 (reported on 14.4% of returns)
Here:
+$7,059
State:
+$15,776
(% of AGI for various income ranges: -1.7% for AGIs below $10k, 0.0% for AGIs $10k-25k, 0.6% for AGIs $25k-50k, 1.5% for AGIs $50k-75k, 0.0% for AGIs $75k-100k, 4.2% for AGIs over 100k)
Profit/loss from business: +$9,806 (reported on 19.7% of returns)
Here:
+$9,806
State:
+$12,882
(% of AGI for various income ranges: 10.8% for AGIs below $10k, 8.5% for AGIs $10k-25k, 3.1% for AGIs $25k-50k, 5.6% for AGIs $50k-75k, 1.0% for AGIs $75k-100k, 3.3% for AGIs over 100k)
IRA payment deduction: $3,400 (reported on 1.7% of returns)
37302:
$3,400
Tennessee:
$2,934
Total itemized deductions: $20,600 (22% of AGI, reported on 33.1% of returns)
Here:
$20,600
State:
$18,035
Here:
22.2% of AGI
State:
19.9% of AGI
(% of AGI for various income ranges: 10.6% for AGIs $10k-25k, 10.7% for AGIs $25k-50k, 16.1% for AGIs $50k-75k, 20.1% for AGIs $75k-100k, 13.2% for AGIs over 100k)
Charity contributions deductions: $7,551 (8% of AGI, reported on 29.7% of returns)
Here:
$7,551
State:
$5,167
Here:
7.8% of AGI
State:
5.3% of AGI
(% of AGI for various income ranges: 1.8% for AGIs $10k-25k, 2.6% for AGIs $25k-50k, 3.9% for AGIs $50k-75k, 7.0% for AGIs $75k-100k, 5.6% for AGIs over 100k)
Total tax: $7,677 (reported on 77.7% of returns)
37302:
$7,677
State:
$7,482
(% of AGI for various income ranges: 3.9% for AGIs below $10k, 4.8% for AGIs $10k-25k, 6.1% for AGIs $25k-50k, 8.4% for AGIs $50k-75k, 9.1% for AGIs $75k-100k, 19.0% for AGIs over 100k)
Earned income credit: $1,486 (reported on 12.2% of returns)
Here:
$1,486
State:
$1,826
Percentage of individuals using paid preparers for their 2004 taxes: 55.6%
Here:
56%
State:
60%
(% for various income ranges: 47.1% for AGIs below $10k, 58.4% for AGIs $10k-25k, 59.9% for AGIs $25k-50k, 58.3% for AGIs $50k-75k, 46.0% for AGIs $75k-100k, 57.3% for AGIs over 100k)
Household received Food Stamps/SNAP in the past 12 months: 240 Household did not receive Food Stamps/SNAP in the past 12 months: 1,799
Women who had a birth in the past 12 months: 31 (32 now married, 0 unmarried) Women who did not have a birth in the past 12 months: 1,295 (763 now married, 532 unmarried)
Housing units in zip code 37302 with a mortgage: 1,025 (131 second mortgage, 118 both second mortgage and home equity loan) Houses without a mortgage: 35
Median monthly owner costs for units with a mortgage: $2,202 Median monthly owner costs for units without a mortgage: $525
Residents with income below the poverty level in 2022:
This zip code:
15.1%
Whole state:
13.3%
Residents with income below 50% of the poverty level in 2022:
This zip code:
1.3%
Whole state:
7.1%
Median number of rooms in houses and condos:
Here:
8.0
State:
6.5
Median number of rooms in apartments:
Here:
4.8
State:
4.4
Notable locations in this zip code not listed on our city pages
Churches in zip code 37302 include: Swishers Chapel (A), Wesleyann Church (B), Apison Church (C), Community Church (D). Display/hide their locations on the map
Size of family households: 799 2-persons, 508 3-persons, 270 4-persons, 112 5-persons, 23 6-persons, 20 7-or-more-persons
Size of nonfamily households: 239 1-person, 69 2-persons
891 married couples with children.
113 single-parent households (15 men, 98 women).
93.6% of residents of 37302 zip code speak English at home.
1.1% of residents speak Spanish at home (16% very well, 11% well, 73% not well).
2.6% of residents speak other Indo-European language at home (100% very well).
2.3% of residents speak Asian or Pacific Island language at home (47% very well, 38% well, 15% not well).
Foreign born population: 220 (4.1%) (58.1% of them are naturalized citizens)
This zip code:
4.1%
Whole state:
5.6%
20%Japan
18%Honduras
14%Bhutan
10%Laos
10%Serbia
6%France
5%West Indies
28%American
20%English
9%German
6%Scottish
6%European
5%Irish
2%Scotch-Irish
Year of entry for the foreign-born population
442010 or later
762000 to 2009
751990 to 1999
37Before 1990
Facilities with environmental interests located in this zip code:
APISON ELEMENTARY SCHOOL (10433 EAST BRAINERD RD in APISON, TN)
(Geographic Names Information System) (National Center for Education Statistics) - STATE ID-0013 Organizations: HAMILTON COUNTY SCHOOL DISTRCT (SCHOOL DISTRICT)
CHATTANOOGA MARBLE CO (PO BOX 1 in APISON, TN)
(Resource Conservation and Recovery Act (tracking hazardous waste))
COOKE MFG COMPANY INC (KING EDWARD AVE in APISON, TN)
(Resource Conservation and Recovery Act (tracking hazardous waste)) Business NAICS classification: NONUPHOLSTERED WOOD HOUSEHOLD FURNITURE MANUFACTURING.
Housing units lacking complete plumbing facilities: 2.2% Housing units lacking complete kitchen facilities: 2.4%
72.0%Electricity
23.9%Utility gas
3.1%Bottled, tank, or LP gas
0.6%Fuel oil, kerosene, etc.
0.6%Other fuel
Population in 1990: 1,614. Population change in the 1990s: +889 (+55.1%).
Place of birth for U.S.-born residents:
This state: 2,713
Northeast: 439
Midwest: 433
South: 1,016
West: 536
60% of the 37302 zip code residents lived in the same house 5 years ago. Out of people who lived in different houses, 67% lived in this county. Out of people who lived in different counties, 50% lived in Tennessee.
93% of the 37302 zip code residents lived in the same house 1 year ago. Out of people who lived in different houses, 6% moved from this county. Out of people who lived in different houses, 107% moved from different state.
Private vs. public school enrollment:
Students in private schools in grades 1 to 8 (elementary and middle school): 109
Here:
20.3%
Tennessee:
15.0%
Students in private schools in grades 9 to 12 (high school): 49
Here:
31.1%
Tennessee:
16.2%
Students in private undergraduate colleges: 60
Here:
15.2%
Tennessee:
23.5%
Occupation by median earnings in the past 12 months ($)
119,062Management occupations
105,851Computer and mathematical occupations
89,346Business and financial operations occupations
83,683Personal care and service occupations
79,217Health diagnosing and treating practitioners and other technical occupations
72,600Arts, design, entertainment, sports, and media occupations
Top industries in this zip code by the number of employees in 2005:
Health Care and Social Assistance: Ambulance Services (20-49 employees: 1 establishment)
Other Services (except Public Administration): Religious Organizations (5-9: 2, 1-4: 2)
Construction: Electrical Contractors (10-19: 1)
Administrative and Support and Waste Management and Remediation Services: Landscaping Services (5-9: 1, 1-4: 1)
Construction: Land Subdivision (5-9: 1, 1-4: 1)
Construction: Water and Sewer Line and Related Structures Construction (5-9: 1)
Educational Services: Flight Training (5-9: 1)
Accommodation and Food Services: Full-Service Restaurants (5-9: 1)
Other Services (except Public Administration): Business Associations (1-4: 2)
Home Mortgage Disclosure Act Aggregated Statistics For Year 2009 (Based on 2 partial tracts)
A) FHA, FSA/RHS & VA Home Purchase Loans
B) Conventional Home Purchase Loans
C) Refinancings
D) Home Improvement Loans
F) Non-occupant Loans on < 5 Family Dwellings (A B C & D)
G) Loans On Manufactured Home Dwelling (A B C & D)
Number
Average Value
Number
Average Value
Number
Average Value
Number
Average Value
Number
Average Value
Number
Average Value
LOANS ORIGINATED
23
$188,566
56
$249,510
208
$200,430
5
$90,924
12
$187,414
2
$60,850
APPLICATIONS APPROVED, NOT ACCEPTED
0
$0
5
$154,692
17
$203,941
3
$9,723
2
$175,510
2
$10,560
APPLICATIONS DENIED
3
$103,933
3
$128,743
49
$187,366
9
$22,128
7
$168,543
7
$62,503
APPLICATIONS WITHDRAWN
4
$123,712
13
$211,450
47
$212,609
1
$325,880
1
$130,750
2
$93,035
FILES CLOSED FOR INCOMPLETENESS
2
$122,710
2
$277,100
19
$182,897
0
$0
0
$0
0
$0
Aggregated Statistics For Year 2008 (Based on 2 partial tracts)
A) FHA, FSA/RHS & VA Home Purchase Loans
B) Conventional Home Purchase Loans
C) Refinancings
D) Home Improvement Loans
E) Loans on Dwellings For 5+ Families
F) Non-occupant Loans on < 5 Family Dwellings (A B C & D)
G) Loans On Manufactured Home Dwelling (A B C & D)
Number
Average Value
Number
Average Value
Number
Average Value
Number
Average Value
Number
Average Value
Number
Average Value
Number
Average Value
LOANS ORIGINATED
22
$204,817
93
$220,822
126
$203,667
11
$53,033
1
$148,860
25
$221,356
2
$56,325
APPLICATIONS APPROVED, NOT ACCEPTED
2
$249,440
9
$277,266
21
$206,141
2
$20,115
0
$0
1
$179,030
1
$108,630
APPLICATIONS DENIED
2
$252,960
19
$208,942
70
$195,959
9
$77,000
0
$0
7
$137,363
0
$0
APPLICATIONS WITHDRAWN
5
$134,978
18
$175,847
29
$198,698
1
$22,130
0
$0
6
$95,887
0
$0
FILES CLOSED FOR INCOMPLETENESS
1
$213,230
4
$186,072
9
$239,157
1
$32,190
0
$0
0
$0
0
$0
Aggregated Statistics For Year 2007 (Based on 2 partial tracts)
A) FHA, FSA/RHS & VA Home Purchase Loans
B) Conventional Home Purchase Loans
C) Refinancings
D) Home Improvement Loans
F) Non-occupant Loans on < 5 Family Dwellings (A B C & D)
G) Loans On Manufactured Home Dwelling (A B C & D)
Number
Average Value
Number
Average Value
Number
Average Value
Number
Average Value
Number
Average Value
Number
Average Value
LOANS ORIGINATED
4
$149,362
143
$191,440
116
$173,032
20
$51,798
29
$178,616
5
$44,858
APPLICATIONS APPROVED, NOT ACCEPTED
0
$0
21
$182,002
20
$183,659
2
$88,010
3
$111,643
1
$37,210
APPLICATIONS DENIED
3
$239,380
26
$187,930
76
$166,142
16
$105,169
7
$144,404
1
$70,410
APPLICATIONS WITHDRAWN
0
$0
13
$225,918
35
$215,069
1
$2,010
0
$0
0
$0
FILES CLOSED FOR INCOMPLETENESS
1
$292,690
5
$81,068
17
$226,778
0
$0
1
$82,480
0
$0
Aggregated Statistics For Year 2006 (Based on 2 partial tracts)
A) FHA, FSA/RHS & VA Home Purchase Loans
B) Conventional Home Purchase Loans
C) Refinancings
D) Home Improvement Loans
E) Loans on Dwellings For 5+ Families
F) Non-occupant Loans on < 5 Family Dwellings (A B C & D)
G) Loans On Manufactured Home Dwelling (A B C & D)
Number
Average Value
Number
Average Value
Number
Average Value
Number
Average Value
Number
Average Value
Number
Average Value
Number
Average Value
LOANS ORIGINATED
12
$128,742
203
$161,612
151
$160,941
12
$68,981
1
$114,660
26
$120,618
12
$69,819
APPLICATIONS APPROVED, NOT ACCEPTED
1
$157,910
17
$128,446
27
$158,581
3
$39,560
0
$0
9
$110,079
5
$72,216
APPLICATIONS DENIED
0
$0
21
$143,446
73
$197,771
24
$75,561
0
$0
7
$145,554
10
$55,721
APPLICATIONS WITHDRAWN
0
$0
16
$172,369
71
$162,670
3
$83,817
0
$0
2
$223,790
4
$42,748
FILES CLOSED FOR INCOMPLETENESS
0
$0
4
$276,848
15
$135,045
0
$0
0
$0
0
$0
0
$0
Aggregated Statistics For Year 2005 (Based on 2 partial tracts)
A) FHA, FSA/RHS & VA Home Purchase Loans
B) Conventional Home Purchase Loans
C) Refinancings
D) Home Improvement Loans
E) Loans on Dwellings For 5+ Families
F) Non-occupant Loans on < 5 Family Dwellings (A B C & D)
G) Loans On Manufactured Home Dwelling (A B C & D)
Number
Average Value
Number
Average Value
Number
Average Value
Number
Average Value
Number
Average Value
Number
Average Value
Number
Average Value
LOANS ORIGINATED
7
$128,024
180
$159,498
166
$154,039
14
$72,202
1
$61,350
23
$142,168
8
$42,244
APPLICATIONS APPROVED, NOT ACCEPTED
2
$90,520
19
$128,901
36
$126,144
2
$78,450
0
$0
4
$149,362
8
$78,704
APPLICATIONS DENIED
1
$122,710
28
$150,367
98
$126,023
11
$43,249
0
$0
12
$159,252
17
$44,551
APPLICATIONS WITHDRAWN
0
$0
16
$189,845
72
$143,606
4
$218,258
0
$0
4
$140,058
2
$190,600
FILES CLOSED FOR INCOMPLETENESS
0
$0
8
$131,885
10
$166,158
1
$25,150
0
$0
3
$107,620
0
$0
Aggregated Statistics For Year 2004 (Based on 2 partial tracts)
A) FHA, FSA/RHS & VA Home Purchase Loans
B) Conventional Home Purchase Loans
C) Refinancings
D) Home Improvement Loans
F) Non-occupant Loans on < 5 Family Dwellings (A B C & D)
G) Loans On Manufactured Home Dwelling (A B C & D)
Number
Average Value
Number
Average Value
Number
Average Value
Number
Average Value
Number
Average Value
Number
Average Value
LOANS ORIGINATED
6
$152,043
150
$166,192
170
$163,939
24
$46,938
25
$174,084
15
$139,337
APPLICATIONS APPROVED, NOT ACCEPTED
0
$0
24
$135,992
30
$118,114
4
$13,328
4
$135,028
11
$48,004
APPLICATIONS DENIED
4
$81,720
27
$99,760
107
$117,350
24
$23,007
6
$114,493
26
$53,888
APPLICATIONS WITHDRAWN
0
$0
16
$144,521
90
$156,089
2
$44,255
4
$126,982
6
$69,735
FILES CLOSED FOR INCOMPLETENESS
1
$72,420
4
$172,745
5
$180,642
0
$0
0
$0
0
$0
Aggregated Statistics For Year 2003 (Based on 2 partial tracts)
A) FHA, FSA/RHS & VA Home Purchase Loans
B) Conventional Home Purchase Loans
C) Refinancings
D) Home Improvement Loans
E) Loans on Dwellings For 5+ Families
F) Non-occupant Loans on < 5 Family Dwellings (A B C & D)
Number
Average Value
Number
Average Value
Number
Average Value
Number
Average Value
Number
Average Value
Number
Average Value
LOANS ORIGINATED
10
$126,630
138
$153,625
341
$147,033
12
$19,697
1
$151,880
18
$98,066
APPLICATIONS APPROVED, NOT ACCEPTED
0
$0
19
$96,981
49
$126,895
3
$12,403
0
$0
0
$0
APPLICATIONS DENIED
1
$139,810
30
$100,949
99
$101,952
22
$22,539
0
$0
2
$31,685
APPLICATIONS WITHDRAWN
0
$0
10
$117,880
54
$133,064
3
$62,693
0
$0
1
$111,640
FILES CLOSED FOR INCOMPLETENESS
0
$0
4
$146,595
16
$114,472
1
$50,290
0
$0
2
$88,010
Aggregated Statistics For Year 1999 (Based on 1 partial tract)
A) FHA, FSA/RHS & VA Home Purchase Loans
B) Conventional Home Purchase Loans
C) Refinancings
D) Home Improvement Loans
F) Non-occupant Loans on < 5 Family Dwellings (A B C & D)
Detailed PMIC statistics for the following Tracts:0112.02
2003 - 2018 National Fire Incident Reporting System (NFIRS) incidents
According to the data from the years 2003 - 2018 the average number of fires per year is 16. The highest number of reported fire incidents - 30 took place in 2011, and the least - 11 in 2005. The data has a declining trend.
When looking into fire subcategories, the most reports belonged to: Outside Fires (59.7%), and Structure Fires (26.5%).
Fire incident types reported to NFIRS in Zip Code 37302


 Nearest zip codes: 37315, 37353, 37363, 30756, 30710, 30726.


 According to the data from the years 2003 - 2018 the average number of fires per year is 16. The highest number of reported fire incidents - 30 took place in 2011, and the least - 11 in 2005. The data has a declining trend.
 When looking into fire subcategories, the most reports belonged to: Outside Fires (59.7%), and Structure Fires (26.5%).