Estimated zip code population in 2022: 4,082 Zip code population in 2010: 4,135 Zip code population in 2000: 3,565
Houses and condos: 1,775 Renter-occupied apartments: 283
% of renters here:
18%
State:
33%
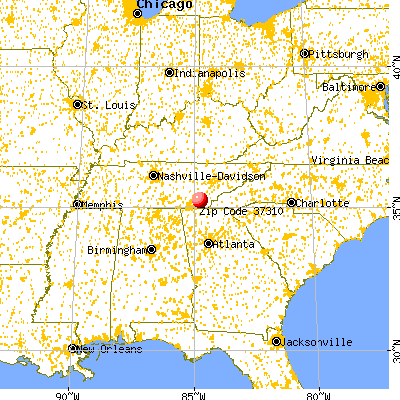
March 2022 cost of living index in zip code 37310: 79.5 (low, U.S. average is 100)
Land area: 42.2 sq. mi. Water area: 1.8 sq. mi.
Population density: 97 people per square mile
(very low).
OSM Map
General Map
Google Map
MSN Map
OSM Map
General Map
Google Map
MSN Map
OSM Map
General Map
Google Map
MSN Map
OSM Map
General Map
Google Map
MSN Map
Please wait while loading the map...
Real estate property taxes paid for housing units in 2022:
This zip code:
0.4% ($1,018)
Tennessee:
0.5% ($1,376)
Median real estate property taxes paid for housing units with mortgages in 2022: $1,103 (0.4%) Median real estate property taxes paid for housing units with no mortgage in 2022: $850 (0.3%)
Estimated median house/condo value in 2022: $260,013
37310:
$260,013
Tennessee:
$284,800
According to our research of Tennessee and other state lists, there were 11 registered sex offenders living in 37310 zip code as of May 29, 2024. The ratio of all residents to sex offenders in zip code 37310 is 434 to 1. The ratio of registered sex offenders to all residents in this zip code is lower than the state average.
Median resident age:
This zip code:
50.6 years
Tennessee median age:
39.2 years
Average household size:
This zip code:
2.6 people
Tennessee:
2.4 people
Averages for the 2020 tax year for zip code 37310, filed in 2021:
Average Adjusted Gross Income (AGI) in 2020: $62,225 (Individual Income Tax Returns)
Here:
$62,225
State:
$69,014
Salary/wage: $54,420 (reported on 78.5% of returns)
Here:
$54,420
State:
$55,872
(% of AGI for various income ranges: 1054.7% for AGIs below $25k, 3524.9% for AGIs $25k-50k, 6027.9% for AGIs $50k-75k, 8122.7% for AGIs $75k-100k, 16230.6% for AGIs $100k-200k, 39170.0% for AGIs over 200k)
Taxable interest for individuals: $1,188 (reported on 28.7% of returns)
This zip code:
$1,188
Tennessee:
$1,945
(% of AGI for various income ranges: 11.3% for AGIs below $25k, 11.8% for AGIs $25k-50k, 28.7% for AGIs $50k-75k, 52.7% for AGIs $75k-100k, 158.8% for AGIs $100k-200k, 472.5% for AGIs over 200k)
Ordinary dividends: $3,475 (reported on 13.4% of returns)
Here:
$3,475
State:
$8,105
(% of AGI for various income ranges: 10.0% for AGIs below $25k, 32.8% for AGIs $25k-50k, 18.3% for AGIs $50k-75k, 40.0% for AGIs $75k-100k, 158.2% for AGIs $100k-200k, 1047.5% for AGIs over 200k)
Net capital gain/loss in AGI: +$18,993 (reported on 12.9% of returns)
Here:
+$18,993
State:
+$33,664
(% of AGI for various income ranges: 2.3% for AGIs below $25k, 13.6% for AGIs $25k-50k, 87.9% for AGIs $50k-75k, 34.7% for AGIs $75k-100k, 514.7% for AGIs $100k-200k, 9812.5% for AGIs over 200k)
Profit/loss from business: +$17,235 (reported on 16.3% of returns)
Here:
+$17,235
State:
+$18,991
(% of AGI for various income ranges: 153.6% for AGIs below $25k, 192.6% for AGIs $25k-50k, 327.1% for AGIs $50k-75k, 172.7% for AGIs $75k-100k, 590.6% for AGIs $100k-200k, 5617.5% for AGIs over 200k)
Taxable individual retirement arrangement distribution: $21,220 (reported on 9.6% of returns)
37310:
$21,220
Tennessee:
$20,036
(% of AGI for various income ranges: 35.8% for AGIs below $25k, 96.9% for AGIs $25k-50k, 250.4% for AGIs $50k-75k, 362.0% for AGIs $75k-100k, 731.2% for AGIs $100k-200k, 3222.5% for AGIs over 200k)
Total itemized deductions: $38,600 (reported on 5.3% of returns)
Here:
$38,600
State:
$40,136
(% of AGI for various income ranges: 309.0% for AGIs $25k-50k, 588.8% for AGIs $100k-200k, 5100.0% for AGIs over 200k)
Charity contributions: $23,038 (reported on 3.8% of returns)
Here:
$23,038
State:
$19,852
(% of AGI for various income ranges: 36.7% for AGIs $25k-50k, 261.8% for AGIs $100k-200k, 3137.5% for AGIs over 200k)
Taxes paid: $4,830 (reported on 4.8% of returns)
37310:
$4,830
State:
$6,038
(% of AGI for various income ranges: 35.9% for AGIs $25k-50k, 76.5% for AGIs $100k-200k, 532.5% for AGIs over 200k)
Earned income credit: $2,200 (reported on 15.8% of returns)
Here:
$2,200
State:
$2,391
(% of AGI for various income ranges: 88.9% for AGIs below $25k, 65.4% for AGIs $25k-50k)
Percentage of individuals using paid preparers for their 2020 taxes: 93.8%
Here:
94%
State:
93%
(% for various income ranges: 92.8% for AGIs below $25k, 94.0% for AGIs $25k-50k, 96.9% for AGIs $50k-75k, 95.0% for AGIs $75k-100k, 92.9% for AGIs $100k-200k, 90.0% for AGIs over 200k)
Averages for the 2012 tax year for zip code 37310, filed in 2013:
Average Adjusted Gross Income (AGI) in 2012: $57,096 (Individual Income Tax Returns)
Here:
$57,096
State:
$53,767
Salary/wage: $52,845 (reported on 84.4% of returns)
Here:
$52,845
State:
$45,421
(% of AGI for various income ranges: 74.6% for AGIs below $25k, 75.7% for AGIs $25k-50k, 76.5% for AGIs $50k-75k, 81.8% for AGIs $75k-100k, 79.4% for AGIs $100k-200k, 77.9% for AGIs over 200k)
Taxable interest for individuals: $1,547 (reported on 28.6% of returns)
This zip code:
$1,547
Tennessee:
$1,732
(% of AGI for various income ranges: 1.4% for AGIs below $25k, 0.6% for AGIs $25k-50k, 0.4% for AGIs $50k-75k, 0.5% for AGIs $75k-100k, 1.1% for AGIs $100k-200k, 0.8% for AGIs over 200k)
Ordinary dividends: $2,408 (reported on 13.0% of returns)
Here:
$2,408
State:
$6,739
(% of AGI for various income ranges: 0.8% for AGIs below $25k, 0.3% for AGIs $25k-50k, 0.9% for AGIs $50k-75k, 0.2% for AGIs $75k-100k, 0.8% for AGIs $100k-200k, 0.4% for AGIs over 200k)
Net capital gain/loss in AGI: +$5,957 (reported on 7.3% of returns)
Here:
+$5,957
State:
+$19,082
(% of AGI for various income ranges: 1.4% for AGIs $100k-200k, 1.7% for AGIs over 200k)
Profit/loss from business: +$13,355 (reported on 15.1% of returns)
Here:
+$13,355
State:
+$15,240
(% of AGI for various income ranges: 8.8% for AGIs below $25k, 3.6% for AGIs $25k-50k, 2.6% for AGIs $50k-75k, 2.7% for AGIs $75k-100k, 6.3% for AGIs $100k-200k)
Taxable individual retirement arrangement distribution: $14,265 (reported on 8.9% of returns)
37310:
$14,265
Tennessee:
$15,505
(% of AGI for various income ranges: 2.1% for AGIs below $25k, 3.3% for AGIs $25k-50k, 2.4% for AGIs $50k-75k, 1.7% for AGIs $75k-100k, 4.1% for AGIs $100k-200k)
Total itemized deductions: $18,956 (16% of AGI, reported on 21.4% of returns)
Here:
$18,956
State:
$21,976
Here:
16.4% of AGI
State:
17.8% of AGI
(% of AGI for various income ranges: 3.9% for AGIs below $25k, 6.6% for AGIs $25k-50k, 7.3% for AGIs $50k-75k, 8.6% for AGIs $75k-100k, 10.5% for AGIs $100k-200k, 4.1% for AGIs over 200k)
Charity contributions: $6,216 (reported on 16.1% of returns)
Here:
$6,216
State:
$6,709
(% of AGI for various income ranges: 1.6% for AGIs $25k-50k, 1.2% for AGIs $50k-75k, 2.1% for AGIs $75k-100k, 2.9% for AGIs $100k-200k, 1.5% for AGIs over 200k)
Taxes paid: $3,969 (reported on 20.3% of returns)
37310:
$3,969
State:
$4,829
(% of AGI for various income ranges: 0.5% for AGIs below $25k, 1.1% for AGIs $25k-50k, 1.3% for AGIs $50k-75k, 1.8% for AGIs $75k-100k, 2.1% for AGIs $100k-200k, 1.1% for AGIs over 200k)
Earned income credit: $2,100 (reported on 20.8% of returns)
Here:
$2,100
State:
$2,404
(% of AGI for various income ranges: 6.9% for AGIs below $25k, 1.2% for AGIs $25k-50k)
Percentage of individuals using paid preparers for their 2012 taxes: 60.4%
Here:
60%
State:
52%
(% for various income ranges: 55.8% for AGIs below $25k, 55.8% for AGIs $25k-50k, 60.0% for AGIs $50k-75k, 65.0% for AGIs $75k-100k, 73.7% for AGIs $100k-200k, 87.5% for AGIs over 200k)
Averages for the 2004 tax year for zip code 37310, filed in 2005:
Average Adjusted Gross Income (AGI) in 2004: $40,818 (Individual Income Tax Returns)
Here:
$40,818
State:
$44,088
Salary/wage: $39,360 (reported on 86.8% of returns)
Here:
$39,360
State:
$38,825
(% of AGI for various income ranges: 164.4% for AGIs below $10k, 78.8% for AGIs $10k-25k, 84.6% for AGIs $25k-50k, 87.2% for AGIs $50k-75k, 85.2% for AGIs $75k-100k, 76.8% for AGIs over 100k)
Taxable interest for individuals: $1,389 (reported on 37.8% of returns)
This zip code:
$1,389
Tennessee:
$1,802
(% of AGI for various income ranges: 13.1% for AGIs below $10k, 2.1% for AGIs $10k-25k, 1.0% for AGIs $25k-50k, 0.5% for AGIs $50k-75k, 1.4% for AGIs $75k-100k, 1.2% for AGIs over 100k)
Taxable dividends: $1,337 (reported on 14.1% of returns)
Here:
$1,337
State:
$3,727
(% of AGI for various income ranges: 2.6% for AGIs below $10k, 0.2% for AGIs $10k-25k, 0.4% for AGIs $25k-50k, 0.4% for AGIs $50k-75k, 0.4% for AGIs $75k-100k, 0.6% for AGIs over 100k)
Net capital gain/loss: +$4,750 (reported on 10.9% of returns)
Here:
+$4,750
State:
+$15,776
(% of AGI for various income ranges: 1.0% for AGIs below $10k, 0.5% for AGIs $10k-25k, -0.1% for AGIs $25k-50k, -0.1% for AGIs $50k-75k, 1.5% for AGIs $75k-100k, 3.8% for AGIs over 100k)
Profit/loss from business: +$7,554 (reported on 17.4% of returns)
Here:
+$7,554
State:
+$12,882
(% of AGI for various income ranges: 15.6% for AGIs below $10k, 5.5% for AGIs $10k-25k, 4.0% for AGIs $25k-50k, 2.3% for AGIs $50k-75k, 0.9% for AGIs $75k-100k, 3.1% for AGIs over 100k)
IRA payment deduction: $2,500 (reported on 2.2% of returns)
37310:
$2,500
Tennessee:
$2,934
Total itemized deductions: $16,386 (21% of AGI, reported on 23.9% of returns)
Here:
$16,386
State:
$18,035
Here:
21.3% of AGI
State:
19.9% of AGI
(% of AGI for various income ranges: 6.6% for AGIs $10k-25k, 9.0% for AGIs $25k-50k, 10.5% for AGIs $50k-75k, 10.4% for AGIs $75k-100k, 10.6% for AGIs over 100k)
Charity contributions deductions: $5,364 (7% of AGI, reported on 19.3% of returns)
Here:
$5,364
State:
$5,167
Here:
6.5% of AGI
State:
5.3% of AGI
(% of AGI for various income ranges: 0.9% for AGIs $10k-25k, 1.3% for AGIs $25k-50k, 2.1% for AGIs $50k-75k, 3.0% for AGIs $75k-100k, 4.6% for AGIs over 100k)
Total tax: $5,475 (reported on 77.4% of returns)
37310:
$5,475
State:
$7,482
(% of AGI for various income ranges: 5.9% for AGIs below $10k, 4.3% for AGIs $10k-25k, 6.6% for AGIs $25k-50k, 8.7% for AGIs $50k-75k, 10.5% for AGIs $75k-100k, 18.0% for AGIs over 100k)
Earned income credit: $1,853 (reported on 18.3% of returns)
Here:
$1,853
State:
$1,826
Percentage of individuals using paid preparers for their 2004 taxes: 65.5%
Here:
65%
State:
60%
(% for various income ranges: 60.6% for AGIs below $10k, 65.2% for AGIs $10k-25k, 65.5% for AGIs $25k-50k, 69.1% for AGIs $50k-75k, 69.8% for AGIs $75k-100k, 66.7% for AGIs over 100k)
Likely homosexual households (counted as self-reported same-sex unmarried-partner households)
Lesbian couples: 0.0% of all households
Gay men: 2.4% of all households
Household received Food Stamps/SNAP in the past 12 months: 198 Household did not receive Food Stamps/SNAP in the past 12 months: 1,388
Women who had a birth in the past 12 months: 56 (57 now married, 0 unmarried) Women who did not have a birth in the past 12 months: 677 (388 now married, 288 unmarried)
Housing units in zip code 37310 with a mortgage: 690 (36 second mortgage, 36 both second mortgage and home equity loan) Houses without a mortgage: 23
Median monthly owner costs for units with a mortgage: $1,219 Median monthly owner costs for units without a mortgage: $383
Residents with income below the poverty level in 2022:
This zip code:
10.6%
Whole state:
13.3%
Residents with income below 50% of the poverty level in 2022:
This zip code:
5.6%
Whole state:
7.1%
Median number of rooms in houses and condos:
Here:
6.1
State:
6.5
Median number of rooms in apartments:
Here:
4.8
State:
4.4
Notable locations in this zip code not listed on our city pages
Notable locations in zip code 37310: Cleveland Utilities Sewage Treatment Plant (A), B and B Marina (B), Bradley County Fire and Rescue Station 6 (C), Bradley County Fire and Rescue Station 9 (D), Bradley County Fire and Rescue Station 7 (E), Charleston City Hall (F). Display/hide their locations on the map
Churches in zip code 37310 include: Charleston Church of God (A), Charleston Cumberland Presbyterian Church (B), Union Grove Church (C), Council Baptist Church (D), Mount Hermon Church (E), Center Point Baptist Church (F), Candies Creek Baptist Church (G). Display/hide their locations on the map
Cemeteries: Maddux Cemetery (1), Union Grove Cemetery (2), Purselley Cemetery (3), Council Cemetery (4), Renslow Cemetery (5), Murphy Cemetery (6), McBrien-Burdett Cemetery (7). Display/hide their locations on the map
Streams, rivers, and creeks: Little Chatata Creek (A), South Chestuee Creek (B), Bacon Branch (C), Parker Branch (D), Greasy Creek (E), Beaverdam Branch (F), Candies Creek (G), Monk Branch (H), Rattlesnake Branch (I). Display/hide their locations on the map
Size of family households: 661 2-persons, 192 3-persons, 213 4-persons, 74 5-persons, 13 6-persons, 46 7-or-more-persons
Size of nonfamily households: 321 1-person, 65 2-persons
332 married couples with children.
212 single-parent households (152 men, 60 women).
97.4% of residents of 37310 zip code speak English at home.
2.4% of residents speak Spanish at home (31% very well, 30% well, 39% not well).
0.1% of residents speak Asian or Pacific Island language at home (100% very well).
Foreign born population: 69 (1.7%) (9.0% of them are naturalized citizens)
This zip code:
1.7%
Whole state:
5.6%
82%Honduras
3%El Salvador
30%American
18%Irish
17%German
17%English
2%British
1%French
1%Italian
Year of entry for the foreign-born population
22010 or later
292000 to 2009
351990 to 1999
3Before 1990
Facilities with environmental interests located in this zip code:
ARCH CHEMICALS INCORPORATED (1200 LOWER RIVER ROAD in CHARLESTON, TN)
AIR MAJOR (AIRS/AFS) - ICIS-, ENFORCEMENT/COMPLIANCE ACTIVITY CRITERIA AND HAZARDOUS AIR POLLUTANT INVENTORY (Inventory of air pollution sources) Large Quantity Generators, more that 1000 kg of hazardous waste/month (Resource Conservation and Recovery Act (tracking hazardous waste)) TRI REPORTER (Tracking of toxic chemicals releasing facilities) Business SIC classification: ALKALIES AND CHLORINE; INDUSTRIAL INORGANIC CHEMICALS Business NAICS classification: ALL OTHER BASIC INORGANIC CHEMICAL MANUFACTURING. Organizations: THOMAS C. REESE (CONTACT/OPERATOR)
, ARCH CHEMICALS, INC. (CONTACT/OWNER)
CHARLESTON ELEMENTARY SCHOOL (P O BOX 435 in CHARLESTON, TN)
(National Center for Education Statistics) - STATE ID-0030 Organizations: BRADLEY COUNTY SCHOOL DISTRICT (SCHOOL DISTRICT)
AIR-GLASS INDUSTRIES INC (LOWER RIVER ROAD in CHARLESTON, TN)
(Resource Conservation and Recovery Act (tracking hazardous waste))
CLEVELAND UTILITIES STP (1860 OLD LOWER RIVER ROAD NW in CHARLESTON, TN)
National Pollutant Discharge Elimination System MAJOR (Tracking pollutant discharge elimination systems) - permit Business SIC classification: SEWERAGE SYSTEMS Organizations: CLEVELAND WWTP (CONTACT/OPERATOR)
, FRED A . MURPHY (CONTACT/OWNER)
Alternative names: CLEVELAND UTILITIES WASTEWATER TREATMENT PLANT
(Resource Conservation and Recovery Act (tracking hazardous waste))
Housing units lacking complete plumbing facilities: 1.9% Housing units lacking complete kitchen facilities: 1.9%
90.5%Electricity
5.4%Bottled, tank, or LP gas
2.6%Utility gas
1.4%Fuel oil, kerosene, etc.
Population in 1990: 1,921. Population change in the 1990s: +1,644 (+85.6%).
Place of birth for U.S.-born residents:
This state: 2,718
Northeast: 261
Midwest: 245
South: 653
West: 115
58% of the 37310 zip code residents lived in the same house 5 years ago. Out of people who lived in different houses, 56% lived in this county. Out of people who lived in different counties, 50% lived in Tennessee.
89% of the 37310 zip code residents lived in the same house 1 year ago. Out of people who lived in different houses, 51% moved from this county. Out of people who lived in different houses, 33% moved from different county within same state. Out of people who lived in different houses, 14% moved from different state.
Private vs. public school enrollment:
Students in private schools in grades 1 to 8 (elementary and middle school): 19
Here:
5.8%
Tennessee:
15.0%
Students in private schools in grades 9 to 12 (high school): 19
Here:
11.4%
Tennessee:
16.2%
Students in private undergraduate colleges:
Here:
0.0%
Tennessee:
23.5%
Occupation by median earnings in the past 12 months ($)
90,952Management occupations
78,272Installation, maintenance, and repair occupations
67,740Health technologists and technicians
57,674Transportation occupations
46,203Construction and extraction occupations
42,603Production occupations
Top industries in this zip code by the number of employees in 2005:
Construction: Highway, Street, and Bridge Construction (100-249 employees: 1 establishment, 1-4 employees: 1 establishment)
Other Services (except Public Administration): Religious Organizations (10-19: 2, 5-9: 1, 1-4: 3)
Wholesale Trade: Beer and Ale Merchant Wholesalers (20-49: 1)
Construction: All Other Specialty Trade Contractors (20-49: 1)
Accommodation and Food Services: Limited-Service Restaurants (20-49: 1)
Fatal accident statistics in 2013:
Fatal accident count: 1
Vehicles involved in fatal accidents: 1
Fatal accidents caused by drunken drivers: 1
Fatalities: 1
Persons involved in fatal accidents: 1
Pedestrians involved in fatal accidents: 0
Fatal accident statistics in 2012:
Fatal accident count: 1
Vehicles involved in fatal accidents: 3
Fatal accidents caused by drunken drivers: 0
Fatalities: 2
Persons involved in fatal accidents: 2
Pedestrians involved in fatal accidents: 1
Home Mortgage Disclosure Act Aggregated Statistics For Year 2009 (Based on 10 partial tracts)
A) FHA, FSA/RHS & VA Home Purchase Loans
B) Conventional Home Purchase Loans
C) Refinancings
D) Home Improvement Loans
F) Non-occupant Loans on < 5 Family Dwellings (A B C & D)
G) Loans On Manufactured Home Dwelling (A B C & D)
Number
Average Value
Number
Average Value
Number
Average Value
Number
Average Value
Number
Average Value
Number
Average Value
LOANS ORIGINATED
89
$129,456
69
$169,980
381
$150,106
32
$61,961
50
$175,047
12
$56,374
APPLICATIONS APPROVED, NOT ACCEPTED
1
$118,420
2
$132,805
27
$143,973
2
$56,235
1
$33,380
2
$49,265
APPLICATIONS DENIED
16
$129,179
12
$112,935
105
$147,494
17
$43,367
6
$120,263
6
$57,630
APPLICATIONS WITHDRAWN
11
$122,855
9
$155,139
75
$148,680
3
$53,123
1
$79,360
4
$56,040
FILES CLOSED FOR INCOMPLETENESS
5
$138,102
1
$106,620
20
$149,197
5
$69,248
1
$21,010
1
$6,530
Aggregated Statistics For Year 2008 (Based on 10 partial tracts)
A) FHA, FSA/RHS & VA Home Purchase Loans
B) Conventional Home Purchase Loans
C) Refinancings
D) Home Improvement Loans
E) Loans on Dwellings For 5+ Families
F) Non-occupant Loans on < 5 Family Dwellings (A B C & D)
G) Loans On Manufactured Home Dwelling (A B C & D)
Number
Average Value
Number
Average Value
Number
Average Value
Number
Average Value
Number
Average Value
Number
Average Value
Number
Average Value
LOANS ORIGINATED
89
$136,374
104
$155,799
240
$154,016
25
$68,124
1
$919,640
59
$176,170
16
$65,081
APPLICATIONS APPROVED, NOT ACCEPTED
2
$148,620
7
$171,424
28
$122,775
3
$19,763
0
$0
1
$350,830
1
$49,900
APPLICATIONS DENIED
11
$117,182
19
$106,056
184
$134,270
28
$53,827
0
$0
9
$162,389
21
$51,634
APPLICATIONS WITHDRAWN
5
$138,734
13
$174,117
65
$141,012
4
$94,470
0
$0
3
$103,033
2
$93,005
FILES CLOSED FOR INCOMPLETENESS
2
$89,020
3
$108,663
27
$115,838
0
$0
0
$0
2
$125,105
1
$38,860
Aggregated Statistics For Year 2007 (Based on 10 partial tracts)
A) FHA, FSA/RHS & VA Home Purchase Loans
B) Conventional Home Purchase Loans
C) Refinancings
D) Home Improvement Loans
F) Non-occupant Loans on < 5 Family Dwellings (A B C & D)
G) Loans On Manufactured Home Dwelling (A B C & D)
Number
Average Value
Number
Average Value
Number
Average Value
Number
Average Value
Number
Average Value
Number
Average Value
LOANS ORIGINATED
53
$121,952
205
$134,754
334
$125,241
37
$57,879
68
$117,518
24
$61,288
APPLICATIONS APPROVED, NOT ACCEPTED
0
$0
11
$143,105
50
$124,519
8
$54,186
1
$232,850
3
$50,980
APPLICATIONS DENIED
9
$129,932
40
$101,225
251
$129,965
47
$68,970
13
$101,062
20
$77,401
APPLICATIONS WITHDRAWN
5
$96,626
15
$110,433
82
$129,407
5
$112,070
4
$107,490
2
$74,780
FILES CLOSED FOR INCOMPLETENESS
1
$33,610
4
$141,892
37
$150,136
2
$94,535
1
$234,000
1
$33,610
Aggregated Statistics For Year 2006 (Based on 10 partial tracts)
A) FHA, FSA/RHS & VA Home Purchase Loans
B) Conventional Home Purchase Loans
C) Refinancings
D) Home Improvement Loans
E) Loans on Dwellings For 5+ Families
F) Non-occupant Loans on < 5 Family Dwellings (A B C & D)
G) Loans On Manufactured Home Dwelling (A B C & D)
Number
Average Value
Number
Average Value
Number
Average Value
Number
Average Value
Number
Average Value
Number
Average Value
Number
Average Value
LOANS ORIGINATED
51
$127,730
320
$121,502
346
$122,217
46
$37,132
1
$344,560
91
$125,260
21
$63,495
APPLICATIONS APPROVED, NOT ACCEPTED
1
$85,510
35
$94,633
59
$97,507
5
$55,064
0
$0
11
$50,207
13
$54,742
APPLICATIONS DENIED
8
$102,326
76
$115,474
247
$112,511
38
$56,119
0
$0
33
$81,615
39
$58,791
APPLICATIONS WITHDRAWN
2
$131,200
24
$141,949
153
$122,344
8
$39,654
0
$0
7
$84,044
3
$69,543
FILES CLOSED FOR INCOMPLETENESS
0
$0
10
$116,618
38
$121,743
1
$66,720
0
$0
0
$0
0
$0
Aggregated Statistics For Year 2005 (Based on 10 partial tracts)
A) FHA, FSA/RHS & VA Home Purchase Loans
B) Conventional Home Purchase Loans
C) Refinancings
D) Home Improvement Loans
E) Loans on Dwellings For 5+ Families
F) Non-occupant Loans on < 5 Family Dwellings (A B C & D)
G) Loans On Manufactured Home Dwelling (A B C & D)
Number
Average Value
Number
Average Value
Number
Average Value
Number
Average Value
Number
Average Value
Number
Average Value
Number
Average Value
LOANS ORIGINATED
41
$112,054
318
$112,891
379
$110,856
38
$42,311
1
$580,260
67
$90,538
30
$53,173
APPLICATIONS APPROVED, NOT ACCEPTED
2
$79,080
51
$95,151
70
$102,693
4
$45,445
0
$0
3
$138,620
12
$49,327
APPLICATIONS DENIED
6
$121,327
64
$89,334
296
$102,101
45
$47,519
0
$0
18
$82,259
30
$56,764
APPLICATIONS WITHDRAWN
2
$130,810
33
$127,053
189
$129,213
11
$121,624
0
$0
13
$128,812
7
$61,593
FILES CLOSED FOR INCOMPLETENESS
0
$0
7
$125,123
30
$117,324
4
$61,415
0
$0
1
$172,790
0
$0
Aggregated Statistics For Year 2004 (Based on 10 partial tracts)
A) FHA, FSA/RHS & VA Home Purchase Loans
B) Conventional Home Purchase Loans
C) Refinancings
D) Home Improvement Loans
E) Loans on Dwellings For 5+ Families
F) Non-occupant Loans on < 5 Family Dwellings (A B C & D)
G) Loans On Manufactured Home Dwelling (A B C & D)
2002 - 2018 National Fire Incident Reporting System (NFIRS) incidents
According to the data from the years 2002 - 2018 the average number of fire incidents per year is 23. The highest number of fires - 73 took place in 2006, and the least - 2 in 2003. The data has an increasing trend.
When looking into fire subcategories, the most reports belonged to: Outside Fires (53.0%), and Structure Fires (25.6%).
Fire incident types reported to NFIRS in Zip Code 37310


 Nearest zip codes: 37309, 37307, 37361, 37325, 37370, 37323.


 According to the data from the years 2002 - 2018 the average number of fire incidents per year is 23. The highest number of fires - 73 took place in 2006, and the least - 2 in 2003. The data has an increasing trend.
 When looking into fire subcategories, the most reports belonged to: Outside Fires (53.0%), and Structure Fires (25.6%).