Estimated zip code population in 2022: 2,741 Zip code population in 2010: 2,778 Zip code population in 2000: 2,667
Houses and condos: 1,426 Renter-occupied apartments: 121
% of renters here:
10%
State:
33%
March 2022 cost of living index in zip code 37335: 77.7 (low, U.S. average is 100)
Land area: 46.8 sq. mi. Water area: 0.0 sq. mi.
Population density: 59 people per square mile
(very low).
OSM Map
General Map
Google Map
MSN Map
OSM Map
General Map
Google Map
MSN Map
OSM Map
General Map
Google Map
MSN Map
OSM Map
General Map
Google Map
MSN Map
Please wait while loading the map...
Real estate property taxes paid for housing units in 2022:
This zip code:
0.4% ($716)
Tennessee:
0.5% ($1,376)
Median real estate property taxes paid for housing units with mortgages in 2022: $653 (0.3%) Median real estate property taxes paid for housing units with no mortgage in 2022: $807 (0.4%)
Business Search- 14 Million verified businesses
Males: 1,419
(51.8%)
Females: 1,322
(48.2%)
For population 25 years and over in 37335:
High school or higher: 87.5%
Bachelor's degree or higher: 13.4%
Graduate or professional degree: 4.9%
Unemployed: 1.3%
Mean travel time to work (commute): 33.5 minutes
For population 15 years and over in 37335:
Never married: 14.2%
Now married: 57.1%
Separated: 0.5%
Widowed: 10.9%
Divorced: 17.3%
Zip code 37335 compared to state average:
Unemployed percentage below state average.
Black race population percentage significantly below state average.
Hispanic race population percentage below state average.
Median age above state average.
Foreign-born population percentage significantly below state average.
Renting percentage significantly below state average.
Length of stay since moving in significantly above state average.
Percentage of population with a bachelor's degree or higher below state average.
Estimated median house/condo value in 2022: $194,366
37335:
$194,366
Tennessee:
$284,800
According to our research of Tennessee and other state lists, there were 8 registered sex offenders living in 37335 zip code as of May 28, 2024. The ratio of all residents to sex offenders in zip code 37335 is 362 to 1. The ratio of registered sex offenders to all residents in this zip code is near the state average.
Median resident age:
This zip code:
46.8 years
Tennessee median age:
39.2 years
Average household size:
This zip code:
2.3 people
Tennessee:
2.4 people
Averages for the 2020 tax year for zip code 37335, filed in 2021:
Average Adjusted Gross Income (AGI) in 2020: $50,435 (Individual Income Tax Returns)
Here:
$50,435
State:
$69,014
Salary/wage: $46,108 (reported on 82.5% of returns)
Here:
$46,108
State:
$55,872
(% of AGI for various income ranges: 1060.0% for AGIs below $25k, 3315.8% for AGIs $25k-50k, 6606.4% for AGIs $50k-75k, 9831.2% for AGIs $75k-100k, 18237.8% for AGIs $100k-200k)
Taxable interest for individuals: $421 (reported on 27.5% of returns)
This zip code:
$421
Tennessee:
$1,945
(% of AGI for various income ranges: 12.7% for AGIs below $25k, 15.0% for AGIs $25k-50k, 15.0% for AGIs $50k-75k, 13.8% for AGIs $75k-100k, 28.9% for AGIs $100k-200k)
Ordinary dividends: $700 (reported on 7.5% of returns)
Here:
$700
State:
$8,105
(% of AGI for various income ranges: 11.2% for AGIs $25k-50k, 14.3% for AGIs $50k-75k, 15.6% for AGIs $100k-200k)
Net capital gain/loss in AGI: +$5,950 (reported on 8.3% of returns)
Here:
+$5,950
State:
+$33,664
(% of AGI for various income ranges: 3.9% for AGIs below $25k, 10.8% for AGIs $25k-50k, 121.4% for AGIs $50k-75k, 426.7% for AGIs $100k-200k)
Profit/loss from business: +$9,884 (reported on 15.8% of returns)
Here:
+$9,884
State:
+$18,991
(% of AGI for various income ranges: 203.6% for AGIs below $25k, 263.8% for AGIs $25k-50k, 205.7% for AGIs $50k-75k, 15.0% for AGIs $75k-100k, 244.4% for AGIs $100k-200k)
Taxable individual retirement arrangement distribution: $13,950 (reported on 6.7% of returns)
37335:
$13,950
Tennessee:
$20,036
(% of AGI for various income ranges: 36.7% for AGIs below $25k, 123.5% for AGIs $25k-50k, 481.4% for AGIs $50k-75k)
Earned income credit: $2,392 (reported on 20.0% of returns)
Here:
$2,392
State:
$2,391
(% of AGI for various income ranges: 116.1% for AGIs below $25k, 73.5% for AGIs $25k-50k)
Percentage of individuals using paid preparers for their 2020 taxes: 91.7%
Here:
92%
State:
93%
(% for various income ranges: 90.9% for AGIs below $25k, 90.6% for AGIs $25k-50k, 94.7% for AGIs $50k-75k, 90.9% for AGIs $75k-100k, 91.7% for AGIs $100k-200k, 100.0% for AGIs over 200k)
Averages for the 2012 tax year for zip code 37335, filed in 2013:
Average Adjusted Gross Income (AGI) in 2012: $41,424 (Individual Income Tax Returns)
Here:
$41,424
State:
$53,767
Salary/wage: $38,363 (reported on 86.0% of returns)
Here:
$38,363
State:
$45,421
(% of AGI for various income ranges: 76.7% for AGIs below $25k, 81.4% for AGIs $25k-50k, 80.6% for AGIs $50k-75k, 84.0% for AGIs $75k-100k, 76.1% for AGIs $100k-200k)
Taxable interest for individuals: $487 (reported on 28.0% of returns)
This zip code:
$487
Tennessee:
$1,732
(% of AGI for various income ranges: 0.9% for AGIs below $25k, 0.4% for AGIs $25k-50k, 0.3% for AGIs $50k-75k)
Ordinary dividends: $612 (reported on 7.5% of returns)
Here:
$612
State:
$6,739
(% of AGI for various income ranges: 0.2% for AGIs below $25k, 0.3% for AGIs $25k-50k)
Net capital gain/loss in AGI: +$1,775 (reported on 7.5% of returns)
Here:
+$1,775
State:
+$19,082
Profit/loss from business: +$6,747 (reported on 17.8% of returns)
Here:
+$6,747
State:
+$15,240
(% of AGI for various income ranges: 8.6% for AGIs below $25k, 2.6% for AGIs $25k-50k, 3.5% for AGIs $50k-75k, 2.2% for AGIs $75k-100k)
Taxable individual retirement arrangement distribution: $7,857 (reported on 6.5% of returns)
37335:
$7,857
Tennessee:
$15,505
Total itemized deductions: $17,135 (20% of AGI, reported on 15.9% of returns)
Here:
$17,135
State:
$21,976
Here:
20.3% of AGI
State:
17.8% of AGI
(% of AGI for various income ranges: 7.9% for AGIs $25k-50k, 5.8% for AGIs $50k-75k, 6.7% for AGIs $75k-100k, 9.5% for AGIs $100k-200k)
Charity contributions: $4,477 (reported on 12.1% of returns)
Here:
$4,477
State:
$6,709
(% of AGI for various income ranges: 1.8% for AGIs $25k-50k, 2.1% for AGIs $75k-100k, 2.1% for AGIs $100k-200k)
Taxes paid: $3,000 (reported on 15.9% of returns)
37335:
$3,000
State:
$4,829
(% of AGI for various income ranges: 1.0% for AGIs $25k-50k, 0.8% for AGIs $50k-75k, 1.3% for AGIs $75k-100k, 2.1% for AGIs $100k-200k)
Earned income credit: $2,117 (reported on 22.4% of returns)
Here:
$2,117
State:
$2,404
(% of AGI for various income ranges: 6.1% for AGIs below $25k, 1.2% for AGIs $25k-50k)
Percentage of individuals using paid preparers for their 2012 taxes: 60.7%
Here:
61%
State:
52%
(% for various income ranges: 55.3% for AGIs below $25k, 62.1% for AGIs $25k-50k, 66.7% for AGIs $50k-75k, 75.0% for AGIs $75k-100k, 62.5% for AGIs $100k-200k)
Averages for the 2004 tax year for zip code 37335, filed in 2005:
Average Adjusted Gross Income (AGI) in 2004: $31,908 (Individual Income Tax Returns)
Here:
$31,908
State:
$44,088
Salary/wage: $32,656 (reported on 87.0% of returns)
Here:
$32,656
State:
$38,825
(% of AGI for various income ranges: 124.1% for AGIs below $10k, 83.6% for AGIs $10k-25k, 88.0% for AGIs $25k-50k, 92.9% for AGIs $50k-75k, 95.2% for AGIs $75k-100k, 75.1% for AGIs over 100k)
Taxable interest for individuals: $779 (reported on 32.9% of returns)
This zip code:
$779
Tennessee:
$1,802
(% of AGI for various income ranges: 3.1% for AGIs below $10k, 1.0% for AGIs $10k-25k, 1.4% for AGIs $25k-50k, 0.3% for AGIs $50k-75k, 0.3% for AGIs $75k-100k, 0.2% for AGIs over 100k)
Taxable dividends: $284 (reported on 9.9% of returns)
Here:
$284
State:
$3,727
(% of AGI for various income ranges: 0.1% for AGIs $10k-25k, 0.1% for AGIs $25k-50k, 0.1% for AGIs $50k-75k, 0.0% for AGIs $75k-100k)
Net capital gain/loss: +$2,613 (reported on 10.3% of returns)
Here:
+$2,613
State:
+$15,776
(% of AGI for various income ranges: 3.3% for AGIs below $10k, 0.5% for AGIs $10k-25k, 1.1% for AGIs $25k-50k, 1.4% for AGIs $50k-75k, -0.3% for AGIs over 100k)
Profit/loss from business: +$5,665 (reported on 16.5% of returns)
Here:
+$5,665
State:
+$12,882
(% of AGI for various income ranges: 19.9% for AGIs below $10k, 8.0% for AGIs $10k-25k, 2.9% for AGIs $25k-50k, 1.3% for AGIs $50k-75k)
IRA payment deduction: $2,333 (reported on 1.5% of returns)
37335:
$2,333
Tennessee:
$2,934
Total itemized deductions: $13,852 (22% of AGI, reported on 14.4% of returns)
Here:
$13,852
State:
$18,035
Here:
22.4% of AGI
State:
19.9% of AGI
(% of AGI for various income ranges: 4.6% for AGIs $10k-25k, 4.2% for AGIs $25k-50k, 7.6% for AGIs $50k-75k, 8.4% for AGIs $75k-100k, 9.9% for AGIs over 100k)
Charity contributions deductions: $3,772 (6% of AGI, reported on 12.3% of returns)
Here:
$3,772
State:
$5,167
Here:
5.9% of AGI
State:
5.3% of AGI
(% of AGI for various income ranges: 0.8% for AGIs $10k-25k, 0.6% for AGIs $25k-50k, 1.8% for AGIs $50k-75k, 2.4% for AGIs $75k-100k, 3.1% for AGIs over 100k)
Total tax: $3,526 (reported on 73.6% of returns)
37335:
$3,526
State:
$7,482
(% of AGI for various income ranges: 5.7% for AGIs below $10k, 4.0% for AGIs $10k-25k, 6.1% for AGIs $25k-50k, 8.5% for AGIs $50k-75k, 10.2% for AGIs $75k-100k, 17.7% for AGIs over 100k)
Earned income credit: $1,744 (reported on 23.1% of returns)
Here:
$1,744
State:
$1,826
Percentage of individuals using paid preparers for their 2004 taxes: 67.5%
Here:
68%
State:
60%
(% for various income ranges: 60.1% for AGIs below $10k, 68.6% for AGIs $10k-25k, 71.9% for AGIs $25k-50k, 72.2% for AGIs $50k-75k, 61.8% for AGIs $75k-100k, 50.0% for AGIs over 100k)
Household received Food Stamps/SNAP in the past 12 months: 62 Household did not receive Food Stamps/SNAP in the past 12 months: 1,147
Women who did not have a birth in the past 12 months: 522 (327 now married, 195 unmarried)
Housing units in zip code 37335 with a mortgage: 486 (124 second mortgage, 126 both second mortgage and home equity loan) Median monthly owner costs for units with a mortgage: $1,158 Median monthly owner costs for units without a mortgage: $424
Residents with income below the poverty level in 2022:
This zip code:
3.6%
Whole state:
13.3%
Residents with income below 50% of the poverty level in 2022:
This zip code:
1.6%
Whole state:
7.1%
Median number of rooms in houses and condos:
Here:
6.0
State:
6.5
Median number of rooms in apartments:
Here:
4.1
State:
4.4
Notable locations in this zip code not listed on our city pages
Notable locations in zip code 37335: Seals Farm (A), Marty Farms (B), Underwood Farm (C), Drach Farm (D), Maddox Farm (E), Flintville Volunteer Fire Rescue (F), Vanntown Volunteer Fire and Rescue (G). Display/hide their locations on the map
Churches in zip code 37335 include: Stewart Chapel (A), Gum Springs Church (B), Pleasant Hill Church (C), Oak Grove Baptist Church (D), Flintville First Baptist Church (E). Display/hide their locations on the map
Cemeteries: Taylor Cemetery (1), Shady Grove Cemetery (2), Warren Cemetery (3), Wicks Cemetery (4), Simms Cemetery (5), Pleasant Hill Cemetery (6), Patterson Cemetery (7). Display/hide their locations on the map
Streams, rivers, and creeks: Gum Springs Branch (A), Trotters Branch (B), Cunningham Branch (C), Big Huckleberry Creek (D), Beans Creek (E), Mulepen Creek (F), Templeton Branch (G), Merrill Branch (H), Stiles Creek (I). Display/hide their locations on the map
Size of family households: 445 2-persons, 240 3-persons, 146 4-persons, 18 5-persons, 16 6-persons
Size of nonfamily households: 333 1-person
338 married couples with children.
147 single-parent households (35 men, 112 women).
99.9% of residents of 37335 zip code speak English at home.
Foreign born population: 0 (0.0%)
:
0.0%
Whole state:
5.6%
46%American
12%English
10%Irish
2%German
1%Italian
1%Polish
1%Scotch-Irish
Year of entry for the foreign-born population
02010 or later
02000 to 2009
221990 to 1999
13Before 1990
Facilities with environmental interests located in this zip code:
B & M CABINET & WOOD SHOP (PO BOX 346 in FLINTVILLE, TN)
(Resource Conservation and Recovery Act (tracking hazardous waste))
DECHE, INC. (HIGHWAY 275 in FLINTVILLE, TN)
AIR MINOR (AIRS/AFS) Business SIC classification: WOOD PALLETS AND SKIDS
Housing units lacking complete plumbing facilities: 10.8% Housing units lacking complete kitchen facilities: 7.2%
54.7%Electricity
28.5%Bottled, tank, or LP gas
8.6%Wood
7.2%Utility gas
1.4%No fuel used
Population in 1990: 6,020.
Place of birth for U.S.-born residents:
This state: 1,562
Northeast: 53
Midwest: 139
South: 879
West: 59
52% of the 37335 zip code residents lived in the same house 5 years ago. Out of people who lived in different houses, 61% lived in this county. Out of people who lived in different counties, 50% lived in Tennessee.
95% of the 37335 zip code residents lived in the same house 1 year ago. Out of people who lived in different houses, 66% moved from this county. Out of people who lived in different houses, 36% moved from different county within same state.
Private vs. public school enrollment:
Students in private schools in grades 1 to 8 (elementary and middle school): 23
Here:
7.4%
Tennessee:
15.0%
Students in private schools in grades 9 to 12 (high school):
Here:
0.0%
Tennessee:
16.2%
Students in private undergraduate colleges: 33
Here:
31.1%
Tennessee:
23.5%
Occupation by median earnings in the past 12 months ($)
90,249Management occupations
83,172Computer and mathematical occupations
68,440Production occupations
40,047Office and administrative support occupations
35,997Transportation occupations
35,500Health diagnosing and treating practitioners and other technical occupations
Top industries in this zip code by the number of employees in 2005:
Other Services (except Public Administration): Religious Organizations (5-9 employees: 1 establishment, 1-4 employees: 2 establishments)
Health Care and Social Assistance: Child Day Care Services (5-9: 1, 1-4: 1)
Construction: New Single-Family Housing Construction (except Operative Builders) (5-9: 1)
Other Services (except Public Administration): General Automotive Repair (5-9: 1)
Accommodation and Food Services: Full-Service Restaurants (1-4: 2)
Accommodation and Food Services: RV (Recreational Vehicle) Parks and Campgrounds (1-4: 1)
Health Care and Social Assistance: Offices of Physicians (except Mental Health Specialists) (1-4: 1)
Construction: Plumbing, Heating, and Air-Conditioning Contractors (1-4: 1)
Fatal accident statistics in 2014:
Fatal accident count: 1
Vehicles involved in fatal accidents: 1
Fatal accidents caused by drunken drivers: 0
Fatalities: 1
Persons involved in fatal accidents: 1
Pedestrians involved in fatal accidents: 0
Fatal accident statistics in 2013:
Fatal accident count: 1
Vehicles involved in fatal accidents: 2
Fatal accidents caused by drunken drivers: 1
Fatalities: 1
Persons involved in fatal accidents: 3
Pedestrians involved in fatal accidents: 0
2003 - 2018 National Fire Incident Reporting System (NFIRS) incidents
Based on the data from the years 2003 - 2018 the average number of fire incidents per year is 20. The highest number of fires - 34 took place in 2007, and the least - 6 in 2013. The data has a declining trend.
When looking into fire subcategories, the most reports belonged to: Outside Fires (49.1%), and Structure Fires (33.1%).
Fire incident types reported to NFIRS in Zip Code 37335

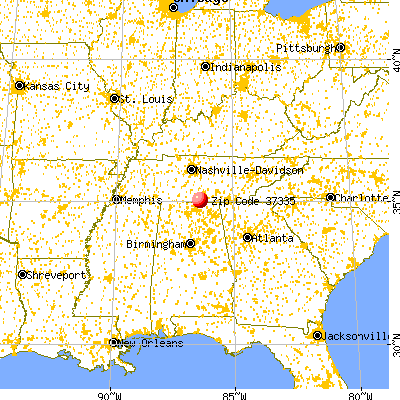


 Nearest zip codes: 37328, 37348, 37359, 35761, 37334, 37345.


 Based on the data from the years 2003 - 2018 the average number of fire incidents per year is 20. The highest number of fires - 34 took place in 2007, and the least - 6 in 2013. The data has a declining trend.
 When looking into fire subcategories, the most reports belonged to: Outside Fires (49.1%), and Structure Fires (33.1%).