Estimated zip code population in 2022: 4,041 Zip code population in 2010: 3,593 Zip code population in 2000: 3,080
Houses and condos: 1,670 Renter-occupied apartments: 294
% of renters here:
18%
State:
33%
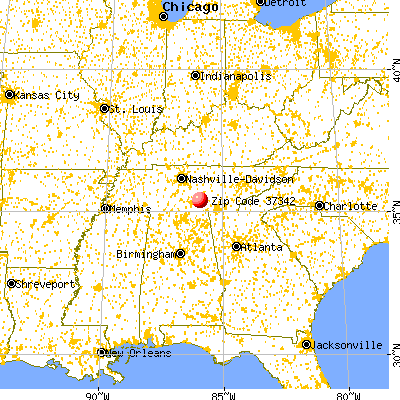
March 2022 cost of living index in zip code 37342: 79.4 (low, U.S. average is 100)
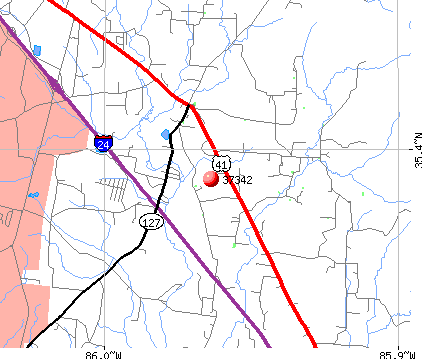
Land area: 77.1 sq. mi. Water area: 0.1 sq. mi.
Population density: 52 people per square mile
(very low).
OSM Map
General Map
Google Map
MSN Map
OSM Map
General Map
Google Map
MSN Map
OSM Map
General Map
Google Map
MSN Map
OSM Map
General Map
Google Map
MSN Map
Please wait while loading the map...
Real estate property taxes paid for housing units in 2022:
This zip code:
0.5% ($999)
Tennessee:
0.5% ($1,376)
Median real estate property taxes paid for housing units with mortgages in 2022: $991 (0.5%) Median real estate property taxes paid for housing units with no mortgage in 2022: $1,019 (0.4%)
Averages for the 2020 tax year for zip code 37342, filed in 2021:
Average Adjusted Gross Income (AGI) in 2020: $53,221 (Individual Income Tax Returns)
Here:
$53,221
State:
$69,014
Salary/wage: $44,261 (reported on 82.5% of returns)
Here:
$44,261
State:
$55,872
(% of AGI for various income ranges: 1075.3% for AGIs below $25k, 3210.8% for AGIs $25k-50k, 6079.5% for AGIs $50k-75k, 8956.4% for AGIs $75k-100k, 14110.8% for AGIs $100k-200k)
Taxable interest for individuals: $1,496 (reported on 28.8% of returns)
This zip code:
$1,496
Tennessee:
$1,945
(% of AGI for various income ranges: 16.7% for AGIs below $25k, 16.0% for AGIs $25k-50k, 11.6% for AGIs $50k-75k, 66.4% for AGIs $75k-100k, 136.7% for AGIs $100k-200k)
Ordinary dividends: $2,137 (reported on 10.7% of returns)
Here:
$2,137
State:
$8,105
(% of AGI for various income ranges: 5.1% for AGIs below $25k, 8.0% for AGIs $25k-50k, 13.7% for AGIs $50k-75k, 35.0% for AGIs $75k-100k, 228.3% for AGIs $100k-200k)
Net capital gain/loss in AGI: +$10,747 (reported on 10.7% of returns)
Here:
+$10,747
State:
+$33,664
(% of AGI for various income ranges: 9.8% for AGIs below $25k, 10.2% for AGIs $25k-50k, 93.7% for AGIs $50k-75k, 52.1% for AGIs $75k-100k, 1418.3% for AGIs $100k-200k)
Profit/loss from business: +$13,238 (reported on 16.4% of returns)
Here:
+$13,238
State:
+$18,991
(% of AGI for various income ranges: 130.6% for AGIs below $25k, 128.0% for AGIs $25k-50k, 381.1% for AGIs $50k-75k, 410.0% for AGIs $75k-100k, 1157.5% for AGIs $100k-200k)
Taxable individual retirement arrangement distribution: $14,393 (reported on 8.5% of returns)
37342:
$14,393
Tennessee:
$20,036
(% of AGI for various income ranges: 52.9% for AGIs below $25k, 123.8% for AGIs $25k-50k, 237.9% for AGIs $50k-75k, 794.2% for AGIs $100k-200k)
Total itemized deductions: $28,667 (reported on 1.7% of returns)
Here:
$28,667
State:
$40,136
(% of AGI for various income ranges: 452.6% for AGIs $50k-75k)
Charity contributions: $14,900 (reported on 1.1% of returns)
Here:
$14,900
State:
$19,852
(% of AGI for various income ranges: 74.5% for AGIs $25k-50k)
Taxes paid: $4,467 (reported on 1.7% of returns)
37342:
$4,467
State:
$6,038
(% of AGI for various income ranges: 70.5% for AGIs $50k-75k)
Earned income credit: $2,305 (reported on 21.5% of returns)
Here:
$2,305
State:
$2,391
(% of AGI for various income ranges: 108.6% for AGIs below $25k, 86.0% for AGIs $25k-50k)
Percentage of individuals using paid preparers for their 2020 taxes: 96.0%
Here:
96%
State:
93%
(% for various income ranges: 96.9% for AGIs below $25k, 95.7% for AGIs $25k-50k, 92.0% for AGIs $50k-75k, 100.0% for AGIs $75k-100k, 94.7% for AGIs $100k-200k, 100.0% for AGIs over 200k)
Averages for the 2012 tax year for zip code 37342, filed in 2013:
Average Adjusted Gross Income (AGI) in 2012: $40,591 (Individual Income Tax Returns)
Here:
$40,591
State:
$53,767
Salary/wage: $36,881 (reported on 83.0% of returns)
Here:
$36,881
State:
$45,421
(% of AGI for various income ranges: 74.3% for AGIs below $25k, 80.7% for AGIs $25k-50k, 82.8% for AGIs $50k-75k, 82.8% for AGIs $75k-100k, 56.4% for AGIs $100k-200k)
Taxable interest for individuals: $1,169 (reported on 32.0% of returns)
This zip code:
$1,169
Tennessee:
$1,732
(% of AGI for various income ranges: 1.4% for AGIs below $25k, 0.8% for AGIs $25k-50k, 0.2% for AGIs $50k-75k, 0.9% for AGIs $75k-100k, 1.5% for AGIs $100k-200k)
Ordinary dividends: $1,147 (reported on 11.1% of returns)
Here:
$1,147
State:
$6,739
(% of AGI for various income ranges: 0.4% for AGIs below $25k, 0.1% for AGIs $25k-50k, 0.3% for AGIs $50k-75k, 0.1% for AGIs $75k-100k, 0.7% for AGIs $100k-200k)
Net capital gain/loss in AGI: +$1,127 (reported on 9.8% of returns)
Here:
+$1,127
State:
+$19,082
(% of AGI for various income ranges: 0.3% for AGIs $25k-50k, 0.2% for AGIs $50k-75k, 0.8% for AGIs $100k-200k)
Profit/loss from business: +$11,944 (reported on 17.6% of returns)
Here:
+$11,944
State:
+$15,240
(% of AGI for various income ranges: 10.0% for AGIs below $25k, 3.2% for AGIs $25k-50k, 3.8% for AGIs $50k-75k, 3.3% for AGIs $75k-100k, 7.5% for AGIs $100k-200k)
Taxable individual retirement arrangement distribution: $15,238 (reported on 8.5% of returns)
37342:
$15,238
Tennessee:
$15,505
(% of AGI for various income ranges: 4.6% for AGIs below $25k, 2.9% for AGIs $25k-50k, 2.9% for AGIs $50k-75k, 6.5% for AGIs $75k-100k)
Total itemized deductions: $17,817 (25% of AGI, reported on 15.0% of returns)
Here:
$17,817
State:
$21,976
Here:
25.4% of AGI
State:
17.8% of AGI
(% of AGI for various income ranges: 5.2% for AGIs below $25k, 6.3% for AGIs $25k-50k, 6.1% for AGIs $50k-75k, 6.4% for AGIs $75k-100k, 8.4% for AGIs $100k-200k)
Charity contributions: $4,827 (reported on 9.8% of returns)
Here:
$4,827
State:
$6,709
(% of AGI for various income ranges: 0.8% for AGIs $25k-50k, 1.0% for AGIs $50k-75k, 1.4% for AGIs $75k-100k, 2.3% for AGIs $100k-200k)
Taxes paid: $2,996 (reported on 15.0% of returns)
37342:
$2,996
State:
$4,829
(% of AGI for various income ranges: 0.5% for AGIs below $25k, 1.0% for AGIs $25k-50k, 1.0% for AGIs $50k-75k, 1.3% for AGIs $75k-100k, 1.5% for AGIs $100k-200k)
Earned income credit: $2,292 (reported on 24.8% of returns)
Here:
$2,292
State:
$2,404
(% of AGI for various income ranges: 8.0% for AGIs below $25k, 1.4% for AGIs $25k-50k)
Percentage of individuals using paid preparers for their 2012 taxes: 64.1%
Here:
64%
State:
52%
(% for various income ranges: 62.7% for AGIs below $25k, 62.5% for AGIs $25k-50k, 63.6% for AGIs $50k-75k, 64.3% for AGIs $75k-100k, 80.0% for AGIs $100k-200k)
Averages for the 2004 tax year for zip code 37342, filed in 2005:
Average Adjusted Gross Income (AGI) in 2004: $33,401 (Individual Income Tax Returns)
Here:
$33,401
State:
$44,088
Salary/wage: $31,547 (reported on 86.3% of returns)
Here:
$31,547
State:
$38,825
(% of AGI for various income ranges: 133.7% for AGIs below $10k, 80.7% for AGIs $10k-25k, 85.2% for AGIs $25k-50k, 89.4% for AGIs $50k-75k, 84.7% for AGIs $75k-100k, 42.7% for AGIs over 100k)
Taxable interest for individuals: $1,302 (reported on 39.4% of returns)
This zip code:
$1,302
Tennessee:
$1,802
(% of AGI for various income ranges: 5.3% for AGIs below $10k, 2.5% for AGIs $10k-25k, 1.9% for AGIs $25k-50k, 0.5% for AGIs $50k-75k, 0.7% for AGIs $75k-100k, 2.3% for AGIs over 100k)
Taxable dividends: $959 (reported on 10.5% of returns)
Here:
$959
State:
$3,727
(% of AGI for various income ranges: 0.2% for AGIs below $10k, 0.1% for AGIs $10k-25k, 0.3% for AGIs $25k-50k, 0.0% for AGIs $50k-75k, 0.1% for AGIs $75k-100k, 1.5% for AGIs over 100k)
Net capital gain/loss: +$8,669 (reported on 9.2% of returns)
Here:
+$8,669
State:
+$15,776
(% of AGI for various income ranges: -0.3% for AGIs below $10k, 1.1% for AGIs $10k-25k, 1.0% for AGIs $25k-50k, 0.7% for AGIs $50k-75k, 1.2% for AGIs $75k-100k, 12.9% for AGIs over 100k)
Profit/loss from business: +$11,550 (reported on 17.3% of returns)
Here:
+$11,550
State:
+$12,882
(% of AGI for various income ranges: 21.4% for AGIs below $10k, 8.3% for AGIs $10k-25k, 3.5% for AGIs $25k-50k, 3.6% for AGIs $50k-75k, -0.2% for AGIs $75k-100k, 19.6% for AGIs over 100k)
IRA payment deduction: $2,533 (reported on 1.1% of returns)
37342:
$2,533
Tennessee:
$2,934
Total itemized deductions: $14,588 (24% of AGI, reported on 12.8% of returns)
Here:
$14,588
State:
$18,035
Here:
24.2% of AGI
State:
19.9% of AGI
(% of AGI for various income ranges: 5.8% for AGIs $10k-25k, 5.2% for AGIs $25k-50k, 5.4% for AGIs $50k-75k, 6.1% for AGIs $75k-100k, 7.4% for AGIs over 100k)
Charity contributions deductions: $3,371 (5% of AGI, reported on 10.4% of returns)
Here:
$3,371
State:
$5,167
Here:
5.3% of AGI
State:
5.3% of AGI
(% of AGI for various income ranges: 0.7% for AGIs $10k-25k, 1.0% for AGIs $25k-50k, 0.8% for AGIs $50k-75k, 1.6% for AGIs $75k-100k, 1.6% for AGIs over 100k)
Total tax: $4,085 (reported on 72.9% of returns)
37342:
$4,085
State:
$7,482
(% of AGI for various income ranges: 4.7% for AGIs below $10k, 4.0% for AGIs $10k-25k, 6.6% for AGIs $25k-50k, 8.8% for AGIs $50k-75k, 10.9% for AGIs $75k-100k, 18.5% for AGIs over 100k)
Earned income credit: $1,673 (reported on 22.9% of returns)
Here:
$1,673
State:
$1,826
Percentage of individuals using paid preparers for their 2004 taxes: 67.6%
Here:
68%
State:
60%
(% for various income ranges: 58.8% for AGIs below $10k, 73.5% for AGIs $10k-25k, 68.3% for AGIs $25k-50k, 70.8% for AGIs $50k-75k, 59.5% for AGIs $75k-100k, 77.5% for AGIs over 100k)
Household received Food Stamps/SNAP in the past 12 months: 140 Household did not receive Food Stamps/SNAP in the past 12 months: 1,477
Women who did not have a birth in the past 12 months: 989 (576 now married, 413 unmarried)
Housing units in zip code 37342 with a mortgage: 568 Median monthly owner costs for units with a mortgage: $1,029 Median monthly owner costs for units without a mortgage: $435
Residents with income below the poverty level in 2022:
This zip code:
24.2%
Whole state:
13.3%
Residents with income below 50% of the poverty level in 2022:
This zip code:
11.9%
Whole state:
7.1%
Median number of rooms in houses and condos:
Here:
6.4
State:
6.5
Median number of rooms in apartments:
Here:
5.4
State:
4.4
Notable locations in this zip code not listed on our city pages
Churches in zip code 37342 include: Hillsboro Baptist Church (A), Hillsboro Church of Christ (B), Hillsboro Cumberland Presbyterian Church (C), Prairie Plains Church (D), Betsy Willis Church (E), Zion Hill Church (F), Beans Creek Church (G), Mount Pleasant Church (H), Mount Nebo Church (I). Display/hide their locations on the map
Cemeteries: Tate Cemetery (1), Thomas Cemetery (2), Jackson Cemetery (3), Wilder Cemetery (4), Wileman Cemetery (5), Wilkinson Cemetery (6), Lambert Cemetery (7). Display/hide their locations on the map
Streams, rivers, and creeks: Betsy Willis Creek (A), Beans Creek (B), Dry Creek (C), Collier Branch (D), Bray Branch (E), Blue Spring Creek (F), Warren Branch (G), Mill Creek (H). Display/hide their locations on the map
In group quarters: 32 (-1 institutionalized population)
Size of family households: 528 2-persons, 160 3-persons, 340 4-persons, 84 5-persons, 8 7-or-more-persons
Size of nonfamily households: 423 1-person, 45 2-persons, 18 3-persons
662 married couples with children.
360 single-parent households (104 men, 256 women).
98.3% of residents of 37342 zip code speak English at home.
0.8% of residents speak Spanish at home (40% very well, 7% well, 30% not well, 23% not at all).
0.1% of residents speak other Indo-European language at home (100% not well).
0.4% of residents speak Asian or Pacific Island language at home (100% well).
Foreign born population: 52 (1.3%) (43.6% of them are naturalized citizens)
This zip code:
1.3%
Whole state:
5.6%
27%Honduras
25%Thailand
17%France
17%North Macedonia (Macedonia)
4%Laos
35%American
12%Irish
10%English
8%German
5%European
1%Polish
1%French Canadian
Year of entry for the foreign-born population
302010 or later
42000 to 2009
01990 to 1999
21Before 1990
Facilities with environmental interests located in this zip code:
COUNTY QUARRY (HENRY COVE ROAD in HILLSBORO, TN)
National Pollutant Discharge Elimination System NON-MAJOR (Tracking pollutant discharge elimination systems) - permit Business SIC classification: CRUSHED AND BROKEN LIMESTONE Organizations: ALVIN HARPER (CONTACT/OWNER)
Alternative names: ALVIN HARPER, COFFEE COUNTY HWY DEPT
CUSTOM STONE, LLC (NORMA WRIGHT in HILLSBORO, TN)
National Pollutant Discharge Elimination System NON-MAJOR (Tracking pollutant discharge elimination systems) - permit Business SIC classification: CRUSHED AND BROKEN LIMESTONE
Housing units lacking complete plumbing facilities: 3.1% Housing units lacking complete kitchen facilities: 3.1%
72.4%Electricity
16.0%Utility gas
11.7%Bottled, tank, or LP gas
Population in 1990: 2,075. Population change in the 1990s: +1,005 (+48.4%).
Place of birth for U.S.-born residents:
This state: 2,684
Northeast: 65
Midwest: 519
South: 513
West: 179
65% of the 37342 zip code residents lived in the same house 5 years ago. Out of people who lived in different houses, 55% lived in this county. Out of people who lived in different counties, 50% lived in Tennessee.
90% of the 37342 zip code residents lived in the same house 1 year ago. Out of people who lived in different houses, 57% moved from this county. Out of people who lived in different houses, 36% moved from different county within same state. Out of people who lived in different houses, 5% moved from different state.
Private vs. public school enrollment:
Students in private schools in grades 1 to 8 (elementary and middle school): 17
Here:
3.1%
Tennessee:
15.0%
Students in private schools in grades 9 to 12 (high school): 21
Here:
5.9%
Tennessee:
16.2%
Students in private undergraduate colleges: 1
Here:
4.3%
Tennessee:
23.5%
Occupation by median earnings in the past 12 months ($)
104,844Architecture and engineering occupations
68,464Management occupations
39,557Material moving occupations
39,160Education, training, and library occupations
38,146Office and administrative support occupations
38,031Construction and extraction occupations
Top industries in this zip code by the number of employees in 2005:
Administrative and Support and Waste Management and Remediation Services: Landscaping Services (10-19 employees: 1 establishment, 1-4 employees: 1 establishment)
Construction: Commercial and Institutional Building Construction (10-19: 1)
Other Services (except Public Administration): Commercial and Industrial Machinery and Equipment (except Automotive and Electronic) Repair and Maintenance (10-19: 1)
Wholesale Trade: Farm and Garden Machinery and Equipment Merchant Wholesalers (10-19: 1)
Professional, Scientific, and Technical Services: Engineering Services (10-19: 1)
Health Care and Social Assistance: Child Day Care Services (5-9: 1)
Mining: Crushed and Broken Limestone Mining and Quarrying (5-9: 1)
People in group quarters in 2010:
15 people in residential treatment centers for adults
8 people in workers' group living quarters and job corps centers
Fatal accident statistics in 2013:
Fatal accident count: 1
Vehicles involved in fatal accidents: 1
Fatal accidents caused by drunken drivers: 0
Fatalities: 1
Persons involved in fatal accidents: 4
Pedestrians involved in fatal accidents: 0
Fatal accident statistics in 2012:
Fatal accident count: 2
Vehicles involved in fatal accidents: 4
Fatal accidents caused by drunken drivers: 1
Fatalities: 2
Persons involved in fatal accidents: 6
Pedestrians involved in fatal accidents: 0
2004 - 2018 National Fire Incident Reporting System (NFIRS) incidents
According to the data from the years 2004 - 2018 the average number of fires per year is 43. The highest number of fire incidents - 70 took place in 2006, and the least - 15 in 2008. The data has an increasing trend.
When looking into fire subcategories, the most reports belonged to: Outside Fires (40.5%), and Structure Fires (36.6%).
Fire incident types reported to NFIRS in Zip Code 37342


 Nearest zip codes: 37366, 37301, 37324, 37394, 37355, 37357.


 According to the data from the years 2004 - 2018 the average number of fires per year is 43. The highest number of fire incidents - 70 took place in 2006, and the least - 15 in 2008. The data has an increasing trend.
 When looking into fire subcategories, the most reports belonged to: Outside Fires (40.5%), and Structure Fires (36.6%).