Estimated zip code population in 2022: 10,354 Zip code population in 2010: 8,855 Zip code population in 2000: 7,850
Houses and condos: 5,456 Renter-occupied apartments: 929
% of renters here:
21%
State:
33%
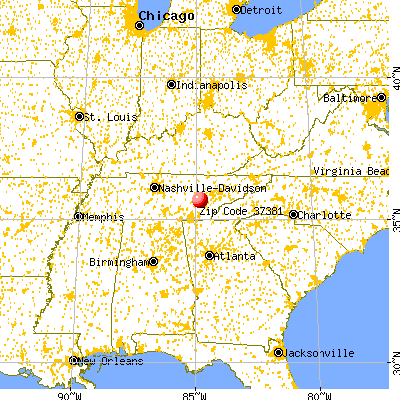
March 2022 cost of living index in zip code 37381: 79.8 (low, U.S. average is 100)
Land area: 139.2 sq. mi. Water area: 14.9 sq. mi.
Population density: 74 people per square mile
(very low).
OSM Map
General Map
Google Map
MSN Map
OSM Map
General Map
Google Map
MSN Map
OSM Map
General Map
Google Map
MSN Map
OSM Map
General Map
Google Map
MSN Map
Please wait while loading the map...
Real estate property taxes paid for housing units in 2022:
This zip code:
0.4% ($905)
Tennessee:
0.5% ($1,376)
Median real estate property taxes paid for housing units with mortgages in 2022: $924 (0.4%) Median real estate property taxes paid for housing units with no mortgage in 2022: $875 (0.5%)
Business Search- 14 Million verified businesses
Males: 5,347
(51.6%)
Females: 5,006
(48.4%)
For population 25 years and over in 37381:
High school or higher: 78.7%
Bachelor's degree or higher: 15.8%
Graduate or professional degree: 4.2%
Unemployed: 5.8%
Mean travel time to work (commute): 31.5 minutes
For population 15 years and over in 37381:
Never married: 19.2%
Now married: 54.8%
Separated: 2.4%
Widowed: 6.2%
Divorced: 17.3%
Zip code 37381 compared to state average:
Black race population percentage significantly below state average.
Hispanic race population percentage significantly below state average.
Median age significantly above state average.
Foreign-born population percentage significantly below state average.
Renting percentage below state average.
Length of stay since moving in significantly above state average.
Number of college students below state average.
Percentage of population with a bachelor's degree or higher below state average.
Averages for the 2020 tax year for zip code 37381, filed in 2021:
Average Adjusted Gross Income (AGI) in 2020: $57,510 (Individual Income Tax Returns)
Here:
$57,510
State:
$69,014
Salary/wage: $49,778 (reported on 76.3% of returns)
Here:
$49,778
State:
$55,872
(% of AGI for various income ranges: 1031.2% for AGIs below $25k, 3228.8% for AGIs $25k-50k, 5827.6% for AGIs $50k-75k, 8240.0% for AGIs $75k-100k, 15417.3% for AGIs $100k-200k, 52130.0% for AGIs over 200k)
Taxable interest for individuals: $1,474 (reported on 30.2% of returns)
This zip code:
$1,474
Tennessee:
$1,945
(% of AGI for various income ranges: 19.6% for AGIs below $25k, 25.9% for AGIs $25k-50k, 63.1% for AGIs $50k-75k, 68.8% for AGIs $75k-100k, 160.7% for AGIs $100k-200k, 1037.5% for AGIs over 200k)
Ordinary dividends: $4,782 (reported on 12.2% of returns)
Here:
$4,782
State:
$8,105
(% of AGI for various income ranges: 13.7% for AGIs below $25k, 29.3% for AGIs $25k-50k, 69.5% for AGIs $50k-75k, 135.0% for AGIs $75k-100k, 174.7% for AGIs $100k-200k, 1927.5% for AGIs over 200k)
Net capital gain/loss in AGI: +$19,551 (reported on 11.7% of returns)
Here:
+$19,551
State:
+$33,664
(% of AGI for various income ranges: 2.6% for AGIs below $25k, 26.5% for AGIs $25k-50k, 100.0% for AGIs $50k-75k, 130.8% for AGIs $75k-100k, 596.0% for AGIs $100k-200k, 15960.0% for AGIs over 200k)
Profit/loss from business: +$13,472 (reported on 13.5% of returns)
Here:
+$13,472
State:
+$18,991
(% of AGI for various income ranges: 154.4% for AGIs below $25k, 132.7% for AGIs $25k-50k, 177.4% for AGIs $50k-75k, 250.4% for AGIs $75k-100k, 399.7% for AGIs $100k-200k, 4525.0% for AGIs over 200k)
Taxable individual retirement arrangement distribution: $16,126 (reported on 9.5% of returns)
37381:
$16,126
Tennessee:
$20,036
(% of AGI for various income ranges: 51.5% for AGIs below $25k, 92.6% for AGIs $25k-50k, 180.0% for AGIs $50k-75k, 531.2% for AGIs $75k-100k, 872.7% for AGIs $100k-200k)
Total itemized deductions: $28,213 (reported on 3.7% of returns)
Here:
$28,213
State:
$40,136
(% of AGI for various income ranges: 59.8% for AGIs below $25k, 227.6% for AGIs $50k-75k, 358.7% for AGIs $100k-200k, 3825.0% for AGIs over 200k)
Charity contributions: $9,875 (reported on 3.0% of returns)
Here:
$9,875
State:
$19,852
(% of AGI for various income ranges: 72.4% for AGIs $50k-75k, 113.7% for AGIs $100k-200k, 1350.0% for AGIs over 200k)
Taxes paid: $6,179 (reported on 3.5% of returns)
37381:
$6,179
State:
$6,038
(% of AGI for various income ranges: 8.0% for AGIs below $25k, 41.4% for AGIs $50k-75k, 84.7% for AGIs $100k-200k, 867.5% for AGIs over 200k)
Earned income credit: $2,483 (reported on 20.7% of returns)
Here:
$2,483
State:
$2,391
(% of AGI for various income ranges: 116.8% for AGIs below $25k, 87.6% for AGIs $25k-50k)
Percentage of individuals using paid preparers for their 2020 taxes: 95.0%
Here:
95%
State:
93%
(% for various income ranges: 94.4% for AGIs below $25k, 96.1% for AGIs $25k-50k, 94.8% for AGIs $50k-75k, 94.7% for AGIs $75k-100k, 93.9% for AGIs $100k-200k, 100.0% for AGIs over 200k)
Averages for the 2012 tax year for zip code 37381, filed in 2013:
Average Adjusted Gross Income (AGI) in 2012: $46,846 (Individual Income Tax Returns)
Here:
$46,846
State:
$53,767
Salary/wage: $41,705 (reported on 79.9% of returns)
Here:
$41,705
State:
$45,421
(% of AGI for various income ranges: 69.5% for AGIs below $25k, 78.3% for AGIs $25k-50k, 70.8% for AGIs $50k-75k, 72.1% for AGIs $75k-100k, 72.4% for AGIs $100k-200k, 57.4% for AGIs over 200k)
Taxable interest for individuals: $1,208 (reported on 30.9% of returns)
This zip code:
$1,208
Tennessee:
$1,732
(% of AGI for various income ranges: 1.2% for AGIs below $25k, 0.8% for AGIs $25k-50k, 1.0% for AGIs $50k-75k, 1.0% for AGIs $75k-100k, 0.5% for AGIs $100k-200k, 0.3% for AGIs over 200k)
Ordinary dividends: $2,926 (reported on 11.4% of returns)
Here:
$2,926
State:
$6,739
(% of AGI for various income ranges: 0.9% for AGIs below $25k, 0.4% for AGIs $25k-50k, 0.5% for AGIs $50k-75k, 0.5% for AGIs $75k-100k, 0.9% for AGIs $100k-200k, 1.1% for AGIs over 200k)
Net capital gain/loss in AGI: +$10,385 (reported on 9.2% of returns)
Here:
+$10,385
State:
+$19,082
(% of AGI for various income ranges: 0.3% for AGIs below $25k, 0.4% for AGIs $50k-75k, 1.0% for AGIs $75k-100k, 0.9% for AGIs $100k-200k, 13.5% for AGIs over 200k)
Profit/loss from business: +$8,143 (reported on 12.7% of returns)
Here:
+$8,143
State:
+$15,240
(% of AGI for various income ranges: 8.9% for AGIs below $25k, 3.0% for AGIs $25k-50k, 0.9% for AGIs $50k-75k, 1.3% for AGIs $75k-100k, 1.0% for AGIs $100k-200k)
Taxable individual retirement arrangement distribution: $12,514 (reported on 9.8% of returns)
37381:
$12,514
Tennessee:
$15,505
(% of AGI for various income ranges: 2.3% for AGIs below $25k, 1.7% for AGIs $25k-50k, 2.9% for AGIs $50k-75k, 3.1% for AGIs $75k-100k, 4.1% for AGIs $100k-200k)
Total itemized deductions: $19,795 (21% of AGI, reported on 17.1% of returns)
Here:
$19,795
State:
$21,976
Here:
21.0% of AGI
State:
17.8% of AGI
(% of AGI for various income ranges: 4.3% for AGIs below $25k, 6.7% for AGIs $25k-50k, 8.2% for AGIs $50k-75k, 7.0% for AGIs $75k-100k, 8.1% for AGIs $100k-200k, 8.0% for AGIs over 200k)
Charity contributions: $4,979 (reported on 12.7% of returns)
Here:
$4,979
State:
$6,709
(% of AGI for various income ranges: 0.5% for AGIs below $25k, 0.9% for AGIs $25k-50k, 1.2% for AGIs $50k-75k, 1.3% for AGIs $75k-100k, 1.7% for AGIs $100k-200k, 2.6% for AGIs over 200k)
Taxes paid: $3,744 (reported on 17.1% of returns)
37381:
$3,744
State:
$4,829
(% of AGI for various income ranges: 0.7% for AGIs below $25k, 0.9% for AGIs $25k-50k, 1.2% for AGIs $50k-75k, 1.2% for AGIs $75k-100k, 1.9% for AGIs $100k-200k, 2.0% for AGIs over 200k)
Earned income credit: $2,277 (reported on 24.7% of returns)
Here:
$2,277
State:
$2,404
(% of AGI for various income ranges: 7.9% for AGIs below $25k, 1.5% for AGIs $25k-50k)
Percentage of individuals using paid preparers for their 2012 taxes: 51.5%
Here:
51%
State:
52%
(% for various income ranges: 45.6% for AGIs below $25k, 52.7% for AGIs $25k-50k, 56.2% for AGIs $50k-75k, 60.6% for AGIs $75k-100k, 57.6% for AGIs $100k-200k, 66.7% for AGIs over 200k)
Averages for the 2004 tax year for zip code 37381, filed in 2005:
Average Adjusted Gross Income (AGI) in 2004: $35,565 (Individual Income Tax Returns)
Here:
$35,565
State:
$44,088
Salary/wage: $33,682 (reported on 82.0% of returns)
Here:
$33,682
State:
$38,825
(% of AGI for various income ranges: 89.2% for AGIs below $10k, 73.1% for AGIs $10k-25k, 80.1% for AGIs $25k-50k, 78.6% for AGIs $50k-75k, 79.7% for AGIs $75k-100k, 72.8% for AGIs over 100k)
Taxable interest for individuals: $1,643 (reported on 38.4% of returns)
This zip code:
$1,643
Tennessee:
$1,802
(% of AGI for various income ranges: 6.3% for AGIs below $10k, 2.3% for AGIs $10k-25k, 1.2% for AGIs $25k-50k, 1.4% for AGIs $50k-75k, 1.6% for AGIs $75k-100k, 2.5% for AGIs over 100k)
Taxable dividends: $1,693 (reported on 12.1% of returns)
Here:
$1,693
State:
$3,727
(% of AGI for various income ranges: 1.5% for AGIs below $10k, 0.7% for AGIs $10k-25k, 0.4% for AGIs $25k-50k, 0.6% for AGIs $50k-75k, 0.5% for AGIs $75k-100k, 0.7% for AGIs over 100k)
Net capital gain/loss: +$5,365 (reported on 10.6% of returns)
Here:
+$5,365
State:
+$15,776
(% of AGI for various income ranges: -1.6% for AGIs below $10k, 0.2% for AGIs $10k-25k, 0.4% for AGIs $25k-50k, 1.2% for AGIs $50k-75k, 2.0% for AGIs $75k-100k, 5.1% for AGIs over 100k)
Profit/loss from business: +$6,117 (reported on 14.2% of returns)
Here:
+$6,117
State:
+$12,882
(% of AGI for various income ranges: 9.2% for AGIs below $10k, 5.6% for AGIs $10k-25k, 2.0% for AGIs $25k-50k, 1.5% for AGIs $50k-75k, 0.2% for AGIs $75k-100k, 3.3% for AGIs over 100k)
IRA payment deduction: $3,029 (reported on 1.9% of returns)
37381:
$3,029
Tennessee:
$2,934
(% of AGI for various income ranges: 0.2% for AGIs $10k-25k, 0.1% for AGIs $25k-50k, 0.1% for AGIs $50k-75k, 0.1% for AGIs $75k-100k, 0.3% for AGIs over 100k)
Total itemized deductions: $16,203 (25% of AGI, reported on 15.3% of returns)
Here:
$16,203
State:
$18,035
Here:
25.2% of AGI
State:
19.9% of AGI
(% of AGI for various income ranges: 5.4% for AGIs below $10k, 4.8% for AGIs $10k-25k, 6.4% for AGIs $25k-50k, 7.4% for AGIs $50k-75k, 7.6% for AGIs $75k-100k, 8.5% for AGIs over 100k)
Charity contributions deductions: $4,051 (6% of AGI, reported on 12.2% of returns)
Here:
$4,051
State:
$5,167
Here:
5.9% of AGI
State:
5.3% of AGI
(% of AGI for various income ranges: 0.7% for AGIs $10k-25k, 1.0% for AGIs $25k-50k, 1.3% for AGIs $50k-75k, 1.6% for AGIs $75k-100k, 2.8% for AGIs over 100k)
Total tax: $4,458 (reported on 74.5% of returns)
37381:
$4,458
State:
$7,482
(% of AGI for various income ranges: 4.5% for AGIs below $10k, 4.0% for AGIs $10k-25k, 6.4% for AGIs $25k-50k, 9.0% for AGIs $50k-75k, 11.2% for AGIs $75k-100k, 17.7% for AGIs over 100k)
Earned income credit: $1,655 (reported on 19.9% of returns)
Here:
$1,655
State:
$1,826
Percentage of individuals using paid preparers for their 2004 taxes: 58.3%
Here:
58%
State:
60%
(% for various income ranges: 50.4% for AGIs below $10k, 60.2% for AGIs $10k-25k, 60.6% for AGIs $25k-50k, 58.2% for AGIs $50k-75k, 59.2% for AGIs $75k-100k, 67.8% for AGIs over 100k)
Likely homosexual households (counted as self-reported same-sex unmarried-partner households)
Lesbian couples: 0.1% of all households
Gay men: 0.0% of all households
Household received Food Stamps/SNAP in the past 12 months: 678 Household did not receive Food Stamps/SNAP in the past 12 months: 3,660
Women who had a birth in the past 12 months: 129 (121 now married, 10 unmarried) Women who did not have a birth in the past 12 months: 2,157 (1,076 now married, 1,082 unmarried)
Housing units in zip code 37381 with a mortgage: 1,504 (86 second mortgage, 51 both second mortgage and home equity loan) Houses without a mortgage: 23
Median monthly owner costs for units with a mortgage: $1,189 Median monthly owner costs for units without a mortgage: $364
Residents with income below the poverty level in 2022:
This zip code:
18.3%
Whole state:
13.3%
Residents with income below 50% of the poverty level in 2022:
This zip code:
10.8%
Whole state:
7.1%
Median number of rooms in houses and condos:
Here:
6.2
State:
6.5
Median number of rooms in apartments:
Here:
4.3
State:
4.4
Notable locations in this zip code not listed on our city pages
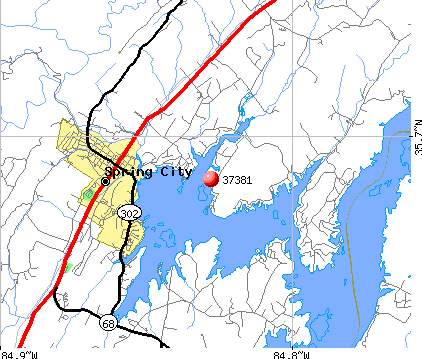
Notable locations in zip code 37381: Watts Bar Resort (A), Watts Bar Nuclear Plant (B), Walden Ridge (C), Ponderosa Resort (D), Terrace View Resort (E), Toestring Cove Resort (F), Spring City Dock (G), Rhea Harbor (H), Piney Point Dock (I), Bills Pier (J), Arrowhead Dock (K), Cedine Bible Camp (L), Whites Creek Boat Dock (M), Stump Hollow Campground (N), Lakeside Lodge (O), Rhea Springs Fish Hatchery (P), Red Cloud Campground (Q), Spring City Resort (R), Newport Resort (S), Estes Resort (T). Display/hide their locations on the map
Churches in zip code 37381 include: Euchee Chapel (A), Friendship Church (B), Bethel Baptist Church (C), Central Baptist Church (D), Four Square Church (E), Pennine Baptist Church (F), Reed United Methodist Chapel (G), Saint Clair Baptist Church (H), Sheffield Church (I). Display/hide their locations on the map
Cemeteries: Horst Cemetery (1), Ingle Cemetery (2), Thompson Cemetery (3), Thurman Cemetery (4), Treadway Cemetery (5), Jolley Cemetery (6), Wassom Cemetery (7). Display/hide their locations on the map
Streams, rivers, and creeks: Lowe Branch (A), Long Branch (B), Lick Branch (C), Bearpen Branch (D), Laurel Ford Branch (E), Laurel Branch (F), Youngs Creek (G), Ivy Branch (H), Holloway Branch (I). Display/hide their locations on the map
Parks in zip code 37381 include: Whites Creek Small Wildlife Area (1), Spring City Park (2), Yellow Creek Wildlife Management Area (3), Rhea Springs Recreation Area (4), Boy Scout Memorial (5). Display/hide their locations on the map
1,320 married couples with children.
349 single-parent households (135 men, 214 women).
98.9% of residents of 37381 zip code speak English at home.
0.9% of residents speak Spanish at home (47% very well, 53% well).
0.1% of residents speak other Indo-European language at home (100% very well).
Foreign born population: 45 (0.4%) (100.0% of them are naturalized citizens)
This zip code:
0.4%
Whole state:
5.6%
87%Honduras
38%English
16%American
13%German
4%Scotch-Irish
3%Irish
2%Scottish
2%Italian
Year of entry for the foreign-born population
512010 or later
02000 to 2009
441990 to 1999
0Before 1990
Facilities with environmental interests located in this zip code:
BOLES TRUCKING CO/CHESTER H (?? in SPRING CITY, TN)
(Resource Conservation and Recovery Act (tracking hazardous waste))
Housing units lacking complete plumbing facilities: 3.2% Housing units lacking complete kitchen facilities: 4.2%
55.5%Electricity
31.7%Utility gas
6.5%Wood
5.0%Bottled, tank, or LP gas
1.1%No fuel used
Population in 1990: 7,787. Population change in the 1990s: +63 (+0.8%).
Place of birth for U.S.-born residents:
This state: 6,428
Northeast: 331
Midwest: 1,505
South: 1,374
West: 589
57% of the 37381 zip code residents lived in the same house 5 years ago. Out of people who lived in different houses, 58% lived in this county. Out of people who lived in different counties, 50% lived in Tennessee.
86% of the 37381 zip code residents lived in the same house 1 year ago. Out of people who lived in different houses, 44% moved from this county. Out of people who lived in different houses, 37% moved from different county within same state. Out of people who lived in different houses, 15% moved from different state. Out of people who lived in different houses, 3% moved from abroad.
Private vs. public school enrollment:
Students in private schools in grades 1 to 8 (elementary and middle school): 119
Here:
14.0%
Tennessee:
15.0%
Students in private schools in grades 9 to 12 (high school): 225
Here:
39.9%
Tennessee:
16.2%
Students in private undergraduate colleges: 15
Here:
10.3%
Tennessee:
23.5%
Occupation by median earnings in the past 12 months ($)
145,553Architecture and engineering occupations
130,597Arts, design, entertainment, sports, and media occupations
93,254Business and financial operations occupations
90,534Fire fighting and prevention, and other protective service workers including supervisors
87,035Transportation occupations
70,109Management occupations
Companies with federal contracts located in this zip code:
SSM INDUSTRIES, INC (211 ELLIS STREET in SPRING CITY, TN; small business)
$10,430 with Navy for Clothing, Special Purpose. Signed on 2003-11-10. Completion date: 2003-11-10.
Top industries in this zip code by the number of employees in 2005:
Health Care and Social Assistance: Nursing Care Facilities (100-249 employees: 1 establishment)
Accommodation and Food Services: Limited-Service Restaurants (20-49: 2, 1-4: 3)
Other Services (except Public Administration): Religious Organizations (20-49: 1, 10-19: 1, 5-9: 2, 1-4: 4)
Construction: New Single-Family Housing Construction (except Operative Builders) (20-49: 1, 1-4: 3)
Construction: Site Preparation Contractors (10-19: 1, 5-9: 2, 1-4: 4)
People in group quarters in 2010:
121 people in nursing facilities/skilled-nursing facilities
People in group quarters in 2000:
126 people in nursing homes
12 people in other group homes
Fatal accident statistics in 2013:
Fatal accident count: 2
Vehicles involved in fatal accidents: 3
Fatal accidents caused by drunken drivers: 1
Fatalities: 2
Persons involved in fatal accidents: 3
Pedestrians involved in fatal accidents: 0
Fatal accident statistics in 2010:
Fatal accident count: 2
Vehicles involved in fatal accidents: 4
Fatal accidents caused by drunken drivers: 0
Fatalities: 2
Persons involved in fatal accidents: 4
Pedestrians involved in fatal accidents: 0
2002 - 2018 National Fire Incident Reporting System (NFIRS) incidents
Based on the data from the years 2002 - 2018 the average number of fire incidents per year is 28. The highest number of reported fire incidents - 63 took place in 2018, and the least - 9 in 2006. The data has a growing trend.
When looking into fire subcategories, the most reports belonged to: Structure Fires (41.7%), and Outside Fires (36.8%).
Fire incident types reported to NFIRS in Zip Code 37381


 Nearest zip codes: 37337, 37332, 37322, 37880, 37321, 38555.


 Based on the data from the years 2002 - 2018 the average number of fire incidents per year is 28. The highest number of reported fire incidents - 63 took place in 2018, and the least - 9 in 2006. The data has a growing trend.
 When looking into fire subcategories, the most reports belonged to: Structure Fires (41.7%), and Outside Fires (36.8%).