Estimated zip code population in 2022: 8,651 Zip code population in 2010: 8,131 Zip code population in 2000: 7,874
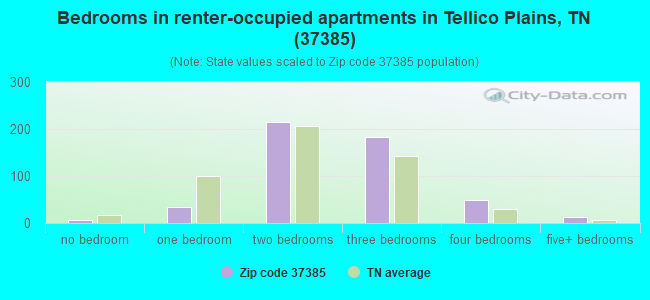
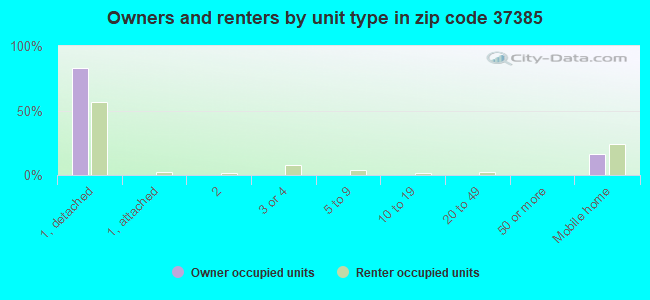
Houses and condos: 4,363 Renter-occupied apartments: 503
% of renters here:
16%
State:
33%
March 2022 cost of living index in zip code 37385: 78.4 (low, U.S. average is 100)
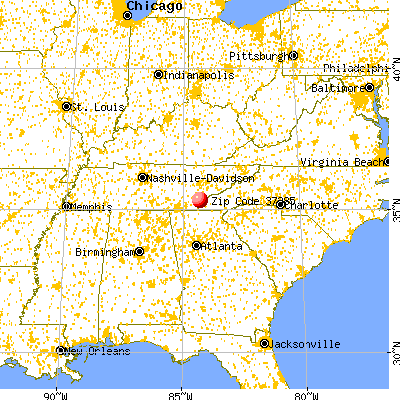
Land area: 245.8 sq. mi. Water area: 0.3 sq. mi.
Population density: 35 people per square mile
(very low).
OSM Map
General Map
Google Map
MSN Map
OSM Map
General Map
Google Map
MSN Map
OSM Map
General Map
Google Map
MSN Map
OSM Map
General Map
Google Map
MSN Map
Please wait while loading the map...
Real estate property taxes paid for housing units in 2022:
This zip code:
0.4% ($778)
Tennessee:
0.5% ($1,376)
Median real estate property taxes paid for housing units with mortgages in 2022: $771 (0.4%) Median real estate property taxes paid for housing units with no mortgage in 2022: $799 (0.4%)
Business Search- 14 Million verified businesses
Males: 4,653
(53.8%)
Females: 3,997
(46.2%)
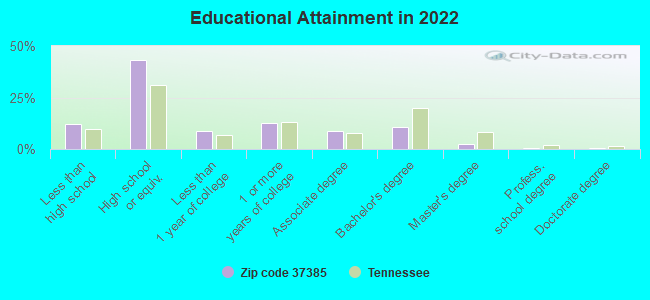
For population 25 years and over in 37385:
High school or higher: 86.0%
Bachelor's degree or higher: 13.7%
Graduate or professional degree: 3.4%
Unemployed: 4.3%
Mean travel time to work (commute): 37.5 minutes
For population 15 years and over in 37385:
Never married: 23.3%
Now married: 56.8%
Separated: 1.3%
Widowed: 5.7%
Divorced: 12.8%
Zip code 37385 compared to state average:
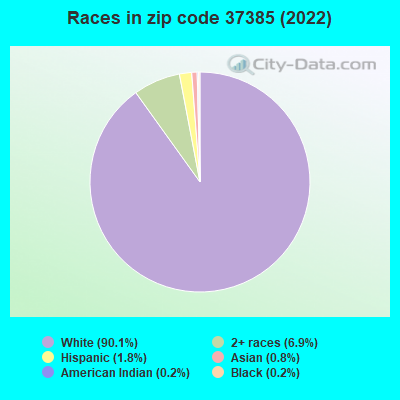
Black race population percentage significantly below state average.
Hispanic race population percentage significantly below state average.
Foreign-born population percentage significantly below state average.
Renting percentage below state average.
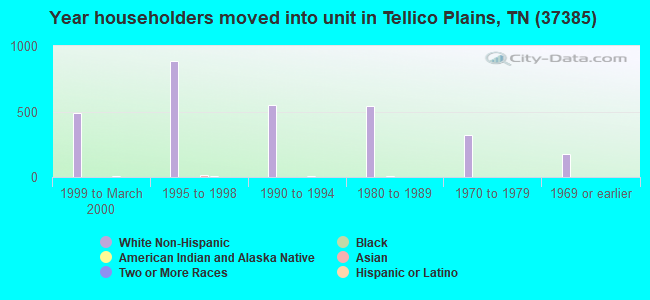
Length of stay since moving in significantly above state average.
Number of college students below state average.
Percentage of population with a bachelor's degree or higher significantly below state average.
Estimated median house/condo value in 2022: $206,759
37385:
$206,759
Tennessee:
$284,800
According to our research of Tennessee and other state lists, there were 24 registered sex offenders living in 37385 zip code as of May 28, 2024. The ratio of all residents to sex offenders in zip code 37385 is 350 to 1. The ratio of registered sex offenders to all residents in this zip code is near the state average.
Median resident age:
This zip code:
42.3 years
Tennessee median age:
39.2 years
Average household size:
This zip code:
2.7 people
Tennessee:
2.4 people
Averages for the 2020 tax year for zip code 37385, filed in 2021:
Average Adjusted Gross Income (AGI) in 2020: $49,402 (Individual Income Tax Returns)
Here:
$49,402
State:
$69,014
Salary/wage: $42,407 (reported on 77.8% of returns)
Here:
$42,407
State:
$55,872
(% of AGI for various income ranges: 996.2% for AGIs below $25k, 3171.5% for AGIs $25k-50k, 5552.9% for AGIs $50k-75k, 8494.2% for AGIs $75k-100k, 11908.3% for AGIs $100k-200k)
Taxable interest for individuals: $880 (reported on 25.2% of returns)
This zip code:
$880
Tennessee:
$1,945
(% of AGI for various income ranges: 16.2% for AGIs below $25k, 22.8% for AGIs $25k-50k, 27.1% for AGIs $50k-75k, 54.2% for AGIs $75k-100k, 63.5% for AGIs $100k-200k)
Ordinary dividends: $3,141 (reported on 8.7% of returns)
Here:
$3,141
State:
$8,105
(% of AGI for various income ranges: 17.2% for AGIs below $25k, 24.3% for AGIs $25k-50k, 30.5% for AGIs $50k-75k, 38.8% for AGIs $75k-100k, 154.8% for AGIs $100k-200k)
Net capital gain/loss in AGI: +$10,024 (reported on 8.7% of returns)
Here:
+$10,024
State:
+$33,664
(% of AGI for various income ranges: 5.0% for AGIs below $25k, 18.3% for AGIs $25k-50k, 39.3% for AGIs $50k-75k, 175.4% for AGIs $75k-100k, 933.0% for AGIs $100k-200k)
Profit/loss from business: +$10,250 (reported on 16.2% of returns)
Here:
+$10,250
State:
+$18,991
(% of AGI for various income ranges: 175.6% for AGIs below $25k, 165.4% for AGIs $25k-50k, 230.7% for AGIs $50k-75k, 282.1% for AGIs $75k-100k, 465.2% for AGIs $100k-200k)
Taxable individual retirement arrangement distribution: $16,467 (reported on 7.2% of returns)
37385:
$16,467
Tennessee:
$20,036
(% of AGI for various income ranges: 48.6% for AGIs below $25k, 124.0% for AGIs $25k-50k, 167.3% for AGIs $50k-75k, 255.8% for AGIs $75k-100k, 566.1% for AGIs $100k-200k)
Total itemized deductions: $28,283 (reported on 1.8% of returns)
Here:
$28,283
State:
$40,136
(% of AGI for various income ranges: 170.5% for AGIs $50k-75k, 433.9% for AGIs $100k-200k)
Charity contributions: $9,600 (reported on 1.5% of returns)
Here:
$9,600
State:
$19,852
(% of AGI for various income ranges: 18.3% for AGIs $25k-50k, 151.3% for AGIs $100k-200k)
Taxes paid: $4,343 (reported on 2.1% of returns)
37385:
$4,343
State:
$6,038
(% of AGI for various income ranges: 24.1% for AGIs $50k-75k, 89.1% for AGIs $100k-200k)
Earned income credit: $2,249 (reported on 22.2% of returns)
Here:
$2,249
State:
$2,391
(% of AGI for various income ranges: 106.4% for AGIs below $25k, 92.2% for AGIs $25k-50k)
Percentage of individuals using paid preparers for their 2020 taxes: 93.7%
Here:
94%
State:
93%
(% for various income ranges: 93.5% for AGIs below $25k, 94.3% for AGIs $25k-50k, 94.2% for AGIs $50k-75k, 93.9% for AGIs $75k-100k, 93.8% for AGIs $100k-200k, 80.0% for AGIs over 200k)
Averages for the 2012 tax year for zip code 37385, filed in 2013:
Average Adjusted Gross Income (AGI) in 2012: $36,080 (Individual Income Tax Returns)
Here:
$36,080
State:
$53,767
Salary/wage: $33,458 (reported on 80.9% of returns)
Here:
$33,458
State:
$45,421
(% of AGI for various income ranges: 68.3% for AGIs below $25k, 81.0% for AGIs $25k-50k, 80.9% for AGIs $50k-75k, 75.4% for AGIs $75k-100k, 65.2% for AGIs $100k-200k)
Taxable interest for individuals: $1,024 (reported on 22.4% of returns)
This zip code:
$1,024
Tennessee:
$1,732
(% of AGI for various income ranges: 1.8% for AGIs below $25k, 0.6% for AGIs $25k-50k, 0.3% for AGIs $50k-75k, 0.2% for AGIs $75k-100k, 0.4% for AGIs $100k-200k)
Ordinary dividends: $2,023 (reported on 7.4% of returns)
Here:
$2,023
State:
$6,739
(% of AGI for various income ranges: 0.8% for AGIs below $25k, 0.4% for AGIs $25k-50k, 0.3% for AGIs $50k-75k, 0.2% for AGIs $75k-100k, 0.4% for AGIs $100k-200k)
Net capital gain/loss in AGI: +$3,457 (reported on 7.7% of returns)
Here:
+$3,457
State:
+$19,082
(% of AGI for various income ranges: 1.2% for AGIs $50k-75k, 2.2% for AGIs $100k-200k)
Profit/loss from business: +$7,767 (reported on 17.1% of returns)
Here:
+$7,767
State:
+$15,240
(% of AGI for various income ranges: 13.3% for AGIs below $25k, 2.6% for AGIs $25k-50k, 0.9% for AGIs $50k-75k, 1.3% for AGIs $75k-100k, 2.2% for AGIs $100k-200k)
Taxable individual retirement arrangement distribution: $12,043 (reported on 7.0% of returns)
37385:
$12,043
Tennessee:
$15,505
(% of AGI for various income ranges: 1.9% for AGIs below $25k, 1.4% for AGIs $25k-50k, 2.2% for AGIs $50k-75k, 2.5% for AGIs $75k-100k, 4.0% for AGIs $100k-200k)
Total itemized deductions: $19,211 (27% of AGI, reported on 12.4% of returns)
Here:
$19,211
State:
$21,976
Here:
26.7% of AGI
State:
17.8% of AGI
(% of AGI for various income ranges: 4.4% for AGIs below $25k, 4.7% for AGIs $25k-50k, 6.7% for AGIs $50k-75k, 7.0% for AGIs $75k-100k, 10.6% for AGIs $100k-200k)
Charity contributions: $4,514 (reported on 9.4% of returns)
Here:
$4,514
State:
$6,709
(% of AGI for various income ranges: 0.4% for AGIs below $25k, 0.5% for AGIs $25k-50k, 1.2% for AGIs $50k-75k, 1.5% for AGIs $75k-100k, 2.4% for AGIs $100k-200k)
Taxes paid: $3,233 (reported on 12.0% of returns)
37385:
$3,233
State:
$4,829
(% of AGI for various income ranges: 0.5% for AGIs below $25k, 0.7% for AGIs $25k-50k, 0.9% for AGIs $50k-75k, 1.1% for AGIs $75k-100k, 2.3% for AGIs $100k-200k)
Earned income credit: $2,340 (reported on 30.4% of returns)
Here:
$2,340
State:
$2,404
(% of AGI for various income ranges: 8.9% for AGIs below $25k, 2.0% for AGIs $25k-50k)
Percentage of individuals using paid preparers for their 2012 taxes: 62.5%
Here:
63%
State:
52%
(% for various income ranges: 60.1% for AGIs below $25k, 63.0% for AGIs $25k-50k, 64.3% for AGIs $50k-75k, 66.7% for AGIs $75k-100k, 73.3% for AGIs $100k-200k)
Averages for the 2004 tax year for zip code 37385, filed in 2005:
Average Adjusted Gross Income (AGI) in 2004: $29,247 (Individual Income Tax Returns)
Here:
$29,247
State:
$44,088
Salary/wage: $28,090 (reported on 84.3% of returns)
Here:
$28,090
State:
$38,825
(% of AGI for various income ranges: 96.2% for AGIs below $10k, 73.6% for AGIs $10k-25k, 86.2% for AGIs $25k-50k, 86.6% for AGIs $50k-75k, 85.5% for AGIs $75k-100k, 55.0% for AGIs over 100k)
Taxable interest for individuals: $1,117 (reported on 30.5% of returns)
This zip code:
$1,117
Tennessee:
$1,802
(% of AGI for various income ranges: 3.9% for AGIs below $10k, 1.8% for AGIs $10k-25k, 0.8% for AGIs $25k-50k, 0.7% for AGIs $50k-75k, 0.4% for AGIs $75k-100k, 2.4% for AGIs over 100k)
Taxable dividends: $1,110 (reported on 7.6% of returns)
Here:
$1,110
State:
$3,727
(% of AGI for various income ranges: 1.2% for AGIs below $10k, 0.2% for AGIs $10k-25k, 0.2% for AGIs $25k-50k, 0.2% for AGIs $50k-75k, 0.0% for AGIs $75k-100k, 1.0% for AGIs over 100k)
Net capital gain/loss: +$8,632 (reported on 7.4% of returns)
Here:
+$8,632
State:
+$15,776
(% of AGI for various income ranges: -1.5% for AGIs below $10k, 1.1% for AGIs $10k-25k, 0.7% for AGIs $25k-50k, 1.3% for AGIs $50k-75k, 1.6% for AGIs $75k-100k, 12.9% for AGIs over 100k)
Profit/loss from business: +$7,198 (reported on 20.5% of returns)
Here:
+$7,198
State:
+$12,882
(% of AGI for various income ranges: 12.8% for AGIs below $10k, 12.0% for AGIs $10k-25k, 3.6% for AGIs $25k-50k, 1.1% for AGIs $50k-75k, 0.9% for AGIs $75k-100k, 8.5% for AGIs over 100k)
IRA payment deduction: $2,962 (reported on 1.7% of returns)
37385:
$2,962
Tennessee:
$2,934
Total itemized deductions: $16,356 (26% of AGI, reported on 11.9% of returns)
Here:
$16,356
State:
$18,035
Here:
26.4% of AGI
State:
19.9% of AGI
(% of AGI for various income ranges: 4.1% for AGIs $10k-25k, 5.1% for AGIs $25k-50k, 8.5% for AGIs $50k-75k, 8.8% for AGIs $75k-100k, 11.8% for AGIs over 100k)
Charity contributions deductions: $3,863 (6% of AGI, reported on 9.3% of returns)
Here:
$3,863
State:
$5,167
Here:
5.9% of AGI
State:
5.3% of AGI
(% of AGI for various income ranges: 0.6% for AGIs $10k-25k, 0.6% for AGIs $25k-50k, 1.6% for AGIs $50k-75k, 1.9% for AGIs $75k-100k, 3.2% for AGIs over 100k)
Total tax: $3,152 (reported on 70.4% of returns)
37385:
$3,152
State:
$7,482
(% of AGI for various income ranges: 4.0% for AGIs below $10k, 4.4% for AGIs $10k-25k, 5.7% for AGIs $25k-50k, 8.1% for AGIs $50k-75k, 10.3% for AGIs $75k-100k, 16.9% for AGIs over 100k)
Earned income credit: $1,825 (reported on 27.2% of returns)
Here:
$1,825
State:
$1,826
Percentage of individuals using paid preparers for their 2004 taxes: 60.5%
Here:
61%
State:
60%
(% for various income ranges: 48.2% for AGIs below $10k, 65.5% for AGIs $10k-25k, 61.9% for AGIs $25k-50k, 65.2% for AGIs $50k-75k, 65.3% for AGIs $75k-100k, 66.7% for AGIs over 100k)
Household received Food Stamps/SNAP in the past 12 months: 618 Household did not receive Food Stamps/SNAP in the past 12 months: 2,597
Women who had a birth in the past 12 months: 30 (28 now married, 2 unmarried) Women who did not have a birth in the past 12 months: 1,454 (949 now married, 504 unmarried)
Housing units in zip code 37385 with a mortgage: 1,054 (59 second mortgage, 57 both second mortgage and home equity loan) Houses without a mortgage: 14
Median monthly owner costs for units with a mortgage: $1,113 Median monthly owner costs for units without a mortgage: $327
Residents with income below the poverty level in 2022:
This zip code:
13.2%
Whole state:
13.3%
Residents with income below 50% of the poverty level in 2022:
This zip code:
8.0%
Whole state:
7.1%
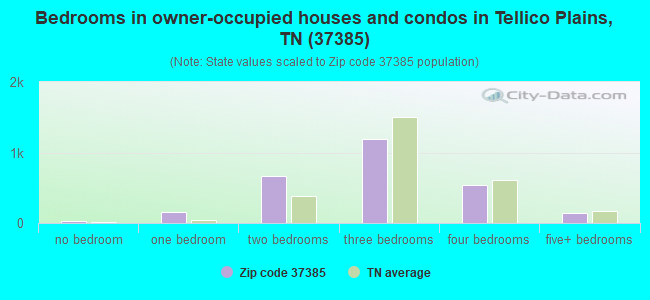
Median number of rooms in houses and condos:
Here:
5.6
State:
6.5
Median number of rooms in apartments:
Here:
4.3
State:
4.4
Notable locations in this zip code not listed on our city pages
Notable locations in zip code 37385: County Corners (A), Pheasant Field Rearing Pools (B), Whigg Cabin (C), Tom Station (D), Caney Branch Observation Site (E), Turkey Creek Valley Observation Site (F), Panther Branch Fishing site (G), Walnut Grove Fishing Site (H), Baby Falls Parking Area (I), Tellico River Roadside Pinic Area (J), Tellico Ranger Station (K), Oosterneck Fishing Site (L), Tellico River Lodge (M), Tellico Beach (N), Brushy Ridge Observation Site (O), Pheasant Field Fishing Site (P), Cut-Off (Q), Rogers Station (R), Sandy Lane (S), Pleasant Field Rearing Pools (T). Display/hide their locations on the map
Churches in zip code 37385 include: Holly Springs Baptist Church (A), First Baptist Church of Tellico Plains (B), Friends Church (C), Towee Falls Church (D), Sandy Lane Church (E), Long Ridge Church (F), Sink Church (G), Unaka Church (H), Unicoi Church (I). Display/hide their locations on the map
Cemeteries: Taylor Cemetery (1), Miller Cemetery (2), Masingale Cemetery (3), Borin Cemetery (4), Coppenger Cemetery (5), Taylor Cemetery (6), Holder Cemetery (7). Display/hide their locations on the map
Lakes and reservoirs: Shortfoots Pond (A), Tellico Lake (B), Rowe Lake (C), Smoky Mountain Christian Camp Lake (D), Elbert Martin Lake (E), Sanford Gray Lake Number One (F), Yeller Nugget Lake (G), Unicoi Lake (H). Display/hide their locations on the map
Streams, rivers, and creeks: Davis Branch (A), Morgan Branch (B), Sinkhole Creek (C), Sixmile Creek (D), Skull Branch (E), Smoky Run (F), Spivey Creek (G), Spurling Branch (H), Sugar Cove Branch (I). Display/hide their locations on the map
Parks in zip code 37385 include: Bald River Falls Recreation Area (1), Big Oak Cove Recreation Area (2), Dam Creek Recreation Area (3), Davis Creek Recreation Area (4), Cherokee Wildlife Management Area (5), Holly Flats Recreation Area (6), North River Recreation Area (7), Spivey Cove Recreation Area (8), State Line Recreation Area (9). Display/hide their locations on the map
In group quarters: 13 (-1 institutionalized population)
Size of family households: 1,296 2-persons, 554 3-persons, 381 4-persons, 218 5-persons, 34 6-persons, 64 7-or-more-persons
Size of nonfamily households: 605 1-person, 75 2-persons
1,298 married couples with children.
556 single-parent households (326 men, 230 women).
95.9% of residents of 37385 zip code speak English at home.
2.0% of residents speak Spanish at home (99% very well, 1% not well).
0.6% of residents speak other Indo-European language at home (85% very well, 15% well).
1.1% of residents speak Asian or Pacific Island language at home (38% very well, 62% well).
0.2% of residents speak other language at home (100% very well).
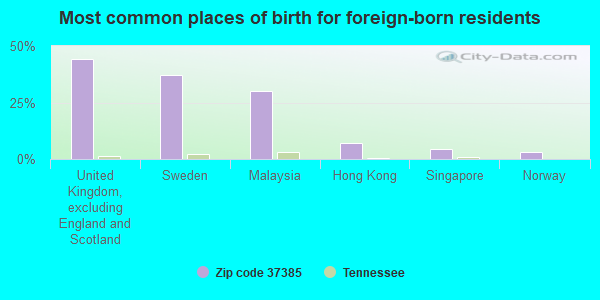
Foreign born population: 197 (2.3%) (59.6% of them are naturalized citizens)
This zip code:
2.3%
Whole state:
5.6%
44%United Kingdom, excluding England and Scotland
37%Sweden
30%Malaysia
7%Hong Kong
5%Singapore
3%Norway
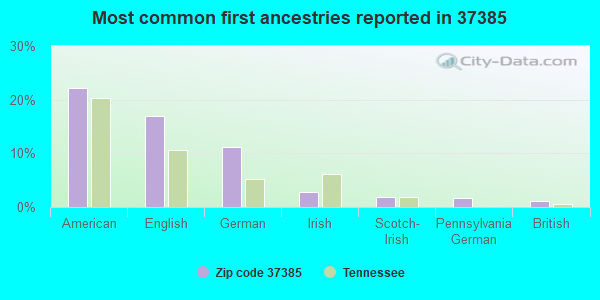
22%American
17%English
11%German
3%Irish
2%Scotch-Irish
2%Pennsylvania German
1%British
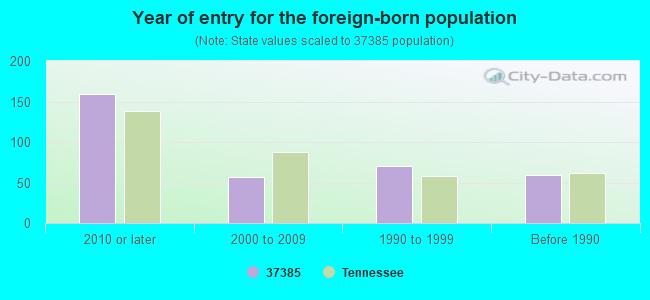
Year of entry for the foreign-born population
1592010 or later
572000 to 2009
701990 to 1999
59Before 1990
Facilities with environmental interests located in this zip code:
COKER CREEK ELEMENTARY SCHOOL (130 RURITAN RD in TELLICO PLAINS, TN)
(Geographic Names Information System) (National Center for Education Statistics) - STATE ID-0010 Organizations: MONROE COUNTY SCHOOL DISTRICT (SCHOOL DISTRICT)
Housing units lacking complete plumbing facilities: 4.1% Housing units lacking complete kitchen facilities: 3.2%
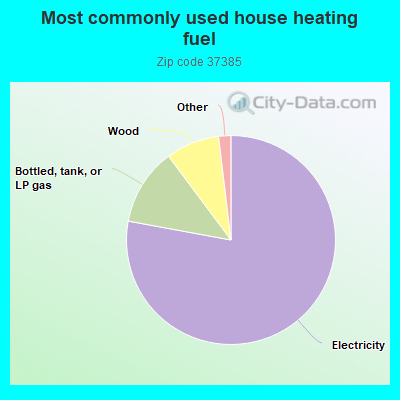
77.9%Electricity
11.9%Bottled, tank, or LP gas
8.3%Wood
0.9%Utility gas
0.6%Other fuel
Population in 1990: 6,459. Population change in the 1990s: +1,415 (+21.9%).
Place of birth for U.S.-born residents:
This state: 5,758
Northeast: 232
Midwest: 747
South: 976
West: 574
68% of the 37385 zip code residents lived in the same house 5 years ago. Out of people who lived in different houses, 60% lived in this county. Out of people who lived in different counties, 50% lived in Tennessee.
94% of the 37385 zip code residents lived in the same house 1 year ago. Out of people who lived in different houses, 41% moved from this county. Out of people who lived in different houses, 22% moved from different county within same state. Out of people who lived in different houses, 35% moved from different state. Out of people who lived in different houses, 10% moved from abroad.
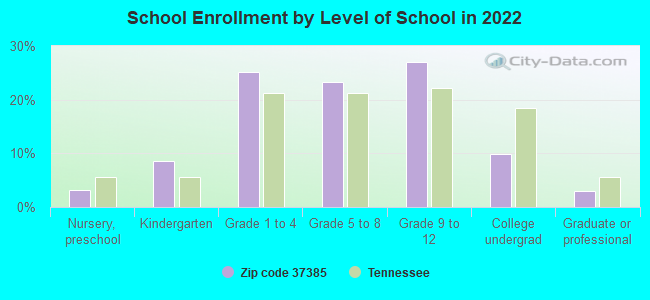
Private vs. public school enrollment:
Students in private schools in grades 1 to 8 (elementary and middle school): 98
Here:
12.1%
Tennessee:
15.0%
Students in private schools in grades 9 to 12 (high school): 32
Here:
7.2%
Tennessee:
16.2%
Students in private undergraduate colleges: 1
Here:
1.1%
Tennessee:
23.5%
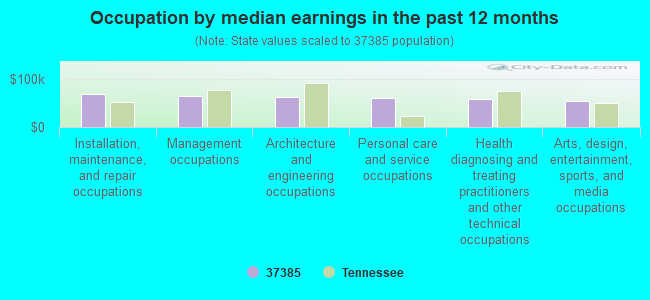
Occupation by median earnings in the past 12 months ($)
67,689Installation, maintenance, and repair occupations
64,681Management occupations
61,975Architecture and engineering occupations
59,651Personal care and service occupations
58,714Health diagnosing and treating practitioners and other technical occupations
54,450Arts, design, entertainment, sports, and media occupations
Companies with federal contracts located in this zip code:
SHORTBARK INDUSTRIES, LLC (116 INDUSTRY RD in TELLICO PLAINS, TN; small business) : $3,198,562 in 16 contractsfrom 2004 to 2006
Contracts for Clothing, Special Purpose, Outerwear, Men's by Defense Logistics Agency, Department of State Signed by year:2000: $0; 2001: $0; 2002: $0; 2003: $0; 2004: $1,551,977; 2005: $1,552,711; 2006: $93,874.
Biggest contracts:
$1,551,930 with Defense Logistics Agency for Clothing, Special Purpose. Signed on 2004-10-22. Completion date: 2005-06-09.
$930,168, same as above.Signed on 2005-02-21. Completion date: 2005-12-23.
$872,809, same as above.Signed on 2005-02-22. Completion date: 2005-12-23.
$798,589, same as above.Signed on 2005-06-08. Completion date: 2005-09-30.
Top industries in this zip code by the number of employees in 2005:
Accommodation and Food Services: Recreational and Vacation Camps (except Campgrounds) (10-19: 1)
People in group quarters in 2010:
7 people in group homes intended for adults
Fatal accident statistics in 2014:
Fatal accident count: 2
Vehicles involved in fatal accidents: 3
Fatal accidents caused by drunken drivers: 0
Fatalities: 2
Persons involved in fatal accidents: 3
Pedestrians involved in fatal accidents: 0
Fatal accident statistics in 2013:
Fatal accident count: 3
Vehicles involved in fatal accidents: 5
Fatal accidents caused by drunken drivers: 1
Fatalities: 3
Persons involved in fatal accidents: 6
Pedestrians involved in fatal accidents: 0
2003 - 2018 National Fire Incident Reporting System (NFIRS) incidents
According to the data from the years 2003 - 2018 the average number of fires per year is 56. The highest number of fire incidents - 123 took place in 2009, and the least - 6 in 2003. The data has a rising trend.
When looking into fire subcategories, the most incidents belonged to: Outside Fires (43.0%), and Structure Fires (41.4%).
Fire incident types reported to NFIRS in Zip Code 37385


 Nearest zip codes: 37885, 37333, 37354, 37329, 28906, 37391.


 According to the data from the years 2003 - 2018 the average number of fires per year is 56. The highest number of fire incidents - 123 took place in 2009, and the least - 6 in 2003. The data has a rising trend.
 When looking into fire subcategories, the most incidents belonged to: Outside Fires (43.0%), and Structure Fires (41.4%).