Estimated zip code population in 2022: 22,678
Zip code population in 2010: 19,560
Zip code population in 2000: 16,259
Houses and condos: 10,418
Renter-occupied apartments: 2,296
% of renters here:
24%State:
33%
March 2022 cost of living index in zip code 37615: 83.2
(low, U.S. average is 100)
Land area: 36.4
sq. mi.
Water area: 1.3
sq. mi.
Population density: 623 people per square mile (low).
OSM Map
General Map
Google Map
MSN Map
OSM Map
General Map
Google Map
MSN Map
OSM Map
General Map
Google Map
MSN Map
OSM Map
General Map
Google Map
MSN Map
Please wait while loading the map...
Real estate property taxes paid for housing units in 2022:
This zip code:
0.4% ($1,338)Tennessee:
0.5% ($1,376)
Median real estate property taxes paid for housing units with mortgages in 2022: $1,344 (0.4%)
Median real estate property taxes paid for housing units with no mortgage in 2022: $1,334 (0.4%)
Profiles of local businesses
Business Search - 14 Million verified businesses
Males: 11,282 Females: 11,395
For population 25 years and over in 37615:
High school or higher: 96.6%Bachelor's degree or higher: 43.1%Graduate or professional degree: 17.5%Unemployed: 2.8%Mean travel time to work (commute): 21.2 minutes
For population 15 years and over in 37615:
Never married: 26.1%Now married: 58.4%Separated: 0.7%Widowed: 5.2%Divorced: 9.6%
Zip code 37615 compared to state average:
Black race population percentage significantly below state average. Hispanic race population percentage below state average. Median age above state average. Foreign-born population percentage significantly below state average. Length of stay since moving in above state average. House age below state average. 20,629 91.0% White 671 3.0% Hispanic or Latino 574 2.5% Two or more races 432 1.9% Black 292 1.3% Asian 44 0.2% American Indian 33 0.1% Some other race
Data:
Median household income ($)
Median household income (% change since 2000)
Household income diversity
Ratio of average income to average house value (%)
Ratio of average income to average rent
Median household income ($) - White
Median household income ($) - Black or African American
Median household income ($) - Asian
Median household income ($) - Hispanic or Latino
Median household income ($) - American Indian and Alaska Native
Median household income ($) - Multirace
Median household income ($) - Other Race
Median household income for houses/condos with a mortgage ($)
Median household income for apartments without a mortgage ($)
Races - White alone (%)
Races - White alone (% change since 2000)
Races - Black alone (%)
Races - Black alone (% change since 2000)
Races - American Indian alone (%)
Races - American Indian alone (% change since 2000)
Races - Asian alone (%)
Races - Asian alone (% change since 2000)
Races - Hispanic (%)
Races - Hispanic (% change since 2000)
Races - Native Hawaiian and Other Pacific Islander alone (%)
Races - Native Hawaiian and Other Pacific Islander alone (% change since 2000)
Races - Two or more races (%)
Races - Two or more races (% change since 2000)
Races - Other race alone (%)
Races - Other race alone (% change since 2000)
Racial diversity
Unemployment (%)
Unemployment (% change since 2000)
Unemployment (%) - White
Unemployment (%) - Black or African American
Unemployment (%) - Asian
Unemployment (%) - Hispanic or Latino
Unemployment (%) - American Indian and Alaska Native
Unemployment (%) - Multirace
Unemployment (%) - Other Race
Population density (people per square mile)
Population - Males (%)
Population - Females (%)
Population - Males (%) - White
Population - Males (%) - Black or African American
Population - Males (%) - Asian
Population - Males (%) - Hispanic or Latino
Population - Males (%) - American Indian and Alaska Native
Population - Males (%) - Multirace
Population - Males (%) - Other Race
Population - Females (%) - White
Population - Females (%) - Black or African American
Population - Females (%) - Asian
Population - Females (%) - Hispanic or Latino
Population - Females (%) - American Indian and Alaska Native
Population - Females (%) - Multirace
Population - Females (%) - Other Race
Coronavirus confirmed cases (May 29, 2024)
Deaths caused by coronavirus (May 29, 2024)
Coronavirus confirmed cases (per 100k population) (May 29, 2024)
Deaths caused by coronavirus (per 100k population) (May 29, 2024)
Daily increase in number of cases (May 29, 2024)
Weekly increase in number of cases (May 29, 2024)
Cases doubled (in days) (May 29, 2024)
Hospitalized patients (Apr 18, 2022)
Negative test results (Apr 18, 2022)
Total test results (Apr 18, 2022)
COVID Vaccine doses distributed (per 100k population) (Sep 19, 2023)
COVID Vaccine doses administered (per 100k population) (Sep 19, 2023)
COVID Vaccine doses distributed (Sep 19, 2023)
COVID Vaccine doses administered (Sep 19, 2023)
Likely homosexual households (%)
Likely homosexual households (% change since 2000)
Likely homosexual households - Lesbian couples (%)
Likely homosexual households - Lesbian couples (% change since 2000)
Likely homosexual households - Gay men (%)
Likely homosexual households - Gay men (% change since 2000)
Cost of living index
Median gross rent ($)
Median contract rent ($)
Median monthly housing costs ($)
Median house or condo value ($)
Median house or condo value ($ change since 2000)
Mean house or condo value by units in structure - 1, detached ($)
Mean house or condo value by units in structure - 1, attached ($)
Mean house or condo value by units in structure - 2 ($)
Mean house or condo value by units in structure by units in structure - 3 or 4 ($)
Mean house or condo value by units in structure - 5 or more ($)
Mean house or condo value by units in structure - Boat, RV, van, etc. ($)
Mean house or condo value by units in structure - Mobile home ($)
Median house or condo value ($) - White
Median house or condo value ($) - Black or African American
Median house or condo value ($) - Asian
Median house or condo value ($) - Hispanic or Latino
Median house or condo value ($) - American Indian and Alaska Native
Median house or condo value ($) - Multirace
Median house or condo value ($) - Other Race
Median resident age
Resident age diversity
Median resident age - Males
Median resident age - Females
Median resident age - White
Median resident age - Black or African American
Median resident age - Asian
Median resident age - Hispanic or Latino
Median resident age - American Indian and Alaska Native
Median resident age - Multirace
Median resident age - Other Race
Median resident age - Males - White
Median resident age - Males - Black or African American
Median resident age - Males - Asian
Median resident age - Males - Hispanic or Latino
Median resident age - Males - American Indian and Alaska Native
Median resident age - Males - Multirace
Median resident age - Males - Other Race
Median resident age - Females - White
Median resident age - Females - Black or African American
Median resident age - Females - Asian
Median resident age - Females - Hispanic or Latino
Median resident age - Females - American Indian and Alaska Native
Median resident age - Females - Multirace
Median resident age - Females - Other Race
Commute - mean travel time to work (minutes)
Travel time to work - Less than 5 minutes (%)
Travel time to work - Less than 5 minutes (% change since 2000)
Travel time to work - 5 to 9 minutes (%)
Travel time to work - 5 to 9 minutes (% change since 2000)
Travel time to work - 10 to 19 minutes (%)
Travel time to work - 10 to 19 minutes (% change since 2000)
Travel time to work - 20 to 29 minutes (%)
Travel time to work - 20 to 29 minutes (% change since 2000)
Travel time to work - 30 to 39 minutes (%)
Travel time to work - 30 to 39 minutes (% change since 2000)
Travel time to work - 40 to 59 minutes (%)
Travel time to work - 40 to 59 minutes (% change since 2000)
Travel time to work - 60 to 89 minutes (%)
Travel time to work - 60 to 89 minutes (% change since 2000)
Travel time to work - 90 or more minutes (%)
Travel time to work - 90 or more minutes (% change since 2000)
Marital status - Never married (%)
Marital status - Now married (%)
Marital status - Separated (%)
Marital status - Widowed (%)
Marital status - Divorced (%)
Median family income ($)
Median family income (% change since 2000)
Median non-family income ($)
Median non-family income (% change since 2000)
Median per capita income ($)
Median per capita income (% change since 2000)
Median family income ($) - White
Median family income ($) - Black or African American
Median family income ($) - Asian
Median family income ($) - Hispanic or Latino
Median family income ($) - American Indian and Alaska Native
Median family income ($) - Multirace
Median family income ($) - Other Race
Median year house/condo built
Median year apartment built
Year house built - Built 2005 or later (%)
Year house built - Built 2000 to 2004 (%)
Year house built - Built 1990 to 1999 (%)
Year house built - Built 1980 to 1989 (%)
Year house built - Built 1970 to 1979 (%)
Year house built - Built 1960 to 1969 (%)
Year house built - Built 1950 to 1959 (%)
Year house built - Built 1940 to 1949 (%)
Year house built - Built 1939 or earlier (%)
Average household size
Household density (households per square mile)
Average household size - White
Average household size - Black or African American
Average household size - Asian
Average household size - Hispanic or Latino
Average household size - American Indian and Alaska Native
Average household size - Multirace
Average household size - Other Race
Occupied housing units (%)
Vacant housing units (%)
Owner occupied housing units (%)
Renter occupied housing units (%)
Vacancy status - For rent (%)
Vacancy status - For sale only (%)
Vacancy status - Rented or sold, not occupied (%)
Vacancy status - For seasonal, recreational, or occasional use (%)
Vacancy status - For migrant workers (%)
Vacancy status - Other vacant (%)
Residents with income below the poverty level (%)
Residents with income below 50% of the poverty level (%)
Children below poverty level (%)
Poor families by family type - Married-couple family (%)
Poor families by family type - Male, no wife present (%)
Poor families by family type - Female, no husband present (%)
Poverty status for native-born residents (%)
Poverty status for foreign-born residents (%)
Poverty among high school graduates not in families (%)
Poverty among people who did not graduate high school not in families (%)
Residents with income below the poverty level (%) - White
Residents with income below the poverty level (%) - Black or African American
Residents with income below the poverty level (%) - Asian
Residents with income below the poverty level (%) - Hispanic or Latino
Residents with income below the poverty level (%) - American Indian and Alaska Native
Residents with income below the poverty level (%) - Multirace
Residents with income below the poverty level (%) - Other Race
Air pollution - Air Quality Index (AQI)
Air pollution - CO
Air pollution - NO2
Air pollution - SO2
Air pollution - Ozone
Air pollution - PM10
Air pollution - PM25
Air pollution - Pb
Crime - Murders per 100,000 population
Crime - Rapes per 100,000 population
Crime - Robberies per 100,000 population
Crime - Assaults per 100,000 population
Crime - Burglaries per 100,000 population
Crime - Thefts per 100,000 population
Crime - Auto thefts per 100,000 population
Crime - Arson per 100,000 population
Crime - City-data.com crime index
Crime - Violent crime index
Crime - Property crime index
Crime - Murders per 100,000 population (5 year average)
Crime - Rapes per 100,000 population (5 year average)
Crime - Robberies per 100,000 population (5 year average)
Crime - Assaults per 100,000 population (5 year average)
Crime - Burglaries per 100,000 population (5 year average)
Crime - Thefts per 100,000 population (5 year average)
Crime - Auto thefts per 100,000 population (5 year average)
Crime - Arson per 100,000 population (5 year average)
Crime - City-data.com crime index (5 year average)
Crime - Violent crime index (5 year average)
Crime - Property crime index (5 year average)
1996 Presidential Elections Results (%) - Democratic Party (Clinton)
1996 Presidential Elections Results (%) - Republican Party (Dole)
1996 Presidential Elections Results (%) - Other
2000 Presidential Elections Results (%) - Democratic Party (Gore)
2000 Presidential Elections Results (%) - Republican Party (Bush)
2000 Presidential Elections Results (%) - Other
2004 Presidential Elections Results (%) - Democratic Party (Kerry)
2004 Presidential Elections Results (%) - Republican Party (Bush)
2004 Presidential Elections Results (%) - Other
2008 Presidential Elections Results (%) - Democratic Party (Obama)
2008 Presidential Elections Results (%) - Republican Party (McCain)
2008 Presidential Elections Results (%) - Other
2012 Presidential Elections Results (%) - Democratic Party (Obama)
2012 Presidential Elections Results (%) - Republican Party (Romney)
2012 Presidential Elections Results (%) - Other
2016 Presidential Elections Results (%) - Democratic Party (Clinton)
2016 Presidential Elections Results (%) - Republican Party (Trump)
2016 Presidential Elections Results (%) - Other
2020 Presidential Elections Results (%) - Democratic Party (Biden)
2020 Presidential Elections Results (%) - Republican Party (Trump)
2020 Presidential Elections Results (%) - Other
Ancestries Reported - Arab (%)
Ancestries Reported - Czech (%)
Ancestries Reported - Danish (%)
Ancestries Reported - Dutch (%)
Ancestries Reported - English (%)
Ancestries Reported - French (%)
Ancestries Reported - French Canadian (%)
Ancestries Reported - German (%)
Ancestries Reported - Greek (%)
Ancestries Reported - Hungarian (%)
Ancestries Reported - Irish (%)
Ancestries Reported - Italian (%)
Ancestries Reported - Lithuanian (%)
Ancestries Reported - Norwegian (%)
Ancestries Reported - Polish (%)
Ancestries Reported - Portuguese (%)
Ancestries Reported - Russian (%)
Ancestries Reported - Scotch-Irish (%)
Ancestries Reported - Scottish (%)
Ancestries Reported - Slovak (%)
Ancestries Reported - Subsaharan African (%)
Ancestries Reported - Swedish (%)
Ancestries Reported - Swiss (%)
Ancestries Reported - Ukrainian (%)
Ancestries Reported - United States (%)
Ancestries Reported - Welsh (%)
Ancestries Reported - West Indian (%)
Ancestries Reported - Other (%)
Educational Attainment - No schooling completed (%)
Educational Attainment - Less than high school (%)
Educational Attainment - High school or equivalent (%)
Educational Attainment - Less than 1 year of college (%)
Educational Attainment - 1 or more years of college (%)
Educational Attainment - Associate degree (%)
Educational Attainment - Bachelor's degree (%)
Educational Attainment - Master's degree (%)
Educational Attainment - Professional school degree (%)
Educational Attainment - Doctorate degree (%)
School Enrollment - Nursery, preschool (%)
School Enrollment - Kindergarten (%)
School Enrollment - Grade 1 to 4 (%)
School Enrollment - Grade 5 to 8 (%)
School Enrollment - Grade 9 to 12 (%)
School Enrollment - College undergrad (%)
School Enrollment - Graduate or professional (%)
School Enrollment - Not enrolled in school (%)
School enrollment - Public schools (%)
School enrollment - Private schools (%)
School enrollment - Not enrolled (%)
Median number of rooms in houses and condos
Median number of rooms in apartments
Housing units lacking complete plumbing facilities (%)
Housing units lacking complete kitchen facilities (%)
Density of houses
Urban houses (%)
Rural houses (%)
Households with people 60 years and over (%)
Households with people 65 years and over (%)
Households with people 75 years and over (%)
Households with one or more nonrelatives (%)
Households with no nonrelatives (%)
Population in households (%)
Family households (%)
Nonfamily households (%)
Population in families (%)
Family households with own children (%)
Median number of bedrooms in owner occupied houses
Mean number of bedrooms in owner occupied houses
Median number of bedrooms in renter occupied houses
Mean number of bedrooms in renter occupied houses
Median number of vehichles in owner occupied houses
Mean number of vehichles in owner occupied houses
Median number of vehichles in renter occupied houses
Mean number of vehichles in renter occupied houses
Mortgage status - with mortgage (%)
Mortgage status - with second mortgage (%)
Mortgage status - with home equity loan (%)
Mortgage status - with both second mortgage and home equity loan (%)
Mortgage status - without a mortgage (%)
Average family size
Average family size - White
Average family size - Black or African American
Average family size - Asian
Average family size - Hispanic or Latino
Average family size - American Indian and Alaska Native
Average family size - Multirace
Average family size - Other Race
Geographical mobility - Same house 1 year ago (%)
Geographical mobility - Moved within same county (%)
Geographical mobility - Moved from different county within same state (%)
Geographical mobility - Moved from different state (%)
Geographical mobility - Moved from abroad (%)
Place of birth - Born in state of residence (%)
Place of birth - Born in other state (%)
Place of birth - Native, outside of US (%)
Place of birth - Foreign born (%)
Housing units in structures - 1, detached (%)
Housing units in structures - 1, attached (%)
Housing units in structures - 2 (%)
Housing units in structures - 3 or 4 (%)
Housing units in structures - 5 to 9 (%)
Housing units in structures - 10 to 19 (%)
Housing units in structures - 20 to 49 (%)
Housing units in structures - 50 or more (%)
Housing units in structures - Mobile home (%)
Housing units in structures - Boat, RV, van, etc. (%)
House/condo owner moved in on average (years ago)
Renter moved in on average (years ago)
Year householder moved into unit - Moved in 1999 to March 2000 (%)
Year householder moved into unit - Moved in 1995 to 1998 (%)
Year householder moved into unit - Moved in 1990 to 1994 (%)
Year householder moved into unit - Moved in 1980 to 1989 (%)
Year householder moved into unit - Moved in 1970 to 1979 (%)
Year householder moved into unit - Moved in 1969 or earlier (%)
Means of transportation to work - Drove car alone (%)
Means of transportation to work - Carpooled (%)
Means of transportation to work - Public transportation (%)
Means of transportation to work - Bus or trolley bus (%)
Means of transportation to work - Streetcar or trolley car (%)
Means of transportation to work - Subway or elevated (%)
Means of transportation to work - Railroad (%)
Means of transportation to work - Ferryboat (%)
Means of transportation to work - Taxicab (%)
Means of transportation to work - Motorcycle (%)
Means of transportation to work - Bicycle (%)
Means of transportation to work - Walked (%)
Means of transportation to work - Other means (%)
Working at home (%)
Industry diversity
Most Common Industries - Agriculture, forestry, fishing and hunting, and mining (%)
Most Common Industries - Agriculture, forestry, fishing and hunting (%)
Most Common Industries - Mining, quarrying, and oil and gas extraction (%)
Most Common Industries - Construction (%)
Most Common Industries - Manufacturing (%)
Most Common Industries - Wholesale trade (%)
Most Common Industries - Retail trade (%)
Most Common Industries - Transportation and warehousing, and utilities (%)
Most Common Industries - Transportation and warehousing (%)
Most Common Industries - Utilities (%)
Most Common Industries - Information (%)
Most Common Industries - Finance and insurance, and real estate and rental and leasing (%)
Most Common Industries - Finance and insurance (%)
Most Common Industries - Real estate and rental and leasing (%)
Most Common Industries - Professional, scientific, and management, and administrative and waste management services (%)
Most Common Industries - Professional, scientific, and technical services (%)
Most Common Industries - Management of companies and enterprises (%)
Most Common Industries - Administrative and support and waste management services (%)
Most Common Industries - Educational services, and health care and social assistance (%)
Most Common Industries - Educational services (%)
Most Common Industries - Health care and social assistance (%)
Most Common Industries - Arts, entertainment, and recreation, and accommodation and food services (%)
Most Common Industries - Arts, entertainment, and recreation (%)
Most Common Industries - Accommodation and food services (%)
Most Common Industries - Other services, except public administration (%)
Most Common Industries - Public administration (%)
Occupation diversity
Most Common Occupations - Management, business, science, and arts occupations (%)
Most Common Occupations - Management, business, and financial occupations (%)
Most Common Occupations - Management occupations (%)
Most Common Occupations - Business and financial operations occupations (%)
Most Common Occupations - Computer, engineering, and science occupations (%)
Most Common Occupations - Computer and mathematical occupations (%)
Most Common Occupations - Architecture and engineering occupations (%)
Most Common Occupations - Life, physical, and social science occupations (%)
Most Common Occupations - Education, legal, community service, arts, and media occupations (%)
Most Common Occupations - Community and social service occupations (%)
Most Common Occupations - Legal occupations (%)
Most Common Occupations - Education, training, and library occupations (%)
Most Common Occupations - Arts, design, entertainment, sports, and media occupations (%)
Most Common Occupations - Healthcare practitioners and technical occupations (%)
Most Common Occupations - Health diagnosing and treating practitioners and other technical occupations (%)
Most Common Occupations - Health technologists and technicians (%)
Most Common Occupations - Service occupations (%)
Most Common Occupations - Healthcare support occupations (%)
Most Common Occupations - Protective service occupations (%)
Most Common Occupations - Fire fighting and prevention, and other protective service workers including supervisors (%)
Most Common Occupations - Law enforcement workers including supervisors (%)
Most Common Occupations - Food preparation and serving related occupations (%)
Most Common Occupations - Building and grounds cleaning and maintenance occupations (%)
Most Common Occupations - Personal care and service occupations (%)
Most Common Occupations - Sales and office occupations (%)
Most Common Occupations - Sales and related occupations (%)
Most Common Occupations - Office and administrative support occupations (%)
Most Common Occupations - Natural resources, construction, and maintenance occupations (%)
Most Common Occupations - Farming, fishing, and forestry occupations (%)
Most Common Occupations - Construction and extraction occupations (%)
Most Common Occupations - Installation, maintenance, and repair occupations (%)
Most Common Occupations - Production, transportation, and material moving occupations (%)
Most Common Occupations - Production occupations (%)
Most Common Occupations - Transportation occupations (%)
Most Common Occupations - Material moving occupations (%)
People in Group quarters - Institutionalized population (%)
People in Group quarters - Correctional institutions (%)
People in Group quarters - Federal prisons and detention centers (%)
People in Group quarters - Halfway houses (%)
People in Group quarters - Local jails and other confinement facilities (including police lockups) (%)
People in Group quarters - Military disciplinary barracks (%)
People in Group quarters - State prisons (%)
People in Group quarters - Other types of correctional institutions (%)
People in Group quarters - Nursing homes (%)
People in Group quarters - Hospitals/wards, hospices, and schools for the handicapped (%)
People in Group quarters - Hospitals/wards and hospices for chronically ill (%)
People in Group quarters - Hospices or homes for chronically ill (%)
People in Group quarters - Military hospitals or wards for chronically ill (%)
People in Group quarters - Other hospitals or wards for chronically ill (%)
People in Group quarters - Hospitals or wards for drug/alcohol abuse (%)
People in Group quarters - Mental (Psychiatric) hospitals or wards (%)
People in Group quarters - Schools, hospitals, or wards for the mentally retarded (%)
People in Group quarters - Schools, hospitals, or wards for the physically handicapped (%)
People in Group quarters - Institutions for the deaf (%)
People in Group quarters - Institutions for the blind (%)
People in Group quarters - Orthopedic wards and institutions for the physically handicapped (%)
People in Group quarters - Wards in general hospitals for patients who have no usual home elsewhere (%)
People in Group quarters - Wards in military hospitals for patients who have no usual home elsewhere (%)
People in Group quarters - Juvenile institutions (%)
People in Group quarters - Long-term care (%)
People in Group quarters - Homes for abused, dependent, and neglected children (%)
People in Group quarters - Residential treatment centers for emotionally disturbed children (%)
People in Group quarters - Training schools for juvenile delinquents (%)
People in Group quarters - Short-term care, detention or diagnostic centers for delinquent children (%)
People in Group quarters - Type of juvenile institution unknown (%)
People in Group quarters - Noninstitutionalized population (%)
People in Group quarters - College dormitories (includes college quarters off campus) (%)
People in Group quarters - Military quarters (%)
People in Group quarters - On base (%)
People in Group quarters - Barracks, unaccompanied personnel housing (UPH), (Enlisted/Officer), ;and similar group living quarters for military personnel (%)
People in Group quarters - Transient quarters for temporary residents (%)
People in Group quarters - Military ships (%)
People in Group quarters - Group homes (%)
People in Group quarters - Homes or halfway houses for drug/alcohol abuse (%)
People in Group quarters - Homes for the mentally ill (%)
People in Group quarters - Homes for the mentally retarded (%)
People in Group quarters - Homes for the physically handicapped (%)
People in Group quarters - Other group homes (%)
People in Group quarters - Religious group quarters (%)
People in Group quarters - Dormitories (%)
People in Group quarters - Agriculture workers' dormitories on farms (%)
People in Group quarters - Job Corps and vocational training facilities (%)
People in Group quarters - Other workers' dormitories (%)
People in Group quarters - Crews of maritime vessels (%)
People in Group quarters - Other nonhousehold living situations (%)
People in Group quarters - Other noninstitutional group quarters (%)
Residents speaking English at home (%)
Residents speaking English at home - Born in the United States (%)
Residents speaking English at home - Native, born elsewhere (%)
Residents speaking English at home - Foreign born (%)
Residents speaking Spanish at home (%)
Residents speaking Spanish at home - Born in the United States (%)
Residents speaking Spanish at home - Native, born elsewhere (%)
Residents speaking Spanish at home - Foreign born (%)
Residents speaking other language at home (%)
Residents speaking other language at home - Born in the United States (%)
Residents speaking other language at home - Native, born elsewhere (%)
Residents speaking other language at home - Foreign born (%)
Class of Workers - Employee of private company (%)
Class of Workers - Self-employed in own incorporated business (%)
Class of Workers - Private not-for-profit wage and salary workers (%)
Class of Workers - Local government workers (%)
Class of Workers - State government workers (%)
Class of Workers - Federal government workers (%)
Class of Workers - Self-employed workers in own not incorporated business and Unpaid family workers (%)
House heating fuel used in houses and condos - Utility gas (%)
House heating fuel used in houses and condos - Bottled, tank, or LP gas (%)
House heating fuel used in houses and condos - Electricity (%)
House heating fuel used in houses and condos - Fuel oil, kerosene, etc. (%)
House heating fuel used in houses and condos - Coal or coke (%)
House heating fuel used in houses and condos - Wood (%)
House heating fuel used in houses and condos - Solar energy (%)
House heating fuel used in houses and condos - Other fuel (%)
House heating fuel used in houses and condos - No fuel used (%)
House heating fuel used in apartments - Utility gas (%)
House heating fuel used in apartments - Bottled, tank, or LP gas (%)
House heating fuel used in apartments - Electricity (%)
House heating fuel used in apartments - Fuel oil, kerosene, etc. (%)
House heating fuel used in apartments - Coal or coke (%)
House heating fuel used in apartments - Wood (%)
House heating fuel used in apartments - Solar energy (%)
House heating fuel used in apartments - Other fuel (%)
House heating fuel used in apartments - No fuel used (%)
Armed forces status - In Armed Forces (%)
Armed forces status - Civilian (%)
Armed forces status - Civilian - Veteran (%)
Armed forces status - Civilian - Nonveteran (%)
Fatal accidents locations in years 2005-2021
Fatal accidents locations in 2005
Fatal accidents locations in 2006
Fatal accidents locations in 2007
Fatal accidents locations in 2008
Fatal accidents locations in 2009
Fatal accidents locations in 2010
Fatal accidents locations in 2011
Fatal accidents locations in 2012
Fatal accidents locations in 2013
Fatal accidents locations in 2014
Fatal accidents locations in 2015
Fatal accidents locations in 2016
Fatal accidents locations in 2017
Fatal accidents locations in 2018
Fatal accidents locations in 2019
Fatal accidents locations in 2020
Fatal accidents locations in 2021
Alcohol use - People drinking some alcohol every month (%)
Alcohol use - People not drinking at all (%)
Alcohol use - Average days/month drinking alcohol
Alcohol use - Average drinks/week
Alcohol use - Average days/year people drink much
Audiometry - Average condition of hearing (%)
Audiometry - People that can hear a whisper from across a quiet room (%)
Audiometry - People that can hear normal voice from across a quiet room (%)
Audiometry - Ears ringing, roaring, buzzing (%)
Audiometry - Had a job exposure to loud noise (%)
Audiometry - Had off-work exposure to loud noise (%)
Blood Pressure & Cholesterol - Has high blood pressure (%)
Blood Pressure & Cholesterol - Checking blood pressure at home (%)
Blood Pressure & Cholesterol - Frequently checking blood cholesterol (%)
Blood Pressure & Cholesterol - Has high cholesterol level (%)
Consumer Behavior - Money monthly spent on food at supermarket/grocery store
Consumer Behavior - Money monthly spent on food at other stores
Consumer Behavior - Money monthly spent on eating out
Consumer Behavior - Money monthly spent on carryout/delivered foods
Consumer Behavior - Income spent on food at supermarket/grocery store (%)
Consumer Behavior - Income spent on food at other stores (%)
Consumer Behavior - Income spent on eating out (%)
Consumer Behavior - Income spent on carryout/delivered foods (%)
Current Health Status - General health condition (%)
Current Health Status - Blood donors (%)
Current Health Status - Has blood ever tested for HIV virus (%)
Current Health Status - Left-handed people (%)
Dermatology - People using sunscreen (%)
Diabetes - Diabetics (%)
Diabetes - Had a blood test for high blood sugar (%)
Diabetes - People taking insulin (%)
Diet Behavior & Nutrition - Diet health (%)
Diet Behavior & Nutrition - Milk product consumption (# of products/month)
Diet Behavior & Nutrition - Meals not home prepared (#/week)
Diet Behavior & Nutrition - Meals from fast food or pizza place (#/week)
Diet Behavior & Nutrition - Ready-to-eat foods (#/month)
Diet Behavior & Nutrition - Frozen meals/pizza (#/month)
Drug Use - People that ever used marijuana or hashish (%)
Drug Use - Ever used hard drugs (%)
Drug Use - Ever used any form of cocaine (%)
Drug Use - Ever used heroin (%)
Drug Use - Ever used methamphetamine (%)
Health Insurance - People covered by health insurance (%)
Kidney Conditions-Urology - Avg. # of times urinating at night
Medical Conditions - People with asthma (%)
Medical Conditions - People with anemia (%)
Medical Conditions - People with psoriasis (%)
Medical Conditions - People with overweight (%)
Medical Conditions - Elderly people having difficulties in thinking or remembering (%)
Medical Conditions - People who ever received blood transfusion (%)
Medical Conditions - People having trouble seeing even with glass/contacts (%)
Medical Conditions - People with arthritis (%)
Medical Conditions - People with gout (%)
Medical Conditions - People with congestive heart failure (%)
Medical Conditions - People with coronary heart disease (%)
Medical Conditions - People with angina pectoris (%)
Medical Conditions - People who ever had heart attack (%)
Medical Conditions - People who ever had stroke (%)
Medical Conditions - People with emphysema (%)
Medical Conditions - People with thyroid problem (%)
Medical Conditions - People with chronic bronchitis (%)
Medical Conditions - People with any liver condition (%)
Medical Conditions - People who ever had cancer or malignancy (%)
Mental Health - People who have little interest in doing things (%)
Mental Health - People feeling down, depressed, or hopeless (%)
Mental Health - People who have trouble sleeping or sleeping too much (%)
Mental Health - People feeling tired or having little energy (%)
Mental Health - People with poor appetite or overeating (%)
Mental Health - People feeling bad about themself (%)
Mental Health - People who have trouble concentrating on things (%)
Mental Health - People moving or speaking slowly or too fast (%)
Mental Health - People having thoughts they would be better off dead (%)
Oral Health - Average years since last visit a dentist
Oral Health - People embarrassed because of mouth (%)
Oral Health - People with gum disease (%)
Oral Health - General health of teeth and gums (%)
Oral Health - Average days a week using dental floss/device
Oral Health - Average days a week using mouthwash for dental problem
Oral Health - Average number of teeth
Pesticide Use - Households using pesticides to control insects (%)
Pesticide Use - Households using pesticides to kill weeds (%)
Physical Activity - People doing vigorous-intensity work activities (%)
Physical Activity - People doing moderate-intensity work activities (%)
Physical Activity - People walking or bicycling (%)
Physical Activity - People doing vigorous-intensity recreational activities (%)
Physical Activity - People doing moderate-intensity recreational activities (%)
Physical Activity - Average hours a day doing sedentary activities
Physical Activity - Average hours a day watching TV or videos
Physical Activity - Average hours a day using computer
Physical Functioning - People having limitations keeping them from working (%)
Physical Functioning - People limited in amount of work they can do (%)
Physical Functioning - People that need special equipment to walk (%)
Physical Functioning - People experiencing confusion/memory problems (%)
Physical Functioning - People requiring special healthcare equipment (%)
Prescription Medications - Average number of prescription medicines taking
Preventive Aspirin Use - Adults 40+ taking low-dose aspirin (%)
Reproductive Health - Vaginal deliveries (%)
Reproductive Health - Cesarean deliveries (%)
Reproductive Health - Deliveries resulted in a live birth (%)
Reproductive Health - Pregnancies resulted in a delivery (%)
Reproductive Health - Women breastfeeding newborns (%)
Reproductive Health - Women that had a hysterectomy (%)
Reproductive Health - Women that had both ovaries removed (%)
Reproductive Health - Women that have ever taken birth control pills (%)
Reproductive Health - Women taking birth control pills (%)
Reproductive Health - Women that have ever used Depo-Provera or injectables (%)
Reproductive Health - Women that have ever used female hormones (%)
Sexual Behavior - People 18+ that ever had sex (vaginal, anal, or oral) (%)
Sexual Behavior - Males 18+ that ever had vaginal sex with a woman (%)
Sexual Behavior - Males 18+ that ever performed oral sex on a woman (%)
Sexual Behavior - Males 18+ that ever had anal sex with a woman (%)
Sexual Behavior - Males 18+ that ever had any sex with a man (%)
Sexual Behavior - Females 18+ that ever had vaginal sex with a man (%)
Sexual Behavior - Females 18+ that ever performed oral sex on a man (%)
Sexual Behavior - Females 18+ that ever had anal sex with a man (%)
Sexual Behavior - Females 18+ that ever had any kind of sex with a woman (%)
Sexual Behavior - Average age people first had sex
Sexual Behavior - Average number of female sex partners in lifetime (males 18+)
Sexual Behavior - Average number of female vaginal sex partners in lifetime (males 18+)
Sexual Behavior - Average age people first performed oral sex on a woman (18+)
Sexual Behavior - Average number of woman performed oral sex on in lifetime (18+)
Sexual Behavior - Average number of male sex partners in lifetime (males 18+)
Sexual Behavior - Average number of male anal sex partners in lifetime (males 18+)
Sexual Behavior - Average age people first performed oral sex on a man (18+)
Sexual Behavior - Average number of male oral sex partners in lifetime (18+)
Sexual Behavior - People using protection when performing oral sex (%)
Sexual Behavior - Average number of times people have vaginal or anal sex a year
Sexual Behavior - People having sex without condom (%)
Sexual Behavior - Average number of male sex partners in lifetime (females 18+)
Sexual Behavior - Average number of male vaginal sex partners in lifetime (females 18+)
Sexual Behavior - Average number of female sex partners in lifetime (females 18+)
Sexual Behavior - Circumcised males 18+ (%)
Sleep Disorders - Average hours sleeping at night
Sleep Disorders - People that has trouble sleeping (%)
Smoking-Cigarette Use - People smoking cigarettes (%)
Taste & Smell - People 40+ having problems with smell (%)
Taste & Smell - People 40+ having problems with taste (%)
Taste & Smell - People 40+ that ever had wisdom teeth removed (%)
Taste & Smell - People 40+ that ever had tonsils teeth removed (%)
Taste & Smell - People 40+ that ever had a loss of consciousness because of a head injury (%)
Taste & Smell - People 40+ that ever had a broken nose or other serious injury to face or skull (%)
Taste & Smell - People 40+ that ever had two or more sinus infections (%)
Weight - Average height (inches)
Weight - Average weight (pounds)
Weight - Average BMI
Weight - People that are obese (%)
Weight - People that ever were obese (%)
Weight - People trying to lose weight (%)
Urban population: 17,349
Rural population: 5,328
Estimated median house/condo value in 2022: $300,874
37615:
$300,874Tennessee:
$284,800
According to our research of Tennessee and other state lists, there were 34 registered sex offenders living in 37615 zip code as of May 29, 2024 . The ratio of all residents to sex offenders in zip code 37615 is 633 to 1.The ratio of registered sex offenders to all residents in this zip code is lower than the state average.
Median resident age: This zip code:
43.3 yearsTennessee median age:
39.2 years
Average household size: This zip code:
2.3 peopleTennessee:
2.4 people
Averages for the 2020 tax year for zip code 37615, filed in 2021:
Average Adjusted Gross Income (AGI) in 2020: $84,114 (Individual Income Tax Returns) Here:
$84,114State:
$69,014
Salary/wage: $66,877 (reported on 80.8% of returns )Here:
$66,877State:
$55,872
(% of AGI for various income ranges: 1078.2% for AGIs below $25k , 3346.2% for AGIs $25k-50k , 6226.6% for AGIs $50k-75k , 8921.1% for AGIs $75k-100k , 16050.9% for AGIs $100k-200k , 65500.7% for AGIs over 200k ) Taxable interest for individuals: $1,341 (reported on 48.9% of returns )This zip code:
$1,341Tennessee:
$1,945
(% of AGI for various income ranges: 27.6% for AGIs below $25k , 38.3% for AGIs $25k-50k , 54.6% for AGIs $50k-75k , 71.8% for AGIs $75k-100k , 167.7% for AGIs $100k-200k , 986.3% for AGIs over 200k ) Ordinary dividends: $5,268 (reported on 19.4% of returns )(% of AGI for various income ranges: 17.6% for AGIs below $25k , 33.9% for AGIs $25k-50k , 65.3% for AGIs $50k-75k , 102.9% for AGIs $75k-100k , 225.4% for AGIs $100k-200k , 2219.3% for AGIs over 200k ) Net capital gain/loss in AGI: +$20,530 (reported on 18.7% of returns )Here:
+$20,530State:
+$33,664
(% of AGI for various income ranges: 8.2% for AGIs below $25k , 28.3% for AGIs $25k-50k , 112.4% for AGIs $50k-75k , 143.0% for AGIs $75k-100k , 566.9% for AGIs $100k-200k , 11970.0% for AGIs over 200k ) Profit/loss from business: +$34,938 (reported on 15.6% of returns )Here:
+$34,938State:
+$18,991
(% of AGI for various income ranges: 130.3% for AGIs below $25k , 128.0% for AGIs $25k-50k , 262.2% for AGIs $50k-75k , 465.7% for AGIs $75k-100k , 873.3% for AGIs $100k-200k , 13876.3% for AGIs over 200k ) Taxable individual retirement arrangement distribution: $23,213 (reported on 11.1% of returns )37615:
$23,213Tennessee:
$20,036
(% of AGI for various income ranges: 82.0% for AGIs below $25k , 141.0% for AGIs $25k-50k , 268.7% for AGIs $50k-75k , 441.7% for AGIs $75k-100k , 739.2% for AGIs $100k-200k , 3201.5% for AGIs over 200k ) Self-employed (Keogh) retirement plans: $28,133 (reported on 0.8% of returns )37615:
$28,133Tennessee:
$28,955
(% of AGI for various income ranges: 48.5% for AGIs $100k-200k , 741.9% for AGIs over 200k ) Total itemized deductions: $37,061 (reported on 6.8% of returns )Here:
$37,061State:
$40,136
(% of AGI for various income ranges: 26.9% for AGIs below $25k , 56.2% for AGIs $25k-50k , 95.3% for AGIs $50k-75k , 225.0% for AGIs $75k-100k , 665.1% for AGIs $100k-200k , 5757.0% for AGIs over 200k ) Charity contributions: $19,044 (reported on 5.8% of returns )Here:
$19,044State:
$19,852
(% of AGI for various income ranges: 15.2% for AGIs $25k-50k , 23.3% for AGIs $50k-75k , 55.7% for AGIs $75k-100k , 249.8% for AGIs $100k-200k , 3062.6% for AGIs over 200k ) Taxes paid: $6,500 (reported on 6.5% of returns )(% of AGI for various income ranges: 2.9% for AGIs below $25k , 6.3% for AGIs $25k-50k , 14.2% for AGIs $50k-75k , 41.7% for AGIs $75k-100k , 130.1% for AGIs $100k-200k , 931.5% for AGIs over 200k ) Earned income credit: $1,957 (reported on 12.7% of returns )(% of AGI for various income ranges: 67.8% for AGIs below $25k , 50.2% for AGIs $25k-50k , 0.6% for AGIs $50k-75k ) Percentage of individuals using paid preparers for their 2020 taxes: 94.1%(% for various income ranges: 93.2% for AGIs below $25k , 94.4% for AGIs $25k-50k , 94.2% for AGIs $50k-75k , 93.5% for AGIs $75k-100k , 94.9% for AGIs $100k-200k , 95.7% for AGIs over 200k )
Averages for the 2012 tax year for zip code 37615, filed in 2013:
Average Adjusted Gross Income (AGI) in 2012: $60,798 (Individual Income Tax Returns) Here:
$60,798State:
$53,767
Salary/wage: $54,124 (reported on 85.5% of returns )Here:
$54,124State:
$45,421
(% of AGI for various income ranges: 76.3% for AGIs below $25k , 77.6% for AGIs $25k-50k , 77.7% for AGIs $50k-75k , 81.4% for AGIs $75k-100k , 80.7% for AGIs $100k-200k , 66.3% for AGIs over 200k ) Taxable interest for individuals: $1,116 (reported on 42.1% of returns )This zip code:
$1,116Tennessee:
$1,732
(% of AGI for various income ranges: 1.1% for AGIs below $25k , 0.8% for AGIs $25k-50k , 0.9% for AGIs $50k-75k , 0.4% for AGIs $75k-100k , 0.6% for AGIs $100k-200k , 0.9% for AGIs over 200k ) Ordinary dividends: $3,550 (reported on 17.2% of returns )(% of AGI for various income ranges: 0.9% for AGIs below $25k , 0.7% for AGIs $25k-50k , 0.7% for AGIs $50k-75k , 0.6% for AGIs $75k-100k , 0.7% for AGIs $100k-200k , 2.0% for AGIs over 200k ) Net capital gain/loss in AGI: +$8,702 (reported on 15.3% of returns )Here:
+$8,702State:
+$19,082
(% of AGI for various income ranges: 0.7% for AGIs $50k-75k , 0.5% for AGIs $75k-100k , 0.7% for AGIs $100k-200k , 7.5% for AGIs over 200k ) Profit/loss from business: +$22,585 (reported on 14.6% of returns )Here:
+$22,585State:
+$15,240
(% of AGI for various income ranges: 7.3% for AGIs below $25k , 3.5% for AGIs $25k-50k , 3.4% for AGIs $50k-75k , 1.9% for AGIs $75k-100k , 4.8% for AGIs $100k-200k , 9.7% for AGIs over 200k ) Taxable individual retirement arrangement distribution: $16,612 (reported on 10.5% of returns )37615:
$16,612Tennessee:
$15,505
(% of AGI for various income ranges: 4.0% for AGIs below $25k , 3.6% for AGIs $25k-50k , 3.6% for AGIs $50k-75k , 3.0% for AGIs $75k-100k , 2.3% for AGIs $100k-200k , 2.2% for AGIs over 200k ) Self-employment retirement plans: $23,114 (reported on 0.8% of returns )37615:
$23,114Tennessee:
$22,567
(% of AGI for various income ranges: 0.3% for AGIs $25k-50k , 0.2% for AGIs $100k-200k , 0.7% for AGIs over 200k ) Total itemized deductions: $21,244 (17% of AGI, reported on 27.5% of returns )Here:
$21,244State:
$21,976
Here:
17.1% of AGIState:
17.8% of AGI
(% of AGI for various income ranges: 6.4% for AGIs below $25k , 7.8% for AGIs $25k-50k , 8.9% for AGIs $50k-75k , 10.3% for AGIs $75k-100k , 11.2% for AGIs $100k-200k , 9.9% for AGIs over 200k ) Charity contributions: $6,707 (reported on 22.0% of returns )(% of AGI for various income ranges: 0.7% for AGIs below $25k , 1.2% for AGIs $25k-50k , 1.8% for AGIs $50k-75k , 2.1% for AGIs $75k-100k , 2.8% for AGIs $100k-200k , 3.8% for AGIs over 200k ) Taxes paid: $4,635 (reported on 27.1% of returns )(% of AGI for various income ranges: 0.9% for AGIs below $25k , 1.3% for AGIs $25k-50k , 1.7% for AGIs $50k-75k , 2.0% for AGIs $75k-100k , 2.7% for AGIs $100k-200k , 2.4% for AGIs over 200k ) Earned income credit: $1,966 (reported on 15.8% of returns )(% of AGI for various income ranges: 5.3% for AGIs below $25k , 0.8% for AGIs $25k-50k ) Percentage of individuals using paid preparers for their 2012 taxes: 46.9%(% for various income ranges: 41.7% for AGIs below $25k , 44.6% for AGIs $25k-50k , 48.5% for AGIs $50k-75k , 50.5% for AGIs $75k-100k , 52.3% for AGIs $100k-200k , 79.4% for AGIs over 200k )
Averages for the 2004 tax year for zip code 37615, filed in 2005:
Average Adjusted Gross Income (AGI) in 2004: $45,460 (Individual Income Tax Returns) Here:
$45,460State:
$44,088
Salary/wage: $41,463 (reported on 87.0% of returns )Here:
$41,463State:
$38,825
(% of AGI for various income ranges: 148.5% for AGIs below $10k , 76.2% for AGIs $10k-25k , 81.7% for AGIs $25k-50k , 84.3% for AGIs $50k-75k , 84.7% for AGIs $75k-100k , 69.9% for AGIs over 100k ) Taxable interest for individuals: $1,153 (reported on 47.4% of returns )This zip code:
$1,153Tennessee:
$1,802
(% of AGI for various income ranges: 4.8% for AGIs below $10k , 1.7% for AGIs $10k-25k , 1.2% for AGIs $25k-50k , 0.9% for AGIs $50k-75k , 0.9% for AGIs $75k-100k , 1.3% for AGIs over 100k ) Taxable dividends: $1,669 (reported on 22.3% of returns )(% of AGI for various income ranges: 2.3% for AGIs below $10k , 0.8% for AGIs $10k-25k , 0.7% for AGIs $25k-50k , 0.4% for AGIs $50k-75k , 0.4% for AGIs $75k-100k , 1.3% for AGIs over 100k ) Net capital gain/loss: +$9,359 (reported on 15.5% of returns )Here:
+$9,359State:
+$15,776
(% of AGI for various income ranges: -2.1% for AGIs below $10k , 0.7% for AGIs $10k-25k , 0.6% for AGIs $25k-50k , 0.6% for AGIs $50k-75k , 1.8% for AGIs $75k-100k , 8.3% for AGIs over 100k ) Profit/loss from business: +$13,512 (reported on 15.9% of returns )Here:
+$13,512State:
+$12,882
(% of AGI for various income ranges: 0.1% for AGIs below $10k , 6.6% for AGIs $10k-25k , 2.8% for AGIs $25k-50k , 2.9% for AGIs $50k-75k , 2.7% for AGIs $75k-100k , 7.9% for AGIs over 100k ) IRA payment deduction: $2,821 (reported on 2.6% of returns )37615:
$2,821Tennessee:
$2,934
(% of AGI for various income ranges: 0.2% for AGIs $10k-25k , 0.3% for AGIs $25k-50k , 0.1% for AGIs $50k-75k , 0.1% for AGIs $75k-100k , 0.1% for AGIs over 100k ) Self-employed pension: $15,228 (reported on 0.7% of returns )Here:
$15,228Tennessee:
$16,857
(% of AGI for various income ranges: 0.2% for AGIs $10k-25k , 0.1% for AGIs $75k-100k , 0.7% for AGIs over 100k ) Total itemized deductions: $17,200 (20% of AGI, reported on 26.7% of returns )Here:
$17,200State:
$18,035
Here:
20.1% of AGIState:
19.9% of AGI
(% of AGI for various income ranges: 10.7% for AGIs below $10k , 5.7% for AGIs $10k-25k , 9.1% for AGIs $25k-50k , 10.5% for AGIs $50k-75k , 12.1% for AGIs $75k-100k , 10.7% for AGIs over 100k ) Charity contributions deductions: $4,705 (5% of AGI, reported on 22.9% of returns )Here:
5.2% of AGIState:
5.3% of AGI
(% of AGI for various income ranges: 0.8% for AGIs below $10k , 0.9% for AGIs $10k-25k , 1.4% for AGIs $25k-50k , 2.1% for AGIs $50k-75k , 2.7% for AGIs $75k-100k , 3.6% for AGIs over 100k ) Total tax: $6,761 (reported on 78.5% of returns )(% of AGI for various income ranges: 4.8% for AGIs below $10k , 4.5% for AGIs $10k-25k , 7.0% for AGIs $25k-50k , 8.9% for AGIs $50k-75k , 10.7% for AGIs $75k-100k , 19.5% for AGIs over 100k ) Earned income credit: $1,590 (reported on 14.3% of returns )Percentage of individuals using paid preparers for their 2004 taxes: 53.5%(% for various income ranges: 45.9% for AGIs below $10k , 55.1% for AGIs $10k-25k , 55.4% for AGIs $25k-50k , 52.8% for AGIs $50k-75k , 51.9% for AGIs $75k-100k , 62.9% for AGIs over 100k )
Estimated median household income in 2022: This zip code:
$75,573Tennessee:
$65,254
Nearest zip codes: 37663 ,
37686 ,
37664 ,
37604 ,
37659 ,
37614 .
Spurgeon Zip Code Map
Percentage of family households: This zip code:
44.5%Tennessee:
46.2%
Percentage of households with unmarried partners: This zip code:
8.3%Tennessee:
47.1%
Likely homosexual households (counted as self-reported same-sex unmarried-partner households)
Lesbian couples: 0.3% of all households Gay men: 0.0% of all households
Household received Food Stamps/SNAP in the past 12 months: 331Household did not receive Food Stamps/SNAP in the past 12 months: 9,465
Women who had a birth in the past 12 months: 197 (157 now married , 40 unmarried) Women who did not have a birth in the past 12 months: 4,713 (2,352 now married , 2,361 unmarried)
Housing units in zip code 37615 with a mortgage: 4,143 (441
second mortgage , 28
home equity loan , 409
both second mortgage and home equity loan )
Houses without a mortgage: 87
Median monthly owner costs for units with a mortgage: $1,400
Median monthly owner costs for units without a mortgage: $460
Residents with income below the poverty level in 2022:
This zip code:
8.7%Whole state:
13.3%
Residents with income below 50% of the poverty level in 2022:
This zip code:
4.7%Whole state:
7.1%
Median number of rooms in houses and condos: Median number of rooms in apartments: Notable locations in this zip code not listed on our city pages
Click to draw/clear zip code borders Notable locations in zip code 37615: (A) , Douglas Shed (B) , Boones Creek Dock (C) , Johnson City Fire Department Station 6 (D) , Johnson City Fire Department Station 8 (E) , Gray Volunteer Fire Department (F) . Display/hide their locations on the map
Churches in zip code 37615 include: (A) , Green Vale Church (B) , Hales Chapel (C) , Boones Creek Church (D) , Weyland Missionary Baptist Church (E) , Gravel Hill Church (F) , Highland Church (G) , Marvin's Chapel United Methodist Church (H) , Boones Creek Bible Church (I) . Display/hide their locations on the map
Cemeteries: (1) , White Cemetery (2) , Washington County Memory Gardens (3) , Madin Cemetery (4) , Gray Cemetery (5) , Gresham Cemetery (6) , Martin Cemetery (7) . Display/hide their locations on the map
Reservoir: (A) . Display/hide its location on the map
Streams, rivers, and creeks: (A) , Carroll Creek (B) , Cedar Creek (C) , Ford Creek (D) , Reedy Creek (E) , Hodge Branch (F) , Snyder Creek (G) , Red River (H) , Possum Creek (I) . Display/hide their locations on the map
Park in zip code 37615: (1) . Display/hide its location on the map
Year house built (houses)
146 2020 or later2,045 2010 to 20192,167 2000 to 20091,598 1990 to 19991,312 1980 to 19891,353 1970 to 1979785 1960 to 1969480 1950 to 1959189 1940 to 1949317 1939 or earlier
Zip code 37615 household income distribution in 2022 270 Less than $10,000356 $10,000 to $14,999256 $15,000 to $19,999361 $20,000 to $24,999274 $25,000 to $29,999297 $30,000 to $34,999319 $35,000 to $39,999273 $40,000 to $44,999372 $45,000 to $49,999714 $50,000 to $59,9991,423 $60,000 to $74,9991,133 $75,000 to $99,999959 $100,000 to $124,999912 $125,000 to $149,9991,005 $150,000 to $199,999877 $200,000 or moreEstimate of home value of owner-occupied houses/condos in 2022 in zip code 37615 44 Less than $10,00070 $10,000 to $14,99962 $15,000 to $19,99949 $20,000 to $24,9999 $25,000 to $29,99931 $30,000 to $34,99912 $60,000 to $69,99967 $70,000 to $79,99943 $80,000 to $89,99922 $90,000 to $99,999201 $100,000 to $124,999179 $125,000 to $149,999643 $150,000 to $174,999584 $175,000 to $199,9991,053 $200,000 to $249,9991,097 $250,000 to $299,9991,305 $300,000 to $399,999822 $400,000 to $499,999799 $500,000 to $749,999254 $750,000 to $999,999146 $1,000,000 to $1,499,999Rent paid by renters in 2022 in zip code 37615 16 $150 to $19916 $250 to $29916 $350 to $399120 $400 to $44951 $450 to $49949 $500 to $549111 $550 to $59962 $600 to $64962 $650 to $699128 $700 to $749313 $750 to $799295 $800 to $899165 $900 to $999508 $1,000 to $1,24977 $1,250 to $1,499134 $1,500 to $1,99919 $2,000 to $2,49954 No cash rent
Median gross rent in 2022: $989.
Median price asked for vacant for-sale houses and condos in 2022: $450,824.
Estimated median house (or condo) value in 2022 for: White Non-Hispanic householders: $321,967Black or African American householders: $334,858American Indian or Alaska Native householders: $190,426Asian householders: $1,318,339Some other race householders: $549,308Two or more races householders: $300,288Hispanic or Latino householders: $329,584Estimated median house or condo value in 2022: $300,874
37615:
$300,874Tennessee:
$284,800
Lower value quartile - upper value quartile: $214,854 - $431,157
Mean price in 2022: Detached houses: $344,592Here:
$344,592State:
$374,382
Townhouses or other attached units: $242,930Here:
$242,930State:
$354,101
In 2-unit structures: $180,937Here:
$180,937State:
$247,693
In 3-to-4-unit structures: $64,780Here:
$64,780State:
$239,060
In 5-or-more-unit structures: $127,929Here:
$127,929State:
$317,434
Mobile homes: $39,538Here:
$39,538State:
$101,421
Housing units in structures:
One, detached: 7,112One, attached: 744Two: 1943 or 4: 4275 to 9: 61510 to 19: 30020 to 49: 23150 or more: 418Mobile homes: 392Boats, RVs, vans, etc.: 20Unemployment : 2.8%
Means of transportation to work in zip code 37615 83.2% 9,658 Drove a car alone5.1% 592 Carpooled0.2% 19 Bus or trolley bus0.2% 18 Subway or elevated0.6% 68 Walked0.7% 85 Other means8.0% 924 Worked at homeTravel time to work (commute) in zip code 37615 132 Less than 5 minutes1,337 5 to 9 minutes1,122 10 to 14 minutes2,366 15 to 19 minutes2,758 20 to 24 minutes1,091 25 to 29 minutes893 30 to 34 minutes136 35 to 39 minutes108 40 to 44 minutes205 45 to 59 minutes109 60 to 89 minutes224 90 or more minutes
Percentage of zip code residents living and working in this county: 66.0%
Household type by relationship:
Households: 22,678
Male householders: 4,922 (900 living alone ), Female householders: 4,830 (1,608 living alone )5,432 spouses (5,432 opposite-sex spouses ), 1,066 unmarried partners , (1,010 opposite-sex unmarried partners ), 5,219 children (4,965 natural , 151 adopted , 111 stepchildren ), 536 grandchildren , 158 brothers or sisters , 167 parents , 0 foster children , 241 other relatives , 243 non-relatives In group quarters: 113 (-1 institutionalized population )
Size of family households: 3,478 2-persons , 1,417 3-persons , 1,155 4-persons , 299 5-persons , 97 6-persons , 121 7-or-more-persons
Size of nonfamily households: 2,518 1-person , 643 2-persons , 25 3-persons
3,144 married couples with children. single-parent households (156 men , 362 women ).
96.5% of residents of 37615 zip code speak English at home. of residents speak Spanish at home (84% very well, 16% well ).of residents speak other Indo-European language at home (65% very well, 35% well ).of residents speak Asian or Pacific Island language at home (68% very well, 32% well ).
Foreign born population: 386 (1.7%)
(75.5%
of them are naturalized citizens )
This zip code:
1.7%Whole state:
5.6%
23% United Kingdom, excluding England and Scotland 20% Sweden 9% Hong Kong 8% Costa Rica 7% Poland 7% Guatemala 7% Bhutan 23% American 19% English 16% Irish 11% German 5% Scottish 5% European 2% Scotch-Irish
Year of entry for the foreign-born population
118 2010 or later 212 2000 to 2009 116 1990 to 1999 254 Before 1990
Facilities with environmental interests located in this zip code:
DANIEL BOONE HIGH SCHOOL (1440 SUNCREST DR in GRAY, TN)
(Geographic Names Information System) (National Center for Education Statistics) - STATE ID-0037 Organizations: WASHINGTON COUNTY SCHOOL DIST (SCHOOL DISTRICT)
CITY OF JOHNSON CITY, WATER DEPARTMENT (GRAY RESERVOIR in GRAY, TN)
(Resource Conservation and Recovery Act (tracking hazardous waste)) Organizations: JIM SIPE (CONTACT/OPERATOR)
Housing units lacking complete plumbing facilities: 1.6%
Housing units lacking complete kitchen facilities: 2.0%
86.3% Electricity 9.9% Utility gas 1.8% Bottled, tank, or LP gas 1.0% Wood
Population in 1990: 12,119. Population change in the 1990s: +4,140 (+34.2%).
Place of birth for U.S.-born residents:
This state: 12,266Northeast: 1,052Midwest: 1,722South: 5,871West: 1,049
52% of the 37615 zip code residents lived in the same house 5 years ago.
Out of people who lived in different houses, 49% lived in this county.
Out of people who lived in different counties, 50% lived in Tennessee.
86% of the 37615 zip code residents lived in the same house 1 year ago.
Out of people who lived in different houses, 44% moved from this county.
Out of people who lived in different houses, 30% moved from different county within same state.
Out of people who lived in different houses, 23% moved from different state.
Out of people who lived in different houses, 1% moved from abroad.
Private vs. public school enrollment:
Students in private schools in grades 1 to 8 (elementary and middle school): 420
Here:
21.3%Tennessee:
15.0%
Students in private schools in grades 9 to 12 (high school): 106
Students in private undergraduate colleges: 33
Occupation by median earnings in the past 12 months ($)
111,445 Architecture and engineering occupations 89,294 Health diagnosing and treating practitioners and other technical occupations 76,547 Management occupations 76,133 Computer and mathematical occupations 76,045 Arts, design, entertainment, sports, and media occupations 73,217 Business and financial operations occupations
Companies with federal contracts located in this zip code:
SBA NETWORK SERVICES INC (121 BOONE RIDGE DR in JOHNSON CITY, FL) in 4 contracts from 2002 to 2003
$3,300 with U.S. Army Corps of Engineers - civil program financing only for Lease or Rental of Facilities -- Electronic and Communications Facilities. Taking place in CO. Signed on 2002-10-07. Completion date: 2003-09-30.
, same as above. Signed on 2002-09-23. Completion date: 2002-09-30.
, same as above. Signed on 2002-10-07. Completion date: 2003-09-30.
, same as above. Signed on 2003-09-26. Completion date: 2003-09-30.
Top industries in this zip code by the number of employees in 2005:
Finance and Insurance: Financial Transactions Processing, Reserve, and Clearinghouse Activities (over 1000 employees: 1 establishment)Administrative and Support and Waste Management and Remediation Services: Collection Agencies (500-999: 1)Administrative and Support and Waste Management and Remediation Services: Telemarketing Bureaus (250-499: 1)Accommodation and Food Services: Full-Service Restaurants (100-249: 1, 50-99: 1, 20-49: 1, 10-19: 4, 5-9: 1, 1-4: 2)Accommodation and Food Services: Limited-Service Restaurants (20-49: 6, 10-19: 2, 5-9: 2, 1-4: 3)Administrative and Support and Waste Management and Remediation Services: Janitorial Services (100-249: 1, 20-49: 1, 1-4: 1)Health Care and Social Assistance: Nursing Care Facilities (50-99: 2, 1-4: 1)Other Services (except Public Administration): Religious Organizations (10-19: 5, 5-9: 7, 1-4: 6)
People in group quarters in 2010:
117 people in nursing facilities/skilled-nursing facilities
People in group quarters in 2000:
134 people in nursing homes
9 people in other noninstitutional group quarters
7 people in homes or halfway houses for drug/alcohol abuse
Fatal accident statistics in 2014:
Fatal accident count: 5Vehicles involved in fatal accidents: 6Fatal accidents caused by drunken drivers: 1Fatalities: 5Persons involved in fatal accidents: 8Pedestrians involved in fatal accidents: 0
Fatal accident statistics in 2013:
Fatal accident count: 2Vehicles involved in fatal accidents: 3Fatal accidents caused by drunken drivers: 1Fatalities: 2Persons involved in fatal accidents: 4Pedestrians involved in fatal accidents: 0
Home Mortgage Disclosure Act Aggregated Statistics For Year 2009(Based on 2 full and 2 partial tracts) A) FHA, FSA/RHS & VA B) Conventional C) Refinancings D) Home Improvement Loans E) Loans on Dwellings For 5+ Families F) Non-occupant Loans on G) Loans On Manufactured Number Average Value Number Average Value Number Average Value Number Average Value Number Average Value Number Average Value Number Average Value
LOANS ORIGINATED 199 $152,988 259 $173,049 975 $172,865 37 $57,655 11 $1,314,241 87 $139,090 35 $83,415 APPLICATIONS APPROVED, NOT ACCEPTED 14 $102,601 10 $160,383 96 $189,651 4 $52,328 0 $0 5 $174,200 2 $70,835 APPLICATIONS DENIED 31 $141,754 59 $114,280 230 $152,713 21 $10,481 0 $0 15 $130,977 24 $73,126 APPLICATIONS WITHDRAWN 20 $140,836 29 $149,057 168 $169,632 4 $117,848 0 $0 4 $98,645 4 $105,982 FILES CLOSED FOR INCOMPLETENESS 4 $95,462 3 $167,903 39 $142,622 5 $179,308 0 $0 2 $56,845 0 $0
Aggregated Statistics For Year 2008(Based on 2 full and 2 partial tracts) A) FHA, FSA/RHS & VA B) Conventional C) Refinancings D) Home Improvement Loans E) Loans on Dwellings For 5+ Families F) Non-occupant Loans on G) Loans On Manufactured Number Average Value Number Average Value Number Average Value Number Average Value Number Average Value Number Average Value Number Average Value
LOANS ORIGINATED 103 $146,650 476 $177,284 570 $152,521 56 $74,710 13 $848,837 120 $120,251 33 $73,466 APPLICATIONS APPROVED, NOT ACCEPTED 6 $116,548 53 $213,224 65 $124,677 5 $10,026 0 $0 9 $126,226 13 $37,552 APPLICATIONS DENIED 22 $130,228 76 $143,486 259 $141,498 35 $75,899 2 $393,525 18 $90,954 17 $68,600 APPLICATIONS WITHDRAWN 7 $186,039 27 $157,407 149 $160,784 5 $230,868 0 $0 5 $162,126 7 $77,206 FILES CLOSED FOR INCOMPLETENESS 0 $0 6 $118,715 19 $161,325 5 $89,078 0 $0 2 $87,450 0 $0
Aggregated Statistics For Year 2007(Based on 2 full and 2 partial tracts) A) FHA, FSA/RHS & VA B) Conventional C) Refinancings D) Home Improvement Loans E) Loans on Dwellings For 5+ Families F) Non-occupant Loans on G) Loans On Manufactured Number Average Value Number Average Value Number Average Value Number Average Value Number Average Value Number Average Value Number Average Value
LOANS ORIGINATED 43 $147,503 747 $168,693 499 $128,536 76 $47,611 17 $1,328,692 123 $139,212 30 $65,946 APPLICATIONS APPROVED, NOT ACCEPTED 6 $106,448 69 $146,763 84 $148,451 5 $27,492 0 $0 21 $162,919 9 $29,539 APPLICATIONS DENIED 8 $114,448 62 $135,375 355 $137,761 53 $65,192 2 $7,660,620 23 $160,695 42 $63,252 APPLICATIONS WITHDRAWN 6 $134,152 59 $153,289 131 $146,451 11 $86,543 0 $0 7 $159,926 4 $60,915 FILES CLOSED FOR INCOMPLETENESS 2 $151,545 11 $141,945 61 $117,553 2 $1,980 0 $0 5 $225,364 0 $0
Aggregated Statistics For Year 2006(Based on 2 full and 2 partial tracts) A) FHA, FSA/RHS & VA B) Conventional C) Refinancings D) Home Improvement Loans E) Loans on Dwellings For 5+ Families F) Non-occupant Loans on G) Loans On Manufactured Number Average Value Number Average Value Number Average Value Number Average Value Number Average Value Number Average Value Number Average Value
LOANS ORIGINATED 46 $142,776 1,007 $136,507 494 $125,862 101 $36,465 9 $791,198 152 $104,192 70 $56,044 APPLICATIONS APPROVED, NOT ACCEPTED 0 $0 138 $104,827 83 $118,689 6 $14,667 0 $0 33 $78,135 22 $54,607 APPLICATIONS DENIED 11 $95,477 166 $112,506 264 $136,426 67 $44,102 0 $0 46 $80,210 59 $66,480 APPLICATIONS WITHDRAWN 5 $142,368 95 $118,845 146 $136,569 15 $59,216 0 $0 16 $100,028 7 $56,609 FILES CLOSED FOR INCOMPLETENESS 0 $0 30 $90,487 76 $140,695 2 $293,830 0 $0 5 $77,780 0 $0
Aggregated Statistics For Year 2005(Based on 2 full and 2 partial tracts) A) FHA, FSA/RHS & VA B) Conventional C) Refinancings D) Home Improvement Loans E) Loans on Dwellings For 5+ Families F) Non-occupant Loans on G) Loans On Manufactured Number Average Value Number Average Value Number Average Value Number Average Value Number Average Value Number Average Value Number Average Value
LOANS ORIGINATED 32 $122,794 909 $136,205 629 $113,978 61 $49,401 15 $1,015,923 105 $104,659 61 $69,340 APPLICATIONS APPROVED, NOT ACCEPTED 3 $63,547 65 $133,314 117 $105,092 17 $39,474 0 $0 9 $113,223 15 $49,223 APPLICATIONS DENIED 11 $73,422 151 $107,656 350 $128,919 42 $53,791 0 $0 31 $104,358 85 $72,441 APPLICATIONS WITHDRAWN 2 $209,880 78 $131,970 243 $133,244 16 $103,409 0 $0 13 $120,138 10 $82,728 FILES CLOSED FOR INCOMPLETENESS 0 $0 37 $94,383 35 $115,673 2 $32,685 0 $0 5 $115,784 0 $0
Aggregated Statistics For Year 2004(Based on 2 full and 2 partial tracts) A) FHA, FSA/RHS & VA B) Conventional C) Refinancings D) Home Improvement Loans E) Loans on Dwellings For 5+ Families F) Non-occupant Loans on G) Loans On Manufactured Number Average Value Number Average Value Number Average Value Number Average Value Number Average Value Number Average Value Number Average Value
LOANS ORIGINATED 50 $109,578 719 $139,016 723 $113,486 68 $46,319 22 $714,256 106 $97,967 34 $66,163 APPLICATIONS APPROVED, NOT ACCEPTED 5 $82,138 64 $113,879 145 $99,887 11 $69,741 0 $0 15 $80,046 22 $68,310 APPLICATIONS DENIED 6 $63,883 169 $95,965 369 $99,729 52 $34,561 0 $0 18 $77,199 88 $61,909 APPLICATIONS WITHDRAWN 3 $142,253 65 $108,251 250 $121,489 14 $38,367 0 $0 20 $74,877 27 $76,176 FILES CLOSED FOR INCOMPLETENESS 0 $0 20 $108,446 45 $120,135 3 $78,707 0 $0 2 $96,195 2 $71,710
Aggregated Statistics For Year 2003(Based on 2 full and 2 partial tracts) A) FHA, FSA/RHS & VA B) Conventional C) Refinancings D) Home Improvement Loans E) Loans on Dwellings For 5+ Families F) Non-occupant Loans on Number Average Value Number Average Value Number Average Value Number Average Value Number Average Value Number Average Value
LOANS ORIGINATED 86 $109,141 649 $131,735 1,459 $119,727 100 $42,424 5 $2,059,272 104 $107,422 APPLICATIONS APPROVED, NOT ACCEPTED 5 $130,826 60 $145,130 165 $125,533 14 $19,938 0 $0 9 $82,980 APPLICATIONS DENIED 7 $89,481 134 $108,912 383 $105,156 47 $27,619 0 $0 12 $59,267 APPLICATIONS WITHDRAWN 9 $76,402 53 $129,927 230 $110,726 5 $30,564 0 $0 13 $55,660 FILES CLOSED FOR INCOMPLETENESS 0 $0 18 $213,477 42 $92,425 5 $110,886 0 $0 5 $87,450
Aggregated Statistics For Year 2002(Based on 2 full and 2 partial tracts) A) FHA, FSA/RHS & VA B) Conventional C) Refinancings D) Home Improvement Loans E) Loans on Dwellings For 5+ Families F) Non-occupant Loans on Number Average Value Number Average Value Number Average Value Number Average Value Number Average Value Number Average Value
LOANS ORIGINATED 61 $98,069 596 $122,739 855 $117,543 73 $24,815 4 $472,962 75 $119,170 APPLICATIONS APPROVED, NOT ACCEPTED 0 $0 52 $68,644 127 $103,834 7 $24,116 0 $0 5 $53,554 APPLICATIONS DENIED 0 $0 115 $79,683 313 $97,263 42 $14,055 0 $0 17 $75,816 APPLICATIONS WITHDRAWN 3 $52,470 44 $98,250 153 $117,113 0 $0 0 $0 10 $110,620 FILES CLOSED FOR INCOMPLETENESS 0 $0 11 $80,921 41 $94,636 0 $0 0 $0 2 $129,755
Aggregated Statistics For Year 2001(Based on 2 full and 2 partial tracts) A) FHA, FSA/RHS & VA B) Conventional C) Refinancings D) Home Improvement Loans E) Loans on Dwellings For 5+ Families F) Non-occupant Loans on Number Average Value Number Average Value Number Average Value Number Average Value Number Average Value Number Average Value
LOANS ORIGINATED 67 $86,713 628 $107,503 856 $108,512 66 $23,836 4 $395,995 40 $87,792 APPLICATIONS APPROVED, NOT ACCEPTED 4 $80,805 98 $48,002 112 $82,445 12 $37,067 0 $0 0 $0 APPLICATIONS DENIED 17 $88,598 250 $56,788 338 $76,590 37 $9,054 2 $1,311,750 12 $75,352 APPLICATIONS WITHDRAWN 7 $118,970 82 $99,435 200 $109,208 6 $32,027 0 $0 5 $97,222 FILES CLOSED FOR INCOMPLETENESS 2 $59,430 7 $100,499 47 $109,863 2 $85,185 0 $0 2 $39,350
Aggregated Statistics For Year 2000(Based on 2 full and 2 partial tracts) A) FHA, FSA/RHS & VA B) Conventional C) Refinancings D) Home Improvement Loans E) Loans on Dwellings For 5+ Families F) Non-occupant Loans on Number Average Value Number Average Value Number Average Value Number Average Value Number Average Value Number Average Value
LOANS ORIGINATED 67 $93,854 573 $110,692 309 $92,335 78 $21,933 4 $145,960 50 $76,702 APPLICATIONS APPROVED, NOT ACCEPTED 20 $41,098 99 $59,663 82 $68,489 17 $16,531 0 $0 4 $66,685 APPLICATIONS DENIED 33 $55,018 300 $51,421 230 $75,911 54 $19,821 0 $0 20 $81,744 APPLICATIONS WITHDRAWN 8 $59,885 47 $97,932 96 $65,149 20 $33,368 0 $0 7 $54,560 FILES CLOSED FOR INCOMPLETENESS 2 $69,085 17 $88,440 40 $66,034 0 $0 0 $0 2 $126,785
Aggregated Statistics For Year 1999(Based on 1 full and 1 partial tracts) A) FHA, FSA/RHS & VA B) Conventional C) Refinancings D) Home Improvement Loans E) Loans on Dwellings For 5+ Families F) Non-occupant Loans on Number Average Value Number Average Value Number Average Value Number Average Value Number Average Value Number Average Value
LOANS ORIGINATED 34 $91,422 318 $103,560 276 $88,347 56 $22,103 4 $300,168 23 $75,857 APPLICATIONS APPROVED, NOT ACCEPTED 2 $80,795 70 $63,228 41 $67,569 8 $11,895 0 $0 5 $67,076 APPLICATIONS DENIED 1 $49,110 166 $53,390 103 $68,725 25 $20,951 0 $0 11 $67,130 APPLICATIONS WITHDRAWN 2 $86,480 43 $97,177 56 $71,515 5 $39,852 0 $0 2 $123,935 FILES CLOSED FOR INCOMPLETENESS 1 $95,590 10 $106,697 21 $81,964 0 $0 0 $0 0 $0
Detailed HMDA statistics for the following Tracts:
0614.00
,
0615.00
Private Mortgage Insurance Companies Aggregated Statistics For Year 2009(Based on 2 full and 2 partial tracts) A) Conventional B) Refinancings C) Non-occupant Loans on Number Average Value Number Average Value Number Average Value
LOANS ORIGINATED 45 $207,128 25 $202,985 0 $0 APPLICATIONS APPROVED, NOT ACCEPTED 9 $179,348 11 $165,595 2 $82,205 APPLICATIONS DENIED 2 $241,360 4 $265,018 0 $0 APPLICATIONS WITHDRAWN 0 $0 5 $173,216 0 $0 FILES CLOSED FOR INCOMPLETENESS 0 $0 0 $0 0 $0
Aggregated Statistics For Year 2008(Based on 2 full and 2 partial tracts) A) Conventional B) Refinancings C) Non-occupant Loans on D) Loans On Manufactured Number Average Value Number Average Value Number Average Value Number Average Value
LOANS ORIGINATED 122 $176,497 45 $166,348 9 $131,601 2 $66,460 APPLICATIONS APPROVED, NOT ACCEPTED 26 $221,291 7 $118,389 4 $178,972 0 $0 APPLICATIONS DENIED 9 $140,931 0 $0 2 $99,050 0 $0 APPLICATIONS WITHDRAWN 10 $175,742 2 $162,440 0 $0 0 $0 FILES CLOSED FOR INCOMPLETENESS 6 $104,508 0 $0 2 $107,965 0 $0
Aggregated Statistics For Year 2007(Based on 2 full and 2 partial tracts) A) Conventional B) Refinancings C) Non-occupant Loans on D) Loans On Manufactured Number Average Value Number Average Value Number Average Value Number Average Value
LOANS ORIGINATED 192 $162,616 51 $146,610 13 $140,675 2 $41,975 APPLICATIONS APPROVED, NOT ACCEPTED 32 $202,928 9 $204,048 7 $112,936 0 $0 APPLICATIONS DENIED 2 $564,055 0 $0 0 $0 0 $0 APPLICATIONS WITHDRAWN 7 $235,610 3 $303,743 0 $0 2 $57,715 FILES CLOSED FOR INCOMPLETENESS 0 $0 0 $0 0 $0 0 $0
Aggregated Statistics For Year 2006(Based on 2 full and 2 partial tracts) A) Conventional B) Refinancings C) Non-occupant Loans on D) Loans On Manufactured Number Average Value Number Average Value Number Average Value Number Average Value
LOANS ORIGINATED 157 $149,836 33 $136,858 18 $139,445 2 $57,715 APPLICATIONS APPROVED, NOT ACCEPTED 21 $132,937 6 $162,850 0 $0 0 $0 APPLICATIONS DENIED 2 $41,975 0 $0 0 $0 0 $0 APPLICATIONS WITHDRAWN 9 $130,166 7 $217,533 2 $83,950 0 $0 FILES CLOSED FOR INCOMPLETENESS 0 $0 0 $0 0 $0 0 $0
Aggregated Statistics For Year 2005(Based on 2 full and 2 partial tracts) A) Conventional B) Refinancings C) Non-occupant Loans on D) Loans On Manufactured Number Average Value Number Average Value Number Average Value Number Average Value
LOANS ORIGINATED 163 $127,718 54 $121,285 11 $189,663 5 $86,968 APPLICATIONS APPROVED, NOT ACCEPTED 28 $143,566 15 $132,155 2 $58,440 2 $69,085 APPLICATIONS DENIED 2 $35,855 0 $0 0 $0 0 $0 APPLICATIONS WITHDRAWN 2 $41,100 2 $245,735 0 $0 0 $0 FILES CLOSED FOR INCOMPLETENESS 0 $0 0 $0 0 $0 0 $0
Aggregated Statistics For Year 2004(Based on 2 full and 2 partial tracts) A) Conventional B) Refinancings C) Non-occupant Loans on D) Loans On Manufactured Number Average Value Number Average Value Number Average Value Number Average Value
LOANS ORIGINATED 98 $123,697 51 $116,854 4 $82,072 2 $81,220 APPLICATIONS APPROVED, NOT ACCEPTED 17 $171,068 20 $129,312 2 $49,525 0 $0 APPLICATIONS DENIED 2 $87,450 0 $0 0 $0 0 $0 APPLICATIONS WITHDRAWN 4 $66,860 4 $75,278 2 $49,525 0 $0 FILES CLOSED FOR INCOMPLETENESS 0 $0 0 $0 0 $0 0 $0
Aggregated Statistics For Year 2003(Based on 2 full and 2 partial tracts) A) Conventional B) Refinancings C) Non-occupant Loans on Number Average Value Number Average Value Number Average Value
LOANS ORIGINATED 143 $116,743 170 $124,155 17 $108,808 APPLICATIONS APPROVED, NOT ACCEPTED 32 $144,797 36 $97,865 0 $0 APPLICATIONS DENIED 0 $0 3 $103,190 0 $0 APPLICATIONS WITHDRAWN 0 $0 13 $82,678 0 $0 FILES CLOSED FOR INCOMPLETENESS 0 $0 0 $0 0 $0
Aggregated Statistics For Year 2002(Based on 2 full and 2 partial tracts) A) Conventional B) Refinancings C) Non-occupant Loans on Number Average Value Number Average Value Number Average Value
LOANS ORIGINATED 141 $106,738 94 $119,356 7 $107,799 APPLICATIONS APPROVED, NOT ACCEPTED 16 $99,374 15 $95,213 4 $80,820 APPLICATIONS DENIED 4 $77,488 2 $156,500 2 $156,500 APPLICATIONS WITHDRAWN 0 $0 5 $111,936 0 $0 FILES CLOSED FOR INCOMPLETENESS 0 $0 0 $0 0 $0
Aggregated Statistics For Year 2001(Based on 2 full and 2 partial tracts) A) Conventional B) Refinancings C) Non-occupant Loans on Number Average Value Number Average Value Number Average Value
LOANS ORIGINATED 140 $114,192 84 $126,712 4 $66,908 APPLICATIONS APPROVED, NOT ACCEPTED 13 $94,146 20 $137,328 0 $0 APPLICATIONS DENIED 3 $111,353 2 $66,460 0 $0 APPLICATIONS WITHDRAWN 3 $163,240 0 $0 0 $0 FILES CLOSED FOR INCOMPLETENESS 0 $0 2 $98,820 0 $0
Aggregated Statistics For Year 2000(Based on 2 full and 2 partial tracts) A) Conventional B) Refinancings C) Non-occupant Loans on Number Average Value Number Average Value Number Average Value
LOANS ORIGINATED 130 $118,133 33 $114,725 4 $69,965 APPLICATIONS APPROVED, NOT ACCEPTED 7 $152,046 7 $94,780 0 $0 APPLICATIONS DENIED 13 $106,882 6 $122,492 4 $83,202 APPLICATIONS WITHDRAWN 2 $76,270 4 $92,612 0 $0 FILES CLOSED FOR INCOMPLETENESS 2 $83,200 0 $0 2 $83,200
Aggregated Statistics For Year 1999(Based on 1 full and 1 partial tracts) A) Conventional B) Refinancings C) Non-occupant Loans on Number Average Value Number Average Value Number Average Value
LOANS ORIGINATED 83 $118,025 17 $90,287 1 $43,550 APPLICATIONS APPROVED, NOT ACCEPTED 1 $60,380 4 $152,598 0 $0 APPLICATIONS DENIED 3 $104,417 0 $0 0 $0 APPLICATIONS WITHDRAWN 1 $111,850 2 $85,125 0 $0 FILES CLOSED FOR INCOMPLETENESS 0 $0 1 $192,940 0 $0
Detailed PMIC statistics for the following Tracts:
0614.00
,
0615.00
2003 - 2018 National Fire Incident Reporting System (NFIRS) incidents See full 2006 National Fire Incident Reporting System statistics for zip code 37615, Tennessee
Most common first names in zip code 37615 among deceased individuals Name Count Lived (average)
Mary 62 78.7 years James 54 71.6 years William 49 71.3 years John 39 76.7 years Robert 39 74.9 years Charles 31 72.2 years Fred 29 81.0 years George 27 75.0 years Dorothy 22 80.5 years Margaret 19 79.7 years
Most common last names in zip code 37615 among deceased individuals Last name Count Lived (average)
Martin 28 78.9 years Cox 25 76.0 years Johnson 24 76.9 years Hale 23 74.9 years Hall 20 78.1 years Jenkins 20 76.3 years Fitzgerald 20 70.5 years Ford 19 76.1 years Smith 19 73.6 years Brown 16 74.7 years
Businesses in zip code 37615
Name Count Name Count
Advance Auto Parts 1 Papa John's Pizza 1 Burger King 2 Pizza Hut 1 Cracker Barrel 1 Rite Aid 1 Dairy Queen 1 Ryder Rental & Truck Leasing 1 Domino's Pizza 1 Subway 2 FedEx 2 Taco Bell 1 GNC 1 U-Haul 1 Holiday Inn 1 UPS 4 La-Z-Boy 1 Waffle House 1 Lane Furniture 1 Walgreens 1 MasterBrand Cabinets 3 Wendy's 1 McDonald's 1

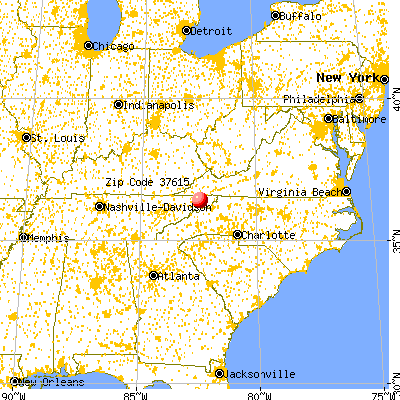


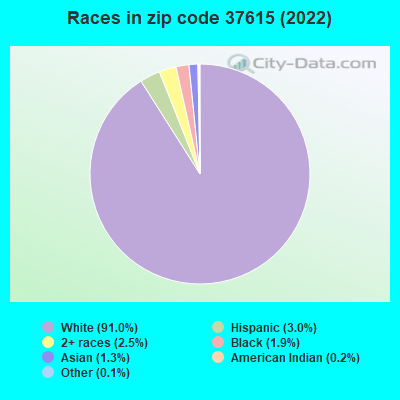


 Nearest zip codes: 37663, 37686, 37664, 37604, 37659, 37614.
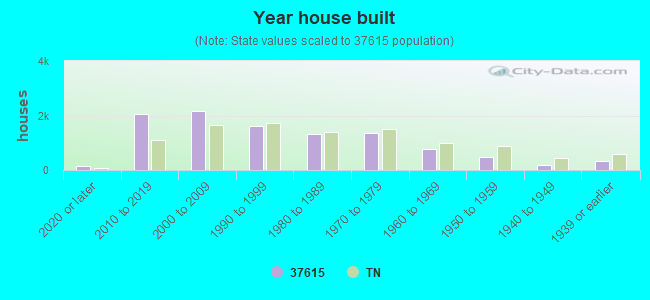

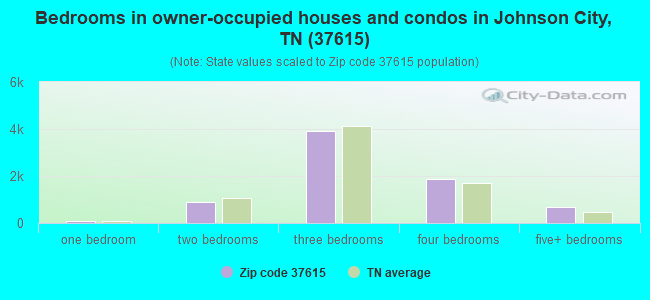
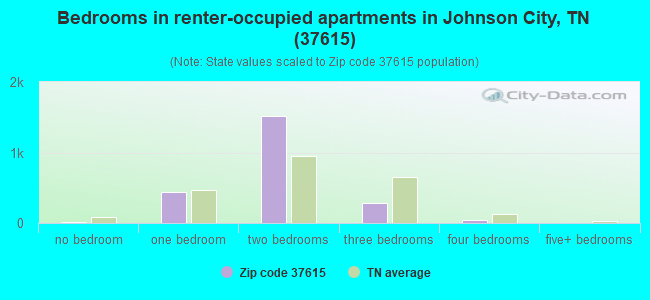
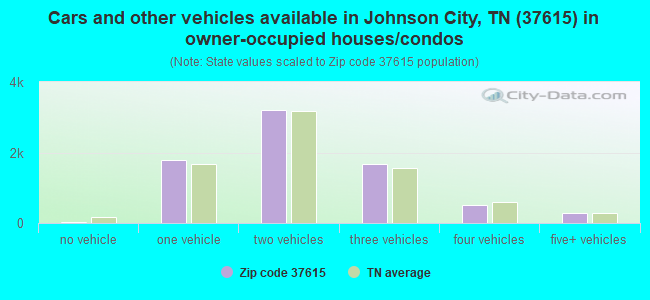
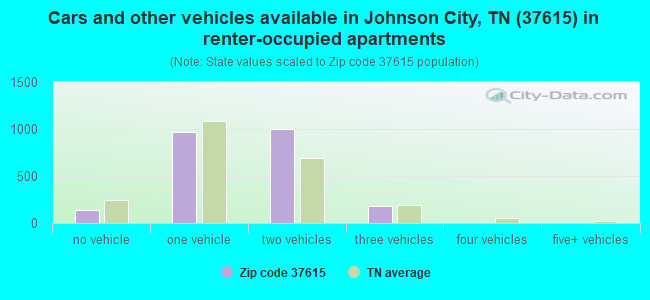


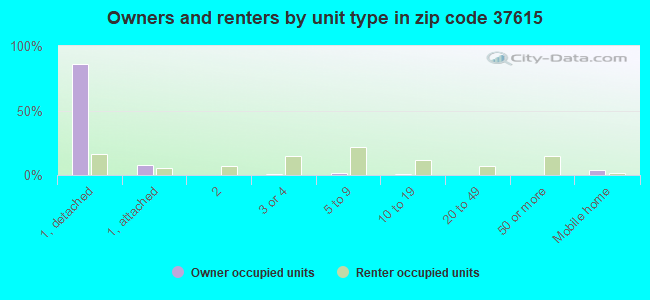
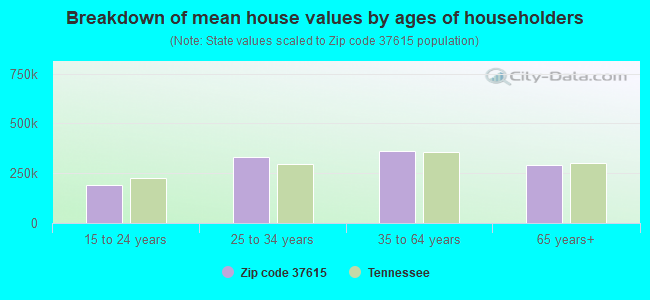


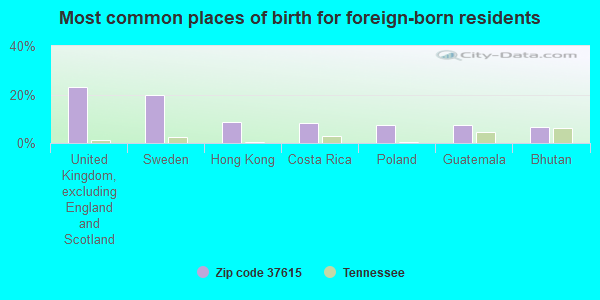
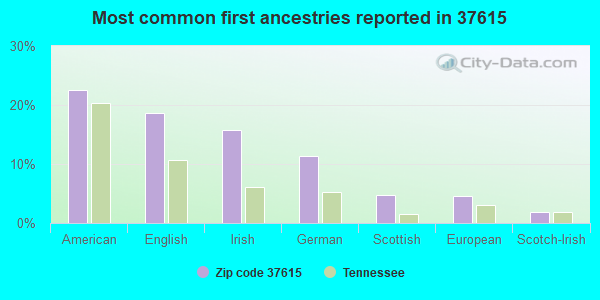
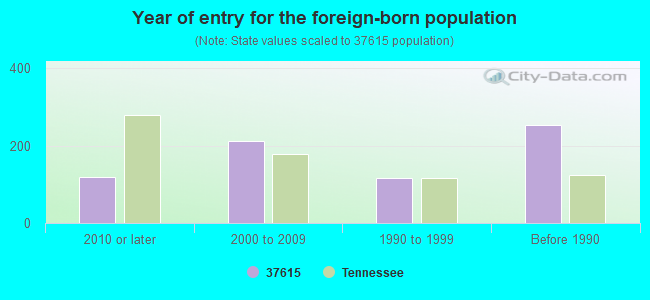


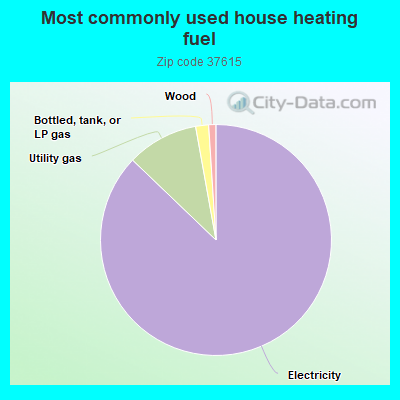
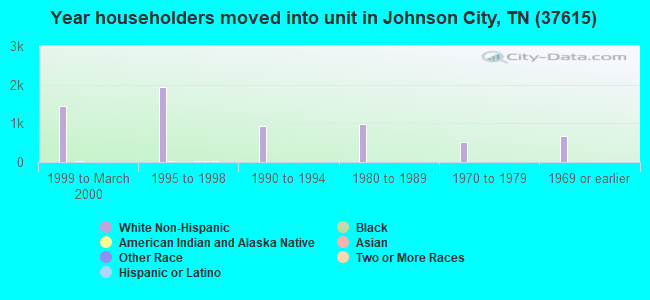

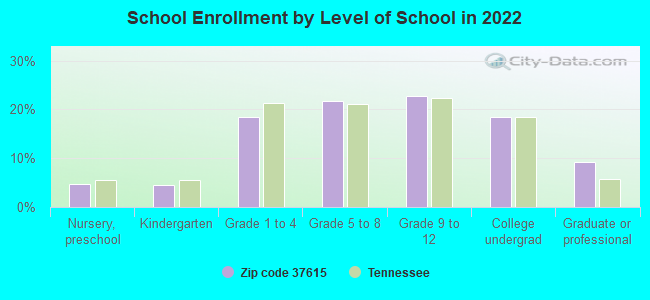
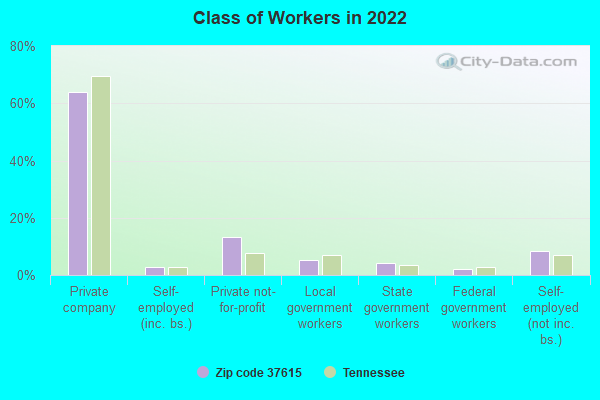
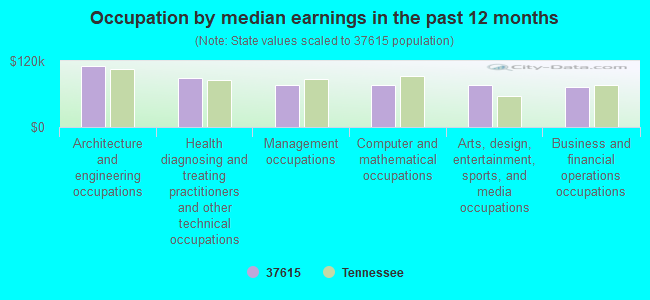
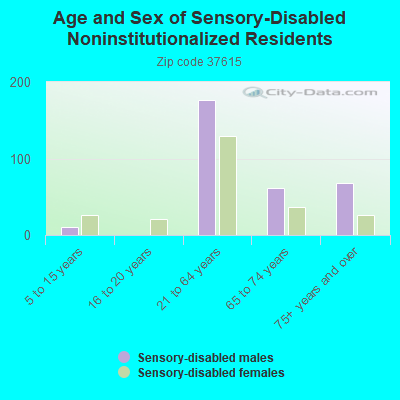
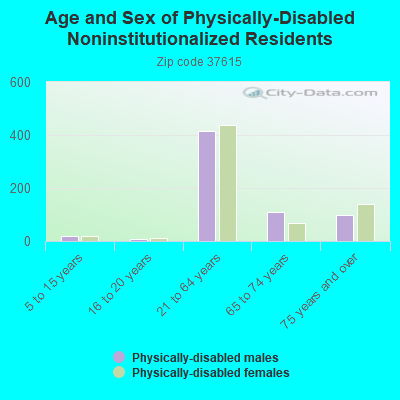
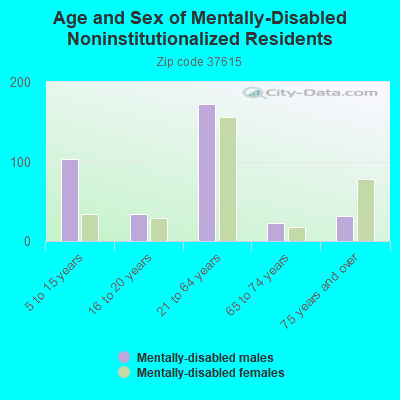
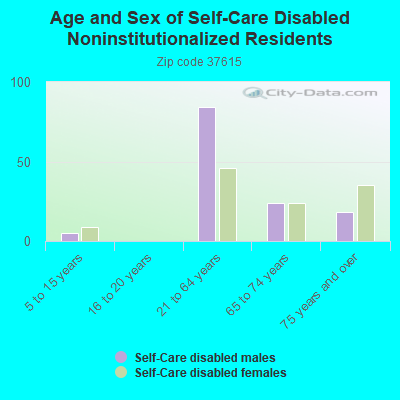
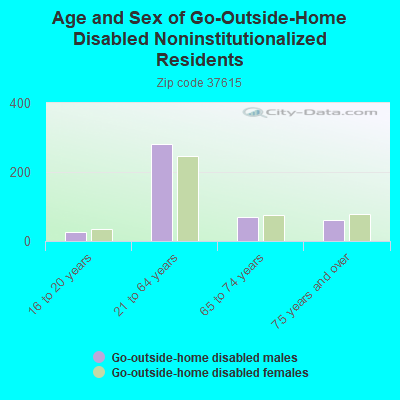
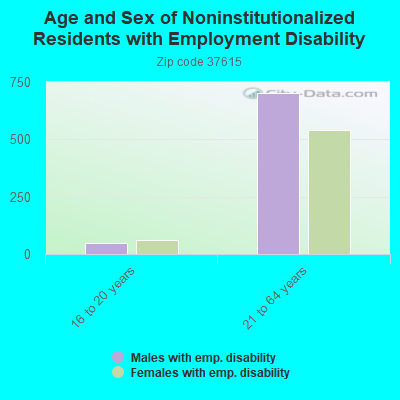
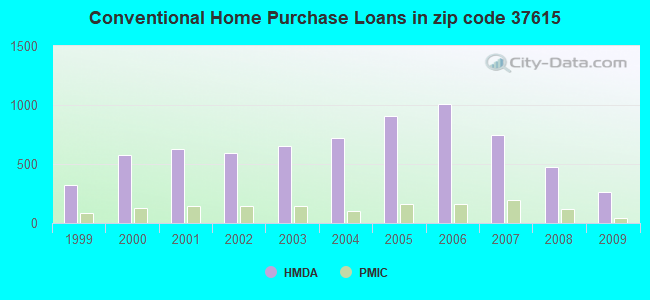
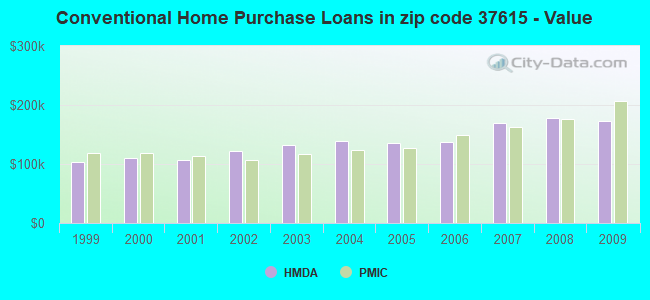
 Based on the data from the years 2003 - 2018 the average number of fires per year is 82. The highest number of reported fire incidents - 180 took place in 2007, and the least - 9 in 2003. The data has a growing trend.
 When looking into fire subcategories, the most incidents belonged to: Structure Fires (46.3%), and Outside Fires (37.6%).