Estimated zip code population in 2022: 1,060 Zip code population in 2010: 1,141 Zip code population in 2000: 1,441
Houses and condos: 467 Renter-occupied apartments: 32
% of renters here:
7%
State:
33%
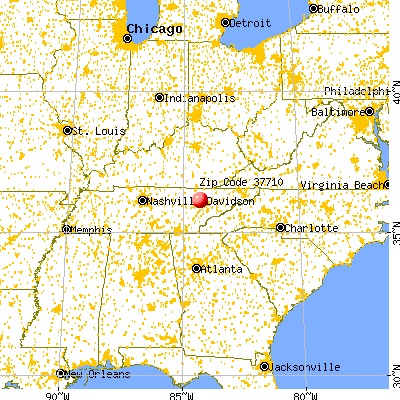
March 2022 cost of living index in zip code 37710: 79.3 (low, U.S. average is 100)
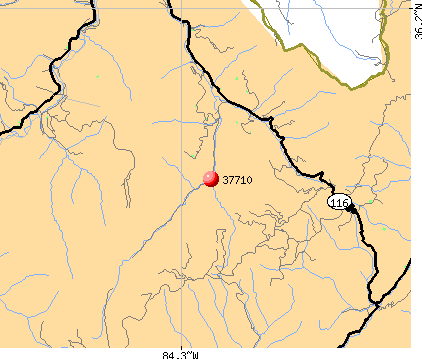
Land area: 81.7 sq. mi. Water area: 0.0 sq. mi.
Population density: 13 people per square mile
(very low).
OSM Map
General Map
Google Map
MSN Map
OSM Map
General Map
Google Map
MSN Map
OSM Map
General Map
Google Map
MSN Map
OSM Map
General Map
Google Map
MSN Map
Please wait while loading the map...
Real estate property taxes paid for housing units in 2022:
This zip code:
0.3% ($298)
Tennessee:
0.5% ($1,376)
Median real estate property taxes paid for housing units with mortgages in 2022: $462 (0.4%) Median real estate property taxes paid for housing units with no mortgage in 2022: $272 (0.4%)
Business Search- 14 Million verified businesses
Males: 492
(46.5%)
Females: 567
(53.5%)
For population 25 years and over in 37710:
High school or higher: 79.2%
Bachelor's degree or higher: 3.9%
Graduate or professional degree: 0.8%
Unemployed: 3.3%
Mean travel time to work (commute): 33.0 minutes
For population 15 years and over in 37710:
Never married: 26.3%
Now married: 35.2%
Separated: 0.0%
Widowed: 14.4%
Divorced: 24.1%
Zip code 37710 compared to state average:
Median household income significantly below state average.
Median house value significantly below state average.
Black race population percentage significantly below state average.
Hispanic race population percentage significantly below state average.
Median age significantly above state average.
Foreign-born population percentage significantly below state average.
Renting percentage significantly below state average.
Length of stay since moving in significantly above state average.
Number of college students significantly below state average.
Percentage of population with a bachelor's degree or higher significantly below state average.
Averages for the 2020 tax year for zip code 37710, filed in 2021:
Average Adjusted Gross Income (AGI) in 2020: $36,695 (Individual Income Tax Returns)
Here:
$36,695
State:
$69,014
Salary/wage: $35,761 (reported on 81.6% of returns)
Here:
$35,761
State:
$55,872
(% of AGI for various income ranges: 1011.5% for AGIs below $25k, 3176.7% for AGIs $25k-50k, 5966.0% for AGIs $50k-75k, 3837.5% for AGIs $75k-100k)
Taxable interest for individuals: $80 (reported on 13.2% of returns)
This zip code:
$80
Tennessee:
$1,945
(% of AGI for various income ranges: 4.4% for AGIs $25k-50k)
Profit/loss from business: +$7,380 (reported on 13.2% of returns)
Here:
+$7,380
State:
+$18,991
(% of AGI for various income ranges: 186.2% for AGIs below $25k, 141.1% for AGIs $25k-50k)
Earned income credit: $2,327 (reported on 28.9% of returns)
Here:
$2,327
State:
$2,391
(% of AGI for various income ranges: 125.4% for AGIs below $25k, 103.3% for AGIs $25k-50k)
Percentage of individuals using paid preparers for their 2020 taxes: 94.7%
Here:
95%
State:
93%
(% for various income ranges: 94.1% for AGIs below $25k, 100.0% for AGIs $25k-50k, 100.0% for AGIs $50k-75k, 100.0% for AGIs $75k-100k, 66.7% for AGIs $100k-200k)
Averages for the 2012 tax year for zip code 37710, filed in 2013:
Average Adjusted Gross Income (AGI) in 2012: $28,926 (Individual Income Tax Returns)
Here:
$28,926
State:
$53,767
Salary/wage: $29,367 (reported on 84.6% of returns)
Here:
$29,367
State:
$45,421
(% of AGI for various income ranges: 76.7% for AGIs below $25k, 90.1% for AGIs $25k-50k, 86.7% for AGIs $50k-75k, 89.9% for AGIs $75k-100k)
Taxable interest for individuals: $225 (reported on 10.3% of returns)
This zip code:
$225
Tennessee:
$1,732
Profit/loss from business: +$6,083 (reported on 15.4% of returns)
Here:
+$6,083
State:
+$15,240
(% of AGI for various income ranges: 13.1% for AGIs below $25k)
Earned income credit: $2,260 (reported on 38.5% of returns)
Here:
$2,260
State:
$2,404
(% of AGI for various income ranges: 9.6% for AGIs below $25k, 2.1% for AGIs $25k-50k)
Percentage of individuals using paid preparers for their 2012 taxes: 59.0%
Here:
59%
State:
52%
(% for various income ranges: 54.5% for AGIs below $25k, 60.0% for AGIs $25k-50k, 100.0% for AGIs $50k-75k)
Averages for the 2004 tax year for zip code 37710, filed in 2005:
Average Adjusted Gross Income (AGI) in 2004: $24,942 (Individual Income Tax Returns)
Here:
$24,942
State:
$44,088
Salary/wage: $25,239 (reported on 88.6% of returns)
Here:
$25,239
State:
$38,825
(% of AGI for various income ranges: 81.1% for AGIs below $10k, 83.1% for AGIs $10k-25k, 92.9% for AGIs $25k-50k, 92.3% for AGIs $50k-75k)
Taxable interest for individuals: $227 (reported on 20.5% of returns)
This zip code:
$227
Tennessee:
$1,802
(% of AGI for various income ranges: 1.8% for AGIs below $10k, 0.1% for AGIs $10k-25k, 0.2% for AGIs $25k-50k, 0.0% for AGIs $50k-75k)
Profit/loss from business: +$5,406 (reported on 14.9% of returns)
Here:
+$5,406
State:
+$12,882
Total itemized deductions: $13,188 (37% of AGI, reported on 3.7% of returns)
Here:
$13,188
State:
$18,035
Here:
36.7% of AGI
State:
19.9% of AGI
Charity contributions deductions: $1,083 (3% of AGI, reported on 2.8% of returns)
Here:
$1,083
State:
$5,167
Here:
3.1% of AGI
State:
5.3% of AGI
Total tax: $2,273 (reported on 65.6% of returns)
37710:
$2,273
State:
$7,482
(% of AGI for various income ranges: 2.9% for AGIs below $10k, 3.7% for AGIs $10k-25k, 5.6% for AGIs $25k-50k, 8.9% for AGIs $50k-75k)
Earned income credit: $1,782 (reported on 30.9% of returns)
Here:
$1,782
State:
$1,826
Percentage of individuals using paid preparers for their 2004 taxes: 64.7%
Here:
65%
State:
60%
(% for various income ranges: 60.0% for AGIs below $10k, 65.4% for AGIs $10k-25k, 71.4% for AGIs $25k-50k, 55.1% for AGIs $50k-75k)
Household received Food Stamps/SNAP in the past 12 months: 129 Household did not receive Food Stamps/SNAP in the past 12 months: 309
Women who had a birth in the past 12 months: 14 (15 now married, 0 unmarried) Women who did not have a birth in the past 12 months: 250 (62 now married, 187 unmarried)
Housing units in zip code 37710 with a mortgage: 161 Median monthly owner costs for units with a mortgage: $765 Median monthly owner costs for units without a mortgage: $344
Residents with income below the poverty level in 2022:
This zip code:
48.2%
Whole state:
13.3%
Residents with income below 50% of the poverty level in 2022:
This zip code:
32.2%
Whole state:
7.1%
Median number of rooms in houses and condos:
Here:
5.1
State:
6.5
Median number of rooms in apartments:
Here:
5.7
State:
4.4
Notable locations in this zip code not listed on our city pages
Churches in zip code 37710 include: New Pilot Baptist Church (A), Shiloh Church (B), Laurel Grove Baptist Church (C), Graves Gap Baptist Church (D), Rock Hill Church (E), Tennessee Hollow Church (F), Laurel Branch Baptist Church (G), Briceville Methodist Church (H), Grave Hill Baptist Church (I). Display/hide their locations on the map
Cemeteries: Seeber Cemetery (1), Vowell Cemetery (2), Jones Cemetery (3), Wilson Cemetery (4), Asslinger Cemetery (5), Lively Cemetery (6), Beech Grove Cemetery (7). Display/hide their locations on the map
Streams, rivers, and creeks: Lower Fork (A), Ligias Fork (B), Lick Branch (C), Laurel Fork (D), Laurel Branch (E), Joe Branch (F), Jack Branch (G), Indian Fork (H), Gum Branch (I). Display/hide their locations on the map
Size of family households: 155 2-persons, 57 3-persons, 25 4-persons, 11 5-persons, 8 6-persons, 12 7-or-more-persons
Size of nonfamily households: 103 1-person, 70 2-persons
74 married couples with children.
82 single-parent households (5 men, 77 women).
99.4% of residents of 37710 zip code speak English at home.
Foreign born population: 5 (0.5%) (0.0% of them are naturalized citizens)
:
0.5%
Whole state:
5.6%
80%Honduras
28%American
21%English
5%Irish
1%German
1%Italian
Year of entry for the foreign-born population
02010 or later
02000 to 2009
01990 to 1999
4Before 1990
Facilities with environmental interests located in this zip code:
BRICEVILLE ELEMENTARY SCHOOL (103 SLATESTONE ROAD in BRICEVILLE, TN)
(Geographic Names Information System) National Pollutant Discharge Elimination System NON-MAJOR (Tracking pollutant discharge elimination systems) - permit Business SIC classification: SEWERAGE SYSTEMS Organizations: ANDERSON CO. BRD OF EDUCATION (CONTACT/OWNER)
Alternative names: ANDERSON CO. BRD. OF EDUCATION, ANDERSON CO-BRICEVILLE ES
Housing units lacking complete plumbing facilities: 3.6% Housing units lacking complete kitchen facilities: 3.6%
73.3%Electricity
10.7%Utility gas
8.6%Bottled, tank, or LP gas
7.8%Wood
Population in 1990: 2,225.
Place of birth for U.S.-born residents:
This state: 862
Northeast: 13
Midwest: 42
South: 122
78% of the 37710 zip code residents lived in the same house 5 years ago. Out of people who lived in different houses, 62% lived in this county. Out of people who lived in different counties, 50% lived in Tennessee.
95% of the 37710 zip code residents lived in the same house 1 year ago. Out of people who lived in different houses, 98% moved from this county.
Private vs. public school enrollment:
Students in private schools in grades 1 to 8 (elementary and middle school): 5
Here:
9.2%
Tennessee:
15.0%
Students in private schools in grades 9 to 12 (high school):
Here:
0.0%
Tennessee:
16.2%
Students in private undergraduate colleges:
Here:
0.0%
Tennessee:
23.5%
Occupation by median earnings in the past 12 months ($)
65,006Management occupations
57,194Installation, maintenance, and repair occupations
32,961Sales and related occupations
26,831Production occupations
19,524Office and administrative support occupations
17,976Transportation occupations
Top industries in this zip code by the number of employees in 2005:
Mining: Bituminous Coal and Lignite Surface Mining (20-49: 1)
Other Services (except Public Administration): Religious Organizations (1-4: 3)
Other Services (except Public Administration): Commercial and Industrial Machinery and Equipment (except Automotive and Electronic) Repair and Maintenance (1-4: 1)
Professional, Scientific, and Technical Services: All Other Professional, Scientific, and Technical Services (1-4: 1)
Fatal accident statistics in 2014:
Fatal accident count: 1
Vehicles involved in fatal accidents: 1
Fatal accidents caused by drunken drivers: 0
Fatalities: 1
Persons involved in fatal accidents: 1
Pedestrians involved in fatal accidents: 0
Fatal accident statistics in 2012:
Fatal accident count: 1
Vehicles involved in fatal accidents: 1
Fatal accidents caused by drunken drivers: 1
Fatalities: 1
Persons involved in fatal accidents: 1
Pedestrians involved in fatal accidents: 0
Home Mortgage Disclosure Act Aggregated Statistics For Year 2009 (Based on 2 partial tracts)
A) FHA, FSA/RHS & VA Home Purchase Loans
B) Conventional Home Purchase Loans
C) Refinancings
D) Home Improvement Loans
F) Non-occupant Loans on < 5 Family Dwellings (A B C & D)
G) Loans On Manufactured Home Dwelling (A B C & D)
Number
Average Value
Number
Average Value
Number
Average Value
Number
Average Value
Number
Average Value
Number
Average Value
LOANS ORIGINATED
2
$94,825
0
$0
18
$69,459
14
$3,136
4
$18,438
4
$27,658
APPLICATIONS APPROVED, NOT ACCEPTED
0
$0
0
$0
2
$16,680
4
$2,195
0
$0
0
$0
APPLICATIONS DENIED
2
$80,775
4
$7,902
9
$56,972
9
$1,366
0
$0
5
$6,672
APPLICATIONS WITHDRAWN
0
$0
0
$0
14
$66,226
2
$8,780
0
$0
0
$0
FILES CLOSED FOR INCOMPLETENESS
2
$74,630
0
$0
0
$0
0
$0
0
$0
0
$0
Aggregated Statistics For Year 2008 (Based on 2 partial tracts)
A) FHA, FSA/RHS & VA Home Purchase Loans
B) Conventional Home Purchase Loans
C) Refinancings
D) Home Improvement Loans
F) Non-occupant Loans on < 5 Family Dwellings (A B C & D)
G) Loans On Manufactured Home Dwelling (A B C & D)
Number
Average Value
Number
Average Value
Number
Average Value
Number
Average Value
Number
Average Value
Number
Average Value
LOANS ORIGINATED
5
$63,918
7
$59,954
18
$80,191
11
$20,434
2
$37,755
7
$31,609
APPLICATIONS APPROVED, NOT ACCEPTED
0
$0
4
$26,340
5
$71,996
4
$16,682
0
$0
2
$30,730
APPLICATIONS DENIED
2
$49,170
0
$0
28
$67,104
12
$35,705
2
$42,145
2
$9,660
APPLICATIONS WITHDRAWN
0
$0
0
$0
18
$84,873
0
$0
0
$0
2
$76,385
FILES CLOSED FOR INCOMPLETENESS
0
$0
0
$0
4
$70,240
2
$43,900
0
$0
0
$0
Aggregated Statistics For Year 2007 (Based on 2 partial tracts)
A) FHA, FSA/RHS & VA Home Purchase Loans
B) Conventional Home Purchase Loans
C) Refinancings
D) Home Improvement Loans
F) Non-occupant Loans on < 5 Family Dwellings (A B C & D)
G) Loans On Manufactured Home Dwelling (A B C & D)
Number
Average Value
Number
Average Value
Number
Average Value
Number
Average Value
Number
Average Value
Number
Average Value
LOANS ORIGINATED
0
$0
25
$47,623
28
$73,250
21
$18,229
5
$74,806
14
$37,879
APPLICATIONS APPROVED, NOT ACCEPTED
2
$60,580
4
$54,435
14
$57,196
2
$6,145
2
$32,485
4
$41,705
APPLICATIONS DENIED
5
$79,020
11
$54,436
46
$71,614
35
$17,460
4
$28,975
12
$42,437
APPLICATIONS WITHDRAWN
0
$0
2
$95,700
7
$71,494
4
$14,048
4
$54,875
0
$0
FILES CLOSED FOR INCOMPLETENESS
2
$71,995
0
$0
4
$76,385
0
$0
0
$0
0
$0
Aggregated Statistics For Year 2006 (Based on 2 partial tracts)
A) FHA, FSA/RHS & VA Home Purchase Loans
B) Conventional Home Purchase Loans
C) Refinancings
D) Home Improvement Loans
F) Non-occupant Loans on < 5 Family Dwellings (A B C & D)
G) Loans On Manufactured Home Dwelling (A B C & D)
Number
Average Value
Number
Average Value
Number
Average Value
Number
Average Value
Number
Average Value
Number
Average Value
LOANS ORIGINATED
4
$64,095
25
$56,332
28
$59,265
19
$12,199
7
$44,903
11
$41,985
APPLICATIONS APPROVED, NOT ACCEPTED
0
$0
5
$49,870
14
$70,240
2
$14,925
4
$30,730
5
$57,246
APPLICATIONS DENIED
0
$0
14
$57,196
28
$55,063
14
$26,089
4
$28,095
11
$66,089
APPLICATIONS WITHDRAWN
0
$0
2
$59,705
21
$68,568
2
$56,190
0
$0
4
$53,998
FILES CLOSED FOR INCOMPLETENESS
0
$0
4
$32,925
7
$84,790
0
$0
0
$0
0
$0
Aggregated Statistics For Year 2005 (Based on 2 partial tracts)
A) FHA, FSA/RHS & VA Home Purchase Loans
B) Conventional Home Purchase Loans
C) Refinancings
D) Home Improvement Loans
F) Non-occupant Loans on < 5 Family Dwellings (A B C & D)
G) Loans On Manufactured Home Dwelling (A B C & D)
Number
Average Value
Number
Average Value
Number
Average Value
Number
Average Value
Number
Average Value
Number
Average Value
LOANS ORIGINATED
0
$0
18
$46,241
30
$61,460
12
$3,951
4
$52,680
4
$37,315
APPLICATIONS APPROVED, NOT ACCEPTED
2
$52,680
9
$38,437
9
$46,047
2
$3,510
0
$0
12
$45,217
APPLICATIONS DENIED
0
$0
19
$52,865
37
$47,554
26
$12,900
0
$0
19
$39,372
APPLICATIONS WITHDRAWN
0
$0
5
$173,142
16
$68,704
0
$0
0
$0
2
$61,460
FILES CLOSED FOR INCOMPLETENESS
0
$0
0
$0
4
$42,145
0
$0
0
$0
2
$52,680
Aggregated Statistics For Year 2004 (Based on 2 partial tracts)
A) FHA, FSA/RHS & VA Home Purchase Loans
B) Conventional Home Purchase Loans
C) Refinancings
D) Home Improvement Loans
F) Non-occupant Loans on < 5 Family Dwellings (A B C & D)
G) Loans On Manufactured Home Dwelling (A B C & D)
Number
Average Value
Number
Average Value
Number
Average Value
Number
Average Value
Number
Average Value
Number
Average Value
LOANS ORIGINATED
2
$36,875
21
$55,356
33
$47,785
5
$3,864
2
$13,170
12
$40,681
APPLICATIONS APPROVED, NOT ACCEPTED
4
$64,095
9
$46,241
9
$44,876
4
$9,658
0
$0
12
$56,046
APPLICATIONS DENIED
2
$32,485
26
$45,723
54
$59,867
21
$4,348
2
$44,780
21
$39,635
APPLICATIONS WITHDRAWN
2
$79,900
0
$0
21
$63,550
4
$42,582
0
$0
5
$59,352
FILES CLOSED FOR INCOMPLETENESS
0
$0
0
$0
2
$35,120
0
$0
0
$0
0
$0
Aggregated Statistics For Year 2003 (Based on 2 partial tracts)
A) FHA, FSA/RHS & VA Home Purchase Loans
B) Conventional Home Purchase Loans
C) Refinancings
D) Home Improvement Loans
F) Non-occupant Loans on < 5 Family Dwellings (A B C & D)
Number
Average Value
Number
Average Value
Number
Average Value
Number
Average Value
Number
Average Value
LOANS ORIGINATED
0
$0
23
$48,328
40
$42,934
11
$7,024
5
$38,984
APPLICATIONS APPROVED, NOT ACCEPTED
0
$0
23
$51,840
19
$58,687
4
$1,755
4
$47,850
APPLICATIONS DENIED
4
$44,778
67
$41,122
47
$53,427
7
$3,010
4
$14,488
APPLICATIONS WITHDRAWN
0
$0
4
$62,778
23
$50,695
0
$0
0
$0
FILES CLOSED FOR INCOMPLETENESS
0
$0
0
$0
4
$60,142
0
$0
0
$0
Aggregated Statistics For Year 2002 (Based on 2 partial tracts)
A) FHA, FSA/RHS & VA Home Purchase Loans
B) Conventional Home Purchase Loans
C) Refinancings
D) Home Improvement Loans
F) Non-occupant Loans on < 5 Family Dwellings (A B C & D)
Number
Average Value
Number
Average Value
Number
Average Value
Number
Average Value
Number
Average Value
LOANS ORIGINATED
0
$0
37
$41,052
44
$56,152
16
$14,158
5
$25,988
APPLICATIONS APPROVED, NOT ACCEPTED
2
$49,170
14
$39,384
11
$47,253
0
$0
0
$0
APPLICATIONS DENIED
2
$57,950
46
$34,853
77
$58,039
19
$5,361
2
$8,780
APPLICATIONS WITHDRAWN
0
$0
0
$0
21
$63,132
2
$83,410
0
$0
FILES CLOSED FOR INCOMPLETENESS
0
$0
0
$0
4
$50,925
0
$0
0
$0
Aggregated Statistics For Year 2001 (Based on 2 partial tracts)
A) FHA, FSA/RHS & VA Home Purchase Loans
B) Conventional Home Purchase Loans
C) Refinancings
D) Home Improvement Loans
F) Non-occupant Loans on < 5 Family Dwellings (A B C & D)
Number
Average Value
Number
Average Value
Number
Average Value
Number
Average Value
Number
Average Value
LOANS ORIGINATED
5
$84,640
21
$56,359
40
$42,715
4
$14,925
2
$6,145
APPLICATIONS APPROVED, NOT ACCEPTED
0
$0
9
$25,754
9
$50,924
0
$0
0
$0
APPLICATIONS DENIED
0
$0
37
$41,337
35
$52,981
5
$11,940
2
$45,655
APPLICATIONS WITHDRAWN
0
$0
0
$0
7
$51,426
0
$0
0
$0
FILES CLOSED FOR INCOMPLETENESS
0
$0
2
$94,825
4
$86,045
0
$0
2
$40,390
Aggregated Statistics For Year 2000 (Based on 2 partial tracts)
A) FHA, FSA/RHS & VA Home Purchase Loans
B) Conventional Home Purchase Loans
C) Refinancings
D) Home Improvement Loans
F) Non-occupant Loans on < 5 Family Dwellings (A B C & D)
Number
Average Value
Number
Average Value
Number
Average Value
Number
Average Value
Number
Average Value
LOANS ORIGINATED
0
$0
28
$37,566
33
$35,333
14
$11,916
2
$34,240
APPLICATIONS APPROVED, NOT ACCEPTED
0
$0
11
$32,725
11
$42,144
4
$16,682
2
$26,340
APPLICATIONS DENIED
2
$26,340
37
$31,276
35
$51,927
5
$4,214
2
$39,510
APPLICATIONS WITHDRAWN
0
$0
0
$0
14
$43,399
0
$0
0
$0
FILES CLOSED FOR INCOMPLETENESS
0
$0
0
$0
4
$28,095
0
$0
0
$0
Aggregated Statistics For Year 1999 (Based on 1 partial tract)
A) FHA, FSA/RHS & VA Home Purchase Loans
B) Conventional Home Purchase Loans
C) Refinancings
D) Home Improvement Loans
F) Non-occupant Loans on < 5 Family Dwellings (A B C & D)
Detailed PMIC statistics for the following Tracts:0207.00
2003 - 2017 National Fire Incident Reporting System (NFIRS) incidents
Based on the data from the years 2003 - 2017 the average number of fire incidents per year is 12. The highest number of fires - 28 took place in 2012, and the least - 1 in 2003. The data has a rising trend.
When looking into fire subcategories, the most reports belonged to: Structure Fires (45.1%), and Outside Fires (38.7%).
Fire incident types reported to NFIRS in Zip Code 37710


 Nearest zip codes: 37714, 37840, 37845, 37716, 37769, 37719.


 Based on the data from the years 2003 - 2017 the average number of fire incidents per year is 12. The highest number of fires - 28 took place in 2012, and the least - 1 in 2003. The data has a rising trend.
 When looking into fire subcategories, the most reports belonged to: Structure Fires (45.1%), and Outside Fires (38.7%).