Estimated zip code population in 2022: 16,678 Zip code population in 2010: 15,794 Zip code population in 2000: 14,572
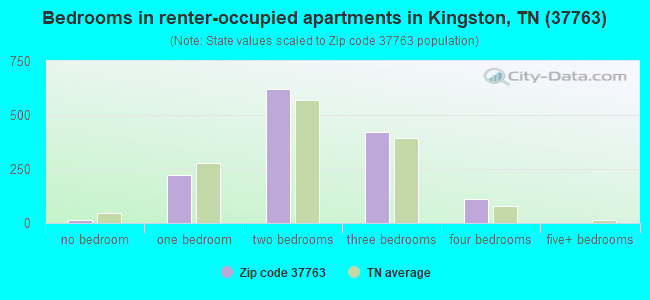
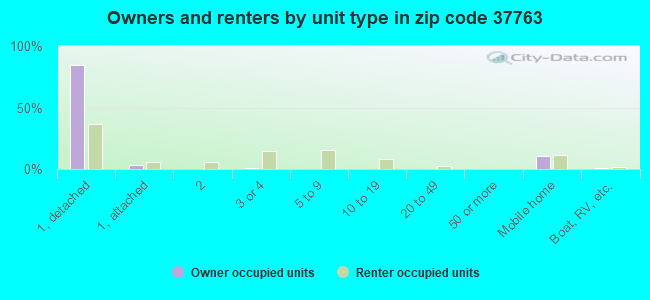
Houses and condos: 7,802 Renter-occupied apartments: 1,387
% of renters here:
20%
State:
33%
March 2022 cost of living index in zip code 37763: 79.5 (low, U.S. average is 100)
Land area: 91.1 sq. mi. Water area: 11.4 sq. mi.
Population density: 183 people per square mile
(very low).
OSM Map
General Map
Google Map
MSN Map
OSM Map
General Map
Google Map
MSN Map
OSM Map
General Map
Google Map
MSN Map
OSM Map
General Map
Google Map
MSN Map
Please wait while loading the map...
Real estate property taxes paid for housing units in 2022:
This zip code:
0.5% ($1,445)
Tennessee:
0.5% ($1,376)
Median real estate property taxes paid for housing units with mortgages in 2022: $1,350 (0.5%) Median real estate property taxes paid for housing units with no mortgage in 2022: $1,559 (0.6%)
Estimated median house/condo value in 2022: $274,738
37763:
$274,738
Tennessee:
$284,800
According to our research of Tennessee and other state lists, there were 26 registered sex offenders living in 37763 zip code as of May 28, 2024. The ratio of all residents to sex offenders in zip code 37763 is 603 to 1. The ratio of registered sex offenders to all residents in this zip code is lower than the state average.
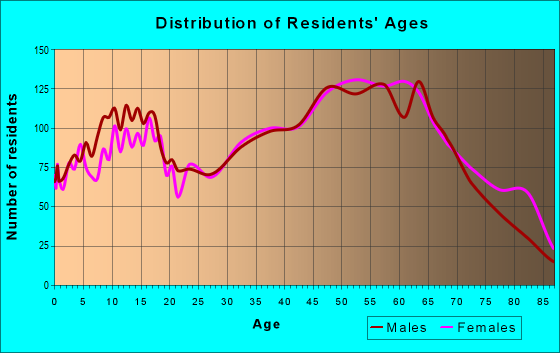
Median resident age:
This zip code:
48.3 years
Tennessee median age:
39.2 years
Average household size:
This zip code:
2.3 people
Tennessee:
2.4 people
Averages for the 2020 tax year for zip code 37763, filed in 2021:
Average Adjusted Gross Income (AGI) in 2020: $71,056 (Individual Income Tax Returns)
Here:
$71,056
State:
$69,014
Salary/wage: $60,323 (reported on 77.6% of returns)
Here:
$60,323
State:
$55,872
(% of AGI for various income ranges: 1026.4% for AGIs below $25k, 3204.8% for AGIs $25k-50k, 5592.8% for AGIs $50k-75k, 8310.5% for AGIs $75k-100k, 15146.4% for AGIs $100k-200k, 54854.2% for AGIs over 200k)
Taxable interest for individuals: $1,462 (reported on 37.6% of returns)
This zip code:
$1,462
Tennessee:
$1,945
(% of AGI for various income ranges: 24.7% for AGIs below $25k, 29.3% for AGIs $25k-50k, 80.4% for AGIs $50k-75k, 88.9% for AGIs $75k-100k, 141.7% for AGIs $100k-200k, 760.8% for AGIs over 200k)
Ordinary dividends: $5,549 (reported on 18.3% of returns)
Here:
$5,549
State:
$8,105
(% of AGI for various income ranges: 24.2% for AGIs below $25k, 34.5% for AGIs $25k-50k, 96.1% for AGIs $50k-75k, 129.0% for AGIs $75k-100k, 251.4% for AGIs $100k-200k, 2520.8% for AGIs over 200k)
Net capital gain/loss in AGI: +$15,123 (reported on 16.5% of returns)
Here:
+$15,123
State:
+$33,664
(% of AGI for various income ranges: 16.9% for AGIs below $25k, 25.9% for AGIs $25k-50k, 62.9% for AGIs $50k-75k, 158.7% for AGIs $75k-100k, 519.1% for AGIs $100k-200k, 10215.0% for AGIs over 200k)
Profit/loss from business: +$23,344 (reported on 14.0% of returns)
Here:
+$23,344
State:
+$18,991
(% of AGI for various income ranges: 102.8% for AGIs below $25k, 142.3% for AGIs $25k-50k, 182.3% for AGIs $50k-75k, 251.4% for AGIs $75k-100k, 525.7% for AGIs $100k-200k, 11250.0% for AGIs over 200k)
Taxable individual retirement arrangement distribution: $18,292 (reported on 11.6% of returns)
37763:
$18,292
Tennessee:
$20,036
(% of AGI for various income ranges: 61.0% for AGIs below $25k, 96.7% for AGIs $25k-50k, 253.9% for AGIs $50k-75k, 336.3% for AGIs $75k-100k, 714.9% for AGIs $100k-200k, 2855.8% for AGIs over 200k)
Self-employed (Keogh) retirement plans: $30,325 (reported on 0.5% of returns)
37763:
$30,325
Tennessee:
$28,955
(% of AGI for various income ranges: 1010.8% for AGIs over 200k)
Total itemized deductions: $34,633 (reported on 5.6% of returns)
Here:
$34,633
State:
$40,136
(% of AGI for various income ranges: 36.0% for AGIs below $25k, 49.7% for AGIs $25k-50k, 234.4% for AGIs $50k-75k, 241.7% for AGIs $75k-100k, 531.1% for AGIs $100k-200k, 4395.8% for AGIs over 200k)
Charity contributions: $15,165 (reported on 4.9% of returns)
Here:
$15,165
State:
$19,852
(% of AGI for various income ranges: 13.0% for AGIs $25k-50k, 61.3% for AGIs $50k-75k, 75.4% for AGIs $75k-100k, 201.3% for AGIs $100k-200k, 2274.2% for AGIs over 200k)
Taxes paid: $5,892 (reported on 5.3% of returns)
37763:
$5,892
State:
$6,038
(% of AGI for various income ranges: 11.8% for AGIs $25k-50k, 27.7% for AGIs $50k-75k, 39.4% for AGIs $75k-100k, 97.0% for AGIs $100k-200k, 741.7% for AGIs over 200k)
Earned income credit: $2,086 (reported on 13.1% of returns)
Here:
$2,086
State:
$2,391
(% of AGI for various income ranges: 74.4% for AGIs below $25k, 59.5% for AGIs $25k-50k)
Percentage of individuals using paid preparers for their 2020 taxes: 93.7%
Here:
94%
State:
93%
(% for various income ranges: 93.3% for AGIs below $25k, 94.5% for AGIs $25k-50k, 93.5% for AGIs $50k-75k, 93.3% for AGIs $75k-100k, 94.2% for AGIs $100k-200k, 91.4% for AGIs over 200k)
Averages for the 2012 tax year for zip code 37763, filed in 2013:
Average Adjusted Gross Income (AGI) in 2012: $58,162 (Individual Income Tax Returns)
Here:
$58,162
State:
$53,767
Salary/wage: $49,205 (reported on 80.1% of returns)
Here:
$49,205
State:
$45,421
(% of AGI for various income ranges: 68.1% for AGIs below $25k, 69.4% for AGIs $25k-50k, 70.0% for AGIs $50k-75k, 73.4% for AGIs $75k-100k, 75.7% for AGIs $100k-200k, 46.7% for AGIs over 200k)
Taxable interest for individuals: $1,459 (reported on 36.9% of returns)
This zip code:
$1,459
Tennessee:
$1,732
(% of AGI for various income ranges: 1.6% for AGIs below $25k, 1.1% for AGIs $25k-50k, 1.3% for AGIs $50k-75k, 0.9% for AGIs $75k-100k, 0.5% for AGIs $100k-200k, 0.9% for AGIs over 200k)
Ordinary dividends: $3,913 (reported on 17.0% of returns)
Here:
$3,913
State:
$6,739
(% of AGI for various income ranges: 1.6% for AGIs below $25k, 1.0% for AGIs $25k-50k, 1.1% for AGIs $50k-75k, 0.9% for AGIs $75k-100k, 1.0% for AGIs $100k-200k, 1.5% for AGIs over 200k)
Net capital gain/loss in AGI: +$8,142 (reported on 13.5% of returns)
Here:
+$8,142
State:
+$19,082
(% of AGI for various income ranges: 0.2% for AGIs $25k-50k, 1.1% for AGIs $50k-75k, 0.4% for AGIs $75k-100k, 0.8% for AGIs $100k-200k, 7.9% for AGIs over 200k)
Profit/loss from business: +$15,846 (reported on 14.7% of returns)
Here:
+$15,846
State:
+$15,240
(% of AGI for various income ranges: 8.5% for AGIs below $25k, 3.1% for AGIs $25k-50k, 1.4% for AGIs $50k-75k, 1.9% for AGIs $75k-100k, 3.5% for AGIs $100k-200k, 7.5% for AGIs over 200k)
Taxable individual retirement arrangement distribution: $13,006 (reported on 12.0% of returns)
37763:
$13,006
Tennessee:
$15,505
(% of AGI for various income ranges: 2.9% for AGIs below $25k, 2.8% for AGIs $25k-50k, 2.8% for AGIs $50k-75k, 3.0% for AGIs $75k-100k, 2.9% for AGIs $100k-200k, 1.9% for AGIs over 200k)
Self-employment retirement plans: $18,620 (reported on 0.7% of returns)
37763:
$18,620
Tennessee:
$22,567
Total itemized deductions: $20,878 (19% of AGI, reported on 25.1% of returns)
Here:
$20,878
State:
$21,976
Here:
19.0% of AGI
State:
17.8% of AGI
(% of AGI for various income ranges: 8.8% for AGIs below $25k, 8.4% for AGIs $25k-50k, 9.7% for AGIs $50k-75k, 9.0% for AGIs $75k-100k, 9.7% for AGIs $100k-200k, 8.0% for AGIs over 200k)
Charity contributions: $6,483 (reported on 20.0% of returns)
Here:
$6,483
State:
$6,709
(% of AGI for various income ranges: 0.9% for AGIs below $25k, 1.3% for AGIs $25k-50k, 1.7% for AGIs $50k-75k, 2.3% for AGIs $75k-100k, 2.7% for AGIs $100k-200k, 3.2% for AGIs over 200k)
Taxes paid: $4,680 (reported on 24.7% of returns)
37763:
$4,680
State:
$4,829
(% of AGI for various income ranges: 1.3% for AGIs below $25k, 2.0% for AGIs $25k-50k, 1.7% for AGIs $50k-75k, 2.0% for AGIs $75k-100k, 2.5% for AGIs $100k-200k, 1.8% for AGIs over 200k)
Earned income credit: $2,078 (reported on 16.8% of returns)
Here:
$2,078
State:
$2,404
(% of AGI for various income ranges: 6.0% for AGIs below $25k, 0.9% for AGIs $25k-50k)
Percentage of individuals using paid preparers for their 2012 taxes: 50.4%
Here:
50%
State:
52%
(% for various income ranges: 46.0% for AGIs below $25k, 52.0% for AGIs $25k-50k, 54.0% for AGIs $50k-75k, 53.4% for AGIs $75k-100k, 52.3% for AGIs $100k-200k, 58.8% for AGIs over 200k)
Averages for the 2004 tax year for zip code 37763, filed in 2005:
Average Adjusted Gross Income (AGI) in 2004: $45,158 (Individual Income Tax Returns)
Here:
$45,158
State:
$44,088
Salary/wage: $41,244 (reported on 81.3% of returns)
Here:
$41,244
State:
$38,825
(% of AGI for various income ranges: 119.0% for AGIs below $10k, 67.7% for AGIs $10k-25k, 74.5% for AGIs $25k-50k, 78.0% for AGIs $50k-75k, 81.8% for AGIs $75k-100k, 66.5% for AGIs over 100k)
Taxable interest for individuals: $1,441 (reported on 48.7% of returns)
This zip code:
$1,441
Tennessee:
$1,802
(% of AGI for various income ranges: 7.3% for AGIs below $10k, 2.5% for AGIs $10k-25k, 1.9% for AGIs $25k-50k, 1.3% for AGIs $50k-75k, 0.9% for AGIs $75k-100k, 1.4% for AGIs over 100k)
Taxable dividends: $2,158 (reported on 19.2% of returns)
Here:
$2,158
State:
$3,727
(% of AGI for various income ranges: 4.4% for AGIs below $10k, 0.9% for AGIs $10k-25k, 0.8% for AGIs $25k-50k, 0.9% for AGIs $50k-75k, 0.8% for AGIs $75k-100k, 0.9% for AGIs over 100k)
Net capital gain/loss: +$8,789 (reported on 16.4% of returns)
Here:
+$8,789
State:
+$15,776
(% of AGI for various income ranges: -1.2% for AGIs below $10k, 0.2% for AGIs $10k-25k, 0.5% for AGIs $25k-50k, 1.3% for AGIs $50k-75k, 1.8% for AGIs $75k-100k, 8.1% for AGIs over 100k)
Profit/loss from business: +$12,909 (reported on 16.2% of returns)
Here:
+$12,909
State:
+$12,882
(% of AGI for various income ranges: 1.5% for AGIs below $10k, 4.9% for AGIs $10k-25k, 2.9% for AGIs $25k-50k, 2.8% for AGIs $50k-75k, 2.2% for AGIs $75k-100k, 8.7% for AGIs over 100k)
IRA payment deduction: $3,241 (reported on 2.0% of returns)
37763:
$3,241
Tennessee:
$2,934
(% of AGI for various income ranges: 1.0% for AGIs below $10k, 0.2% for AGIs $25k-50k, 0.2% for AGIs $50k-75k, 0.1% for AGIs $75k-100k, 0.1% for AGIs over 100k)
Self-employed pension: $18,043 (reported on 0.7% of returns)
Here:
$18,043
Tennessee:
$16,857
Total itemized deductions: $16,794 (21% of AGI, reported on 24.2% of returns)
Here:
$16,794
State:
$18,035
Here:
21.1% of AGI
State:
19.9% of AGI
(% of AGI for various income ranges: 12.9% for AGIs below $10k, 6.7% for AGIs $10k-25k, 8.4% for AGIs $25k-50k, 8.4% for AGIs $50k-75k, 9.5% for AGIs $75k-100k, 9.9% for AGIs over 100k)
Charity contributions deductions: $4,555 (5% of AGI, reported on 20.4% of returns)
Here:
$4,555
State:
$5,167
Here:
5.4% of AGI
State:
5.3% of AGI
(% of AGI for various income ranges: 0.7% for AGIs below $10k, 1.1% for AGIs $10k-25k, 1.4% for AGIs $25k-50k, 1.6% for AGIs $50k-75k, 2.4% for AGIs $75k-100k, 2.9% for AGIs over 100k)
Total tax: $6,614 (reported on 77.3% of returns)
37763:
$6,614
State:
$7,482
(% of AGI for various income ranges: 3.8% for AGIs below $10k, 3.9% for AGIs $10k-25k, 6.9% for AGIs $25k-50k, 9.4% for AGIs $50k-75k, 11.2% for AGIs $75k-100k, 18.0% for AGIs over 100k)
Earned income credit: $1,590 (reported on 14.5% of returns)
Here:
$1,590
State:
$1,826
Percentage of individuals using paid preparers for their 2004 taxes: 53.0%
Here:
53%
State:
60%
(% for various income ranges: 44.6% for AGIs below $10k, 56.6% for AGIs $10k-25k, 56.6% for AGIs $25k-50k, 54.4% for AGIs $50k-75k, 50.0% for AGIs $75k-100k, 53.5% for AGIs over 100k)
Likely homosexual households (counted as self-reported same-sex unmarried-partner households)
Lesbian couples: 0.0% of all households
Gay men: 0.3% of all households
Household received Food Stamps/SNAP in the past 12 months: 589 Household did not receive Food Stamps/SNAP in the past 12 months: 6,439
Women who had a birth in the past 12 months: 228 (226 now married, 5 unmarried) Women who did not have a birth in the past 12 months: 3,186 (1,665 now married, 1,521 unmarried)
Housing units in zip code 37763 with a mortgage: 2,745 (339 second mortgage, 344 both second mortgage and home equity loan) Houses without a mortgage: 123
Median monthly owner costs for units with a mortgage: $1,416 Median monthly owner costs for units without a mortgage: $469
Residents with income below the poverty level in 2022:
This zip code:
7.6%
Whole state:
13.3%
Residents with income below 50% of the poverty level in 2022:
This zip code:
3.2%
Whole state:
7.1%
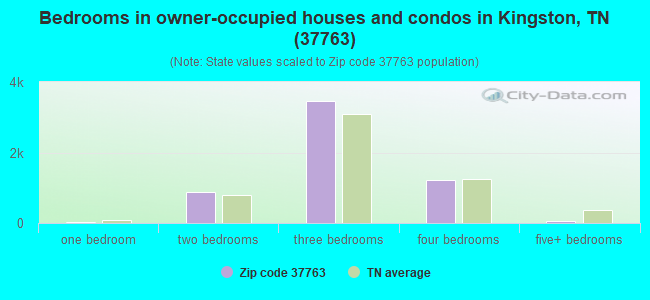
Median number of rooms in houses and condos:
Here:
6.4
State:
6.5
Median number of rooms in apartments:
Here:
4.9
State:
4.4
Notable locations in this zip code not listed on our city pages
Notable locations in zip code 37763: Lakeside Golf Course (A), Southwest Point Golf Course (B), R C Marina (C), Long Island Dock (D), Merriwater Homepark (E), Kingston Fire Department (F), South Roane County Volunteer Fire Department Station 1 (G), Kingston Fire Department Station 2 (H), East Roane County Volunteer Fire Department Station 5 Lawnville (I), East Roane County Volunteer Fire Department Station 4 Dogwood Shores (J), South Roane County Volunteer Fire Department Station 2 (K), East Roane County Volunteer Fire Department Station 3 New Midway (L). Display/hide their locations on the map
Churches in zip code 37763 include: BEthel United Presbyterian Church (A), Braxton Chapel African Methodist Episcopal Church (B), Calvary Baptist Church (C), Kingston Church of Christ (D), Kingston United Methodist Church (E), Bradbury United Methodist Church (F), Cedar Grove Church (G), Chapman Grove Church (H), New Midway Church (I). Display/hide their locations on the map
Cemeteries: Isham Cemetery (1), Seuler Cemetery (2), Johnston Cemetery (3), Kingston Memorial Gardens (4), Lacy Cemetery (5), Ladd Cemetery (6), Williams Cemetery (7). Display/hide their locations on the map
Streams, rivers, and creeks: Laurel Bluff Branch (A), Ladd Creek (B), Johnson Creek (C), Huffine Branch (D), Hood Branch (E), Holder Ford Branch (F), Greasy Run Creek (G), Smith Creek (H), Cave Creek (I). Display/hide their locations on the map
Parks in zip code 37763 include: Long Island Wildlife Management Area (1), Riley Creek Recreational Area (2), Kingston Waterfront Park (3), Kingston City Park (4), Paint Rock Wildlife Management Area (5), Southwest Point Park (6). Display/hide their locations on the map
In group quarters: 228 (-1 institutionalized population)
Size of family households: 2,610 2-persons, 1,142 3-persons, 740 4-persons, 266 5-persons, 96 6-persons, 98 7-or-more-persons
Size of nonfamily households: 1,787 1-person, 271 2-persons
1,956 married couples with children.
363 single-parent households (162 men, 201 women).
97.5% of residents of 37763 zip code speak English at home.
1.4% of residents speak Spanish at home (45% very well, 26% well, 14% not well, 14% not at all).
0.9% of residents speak other Indo-European language at home (97% very well, 3% well).
0.3% of residents speak Asian or Pacific Island language at home (43% very well, 19% well, 38% not well).
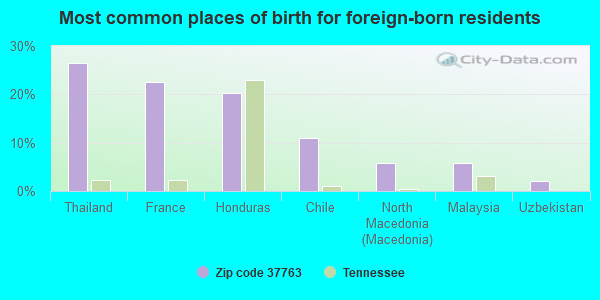
Foreign born population: 275 (1.7%) (72.1% of them are naturalized citizens)
This zip code:
1.7%
Whole state:
5.6%
26%Thailand
22%France
20%Honduras
11%Chile
6%North Macedonia (Macedonia)
6%Malaysia
2%Uzbekistan
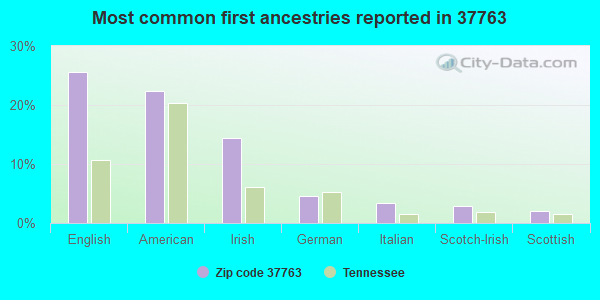
26%English
22%American
14%Irish
5%German
3%Italian
3%Scotch-Irish
2%Scottish
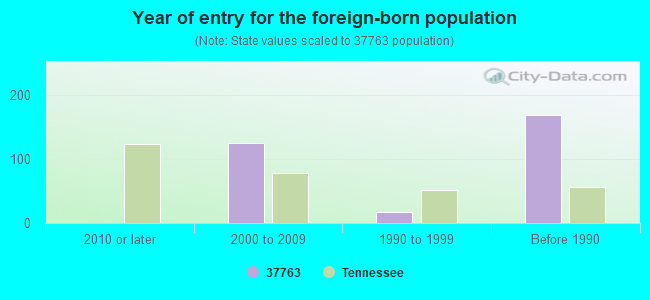
Year of entry for the foreign-born population
02010 or later
1252000 to 2009
171990 to 1999
169Before 1990
Facilities with environmental interests located in this zip code:
DIVERSIFIED SCIENTIFIC SERVICE S INC. (DSSI) (657 GALLAHER ROAD in KINGSTON, TN)
AIR SYNTHETIC MINOR (AIRS/AFS) CRITERIA AND HAZARDOUS AIR POLLUTANT INVENTORY (Inventory of air pollution sources) HAZARDOUS WASTE BIENNIAL REPORTER (Resource Conservation and Recovery Act (tracking hazardous waste)) Large Quantity Generators, more that 1000 kg of hazardous waste/month (Resource Conservation and Recovery Act (tracking hazardous waste)) TSD (Resource Conservation and Recovery Act (tracking hazardous waste)) USED OIL PROGRAM (Resource Conservation and Recovery Act (tracking hazardous waste)) TRI REPORTER (Tracking of toxic chemicals releasing facilities) Business SIC classification: REFUSE SYSTEMS Business NAICS classification: HAZARDOUS WASTE TREATMENT AND DISPOSAL. Organizations: JOSEPH W. CRIDER (CONTACT/OPERATOR)
, PERMA-FIX ENVIRONMENTAL SERVICES (CONTACT/OWNER)
Alternative names: DIVERSIFIED SCIENTIFIC SERVICES INC., DIVERSIFIED SCIENTIFIC SERVICES INC. (DSSI)
CHEROKEE MIDDLE SCHOOL (200 PAINT ROCK FERRY RD in KINGSTON, TN)
(Geographic Names Information System) (National Center for Education Statistics) - STATE ID-0005 Organizations: ROANE COUNTY SCHOOL DISTRICT (SCHOOL DISTRICT)
ATG CATALYTIC (1556 BEAR CREEK ROAD in KINGSTON, TN)
HAZARDOUS WASTE BIENNIAL REPORTER (Resource Conservation and Recovery Act (tracking hazardous waste)) Large Quantity Generators, more that 1000 kg of hazardous waste/month (Resource Conservation and Recovery Act (tracking hazardous waste)) - notification
CENTRAL AUTO PARTS & SUPPLIES INC (134 E CUMBERLAND ST in KINGSTON, TN)
(Resource Conservation and Recovery Act (tracking hazardous waste)) Business NAICS classification: ALL OTHER AUTOMOTIVE REPAIR AND MAINTENANCE.
COAL ENERGY, INC. (LOWE, JAMES A.) (RIVER ROAD in KINGSTON, TN)
(Resource Conservation and Recovery Act (tracking hazardous waste))
AVISCO, INC. (145 CEDAR BROOK LANE in KINGSTON, TN)
AIR SYNTHETIC MINOR (AIRS/AFS) Business SIC classification: NONMETALLIC MINERAL PRODUCTS
CUSTOM METAL SERVICE (HIGHWAY 70 in KINGSTON, TN)
AIR MAJOR (AIRS/AFS) Business SIC classification: ELECTROPLATING, PLATING, POLISHING, ANODIZING, AND COLORING
Housing units lacking complete plumbing facilities: 0.2% Housing units lacking complete kitchen facilities: 1.7%
71.8%Electricity
20.5%Utility gas
5.4%Bottled, tank, or LP gas
1.9%Wood
Population in 1990: 11,002. Population change in the 1990s: +3,570 (+32.4%).
Place of birth for U.S.-born residents:
This state: 10,881
Northeast: 1,011
Midwest: 1,390
South: 2,233
West: 777
61% of the 37763 zip code residents lived in the same house 5 years ago. Out of people who lived in different houses, 53% lived in this county. Out of people who lived in different counties, 50% lived in Tennessee.
88% of the 37763 zip code residents lived in the same house 1 year ago. Out of people who lived in different houses, 38% moved from this county. Out of people who lived in different houses, 18% moved from different county within same state. Out of people who lived in different houses, 45% moved from different state.
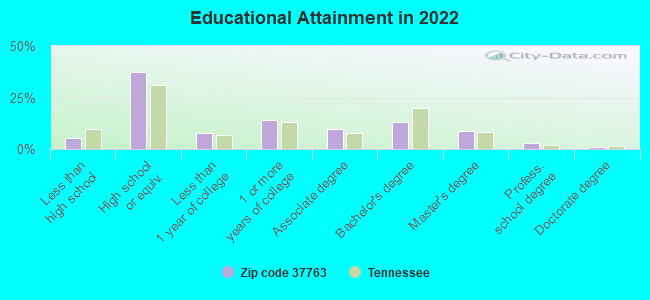
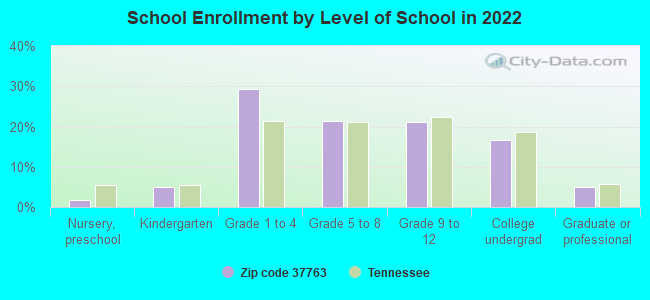
Private vs. public school enrollment:
Students in private schools in grades 1 to 8 (elementary and middle school): 418
Here:
27.2%
Tennessee:
15.0%
Students in private schools in grades 9 to 12 (high school): 150
Here:
23.8%
Tennessee:
16.2%
Students in private undergraduate colleges: 95
Here:
19.2%
Tennessee:
23.5%
Occupation by median earnings in the past 12 months ($)
115,685Life, physical, and social science occupations
100,759Computer and mathematical occupations
88,318Architecture and engineering occupations
78,570Management occupations
60,151Installation, maintenance, and repair occupations
57,829Fire fighting and prevention, and other protective service workers including supervisors
Companies with federal contracts located in this zip code:
HITTMAN TRANSPORT SERVICES, IN (628 GALLAHER RD in KINGSTON, TN)
$3,250 with Army for Trailers. Taking place in SC. Signed on 2005-03-04. Completion date: 2005-04-04.
GTS INSTRUMENT SERVICES INC (628 GALLAHER RD in KINGSTON, TN)
-$320 with Army for Development of Environmental Impact Statements and Assessments. Taking place in MD. Signed on 2005-07-11. Completion date: 2000-09-30.
Top industries in this zip code by the number of employees in 2005:
Health Care and Social Assistance: Services for the Elderly and Persons with Disabilities (100-249: 1)
Other Services (except Public Administration): Religious Organizations (20-49: 1, 10-19: 5, 5-9: 1, 1-4: 7)
Administrative and Support and Waste Management and Remediation Services: Janitorial Services (20-49: 2, 10-19: 1, 1-4: 1)
Administrative and Support and Waste Management and Remediation Services: Hazardous Waste Treatment and Disposal (50-99: 1)
Health Care and Social Assistance: Residential Mental Health and Substance Abuse Facilities (50-99: 1)
Health Care and Social Assistance: Residential Mental Retardation Facilities (20-49: 1, 10-19: 1, 5-9: 3)
People in group quarters in 2010:
100 people in local jails and other municipal confinement facilities
42 people in nursing facilities/skilled-nursing facilities
36 people in residential treatment centers for juveniles (non-correctional)
16 people in group homes intended for adults
9 people in other noninstitutional facilities
People in group quarters in 2000:
72 people in local jails and other confinement facilities (including police lockups)
38 people in homes for the mentally retarded
20 people in mental (psychiatric) hospitals or wards
19 people in nursing homes
16 people in other group homes
16 people in other noninstitutional group quarters
6 people in unknown juvenile institutions
Fatal accident statistics in 2014:
Fatal accident count: 3
Vehicles involved in fatal accidents: 6
Fatal accidents caused by drunken drivers: 1
Fatalities: 3
Persons involved in fatal accidents: 9
Pedestrians involved in fatal accidents: 0
Fatal accident statistics in 2012:
Fatal accident count: 2
Vehicles involved in fatal accidents: 3
Fatal accidents caused by drunken drivers: 0
Fatalities: 2
Persons involved in fatal accidents: 4
Pedestrians involved in fatal accidents: 0
2002 - 2018 National Fire Incident Reporting System (NFIRS) incidents
Based on the data from the years 2002 - 2018 the average number of fires per year is 91. The highest number of reported fire incidents - 144 took place in 2018, and the least - 26 in 2003. The data has a growing trend.
When looking into fire subcategories, the most reports belonged to: Structure Fires (40.2%), and Outside Fires (39.4%).
Fire incident types reported to NFIRS in Zip Code 37763
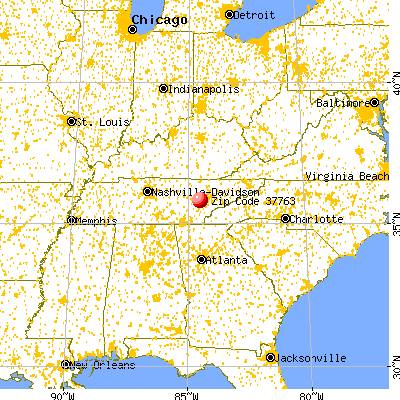


 Nearest zip codes: 37748, 37846, 37774, 37771, 37719, 37874.
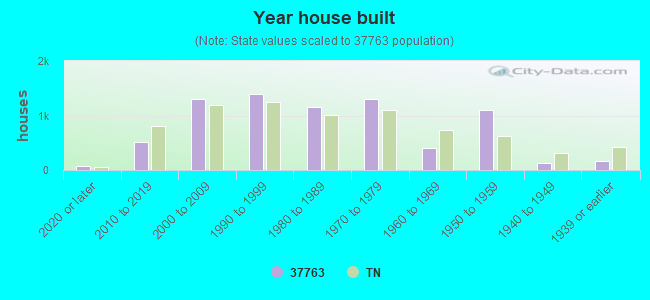


 Based on the data from the years 2002 - 2018 the average number of fires per year is 91. The highest number of reported fire incidents - 144 took place in 2018, and the least - 26 in 2003. The data has a growing trend.
 When looking into fire subcategories, the most reports belonged to: Structure Fires (40.2%), and Outside Fires (39.4%).