Estimated zip code population in 2022: 3,438 Zip code population in 2010: 3,978 Zip code population in 2000: 3,446
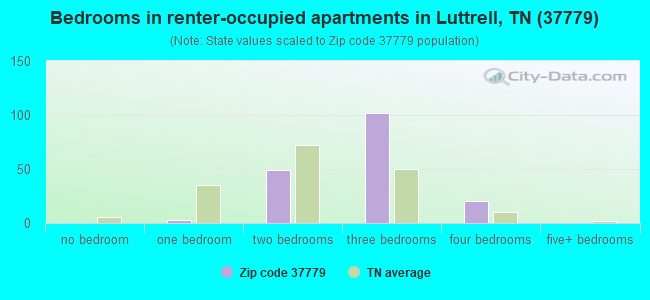
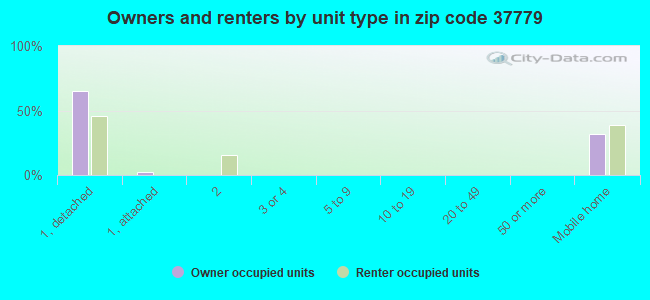
Houses and condos: 1,583 Renter-occupied apartments: 177
% of renters here:
13%
State:
33%
March 2022 cost of living index in zip code 37779: 79.3 (low, U.S. average is 100)
Land area: 38.2 sq. mi. Water area: 0.0 sq. mi.
Population density: 90 people per square mile
(very low).
OSM Map
General Map
Google Map
MSN Map
OSM Map
General Map
Google Map
MSN Map
OSM Map
General Map
Google Map
MSN Map
OSM Map
General Map
Google Map
MSN Map
Please wait while loading the map...
Real estate property taxes paid for housing units in 2022:
This zip code:
0.3% ($584)
Tennessee:
0.5% ($1,376)
Median real estate property taxes paid for housing units with mortgages in 2022: $662 (0.3%) Median real estate property taxes paid for housing units with no mortgage in 2022: $504 (0.4%)
Business Search- 14 Million verified businesses
Males: 1,658
(48.2%)
Females: 1,779
(51.8%)
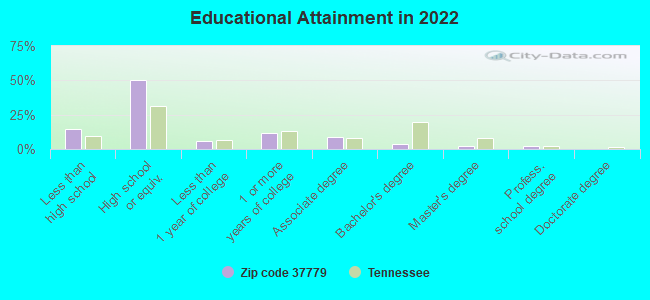
For population 25 years and over in 37779:
High school or higher: 82.6%
Bachelor's degree or higher: 7.8%
Graduate or professional degree: 4.4%
Unemployed: 4.7%
Mean travel time to work (commute): 34.2 minutes
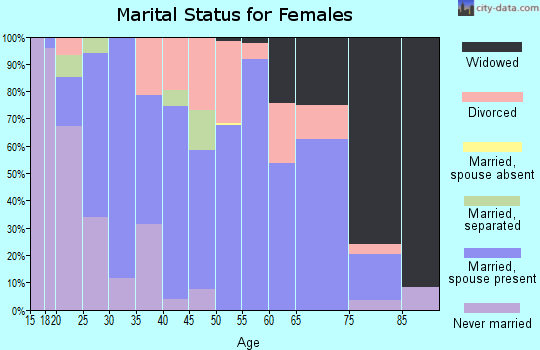
For population 15 years and over in 37779:
Never married: 21.4%
Now married: 57.3%
Separated: 3.7%
Widowed: 6.5%
Divorced: 11.1%
Zip code 37779 compared to state average:
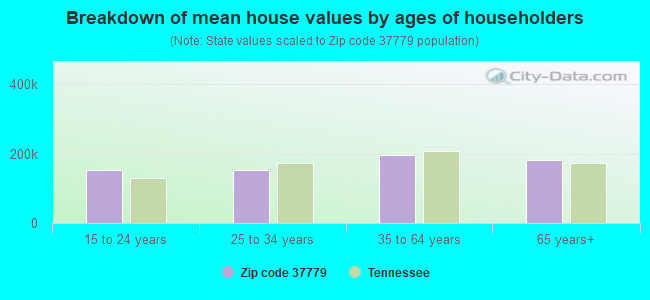
Median house value below state average.
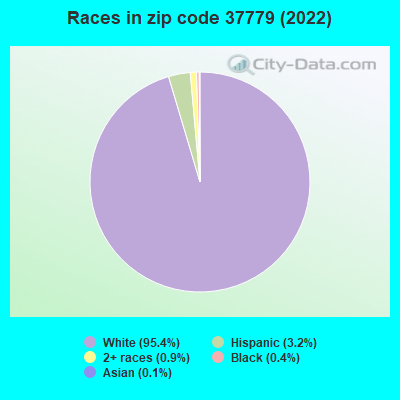
Black race population percentage significantly below state average.
Hispanic race population percentage below state average.
Median age above state average.
Foreign-born population percentage significantly below state average.
Renting percentage significantly below state average.
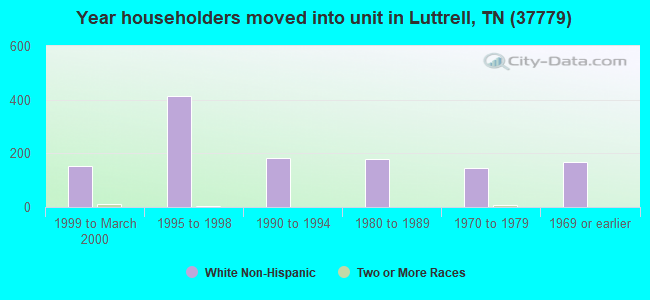
Length of stay since moving in significantly above state average.
Percentage of population with a bachelor's degree or higher significantly below state average.
Averages for the 2020 tax year for zip code 37779, filed in 2021:
Average Adjusted Gross Income (AGI) in 2020: $43,527 (Individual Income Tax Returns)
Here:
$43,527
State:
$69,014
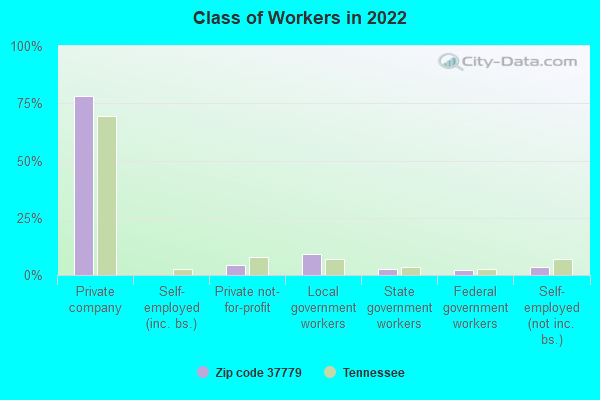
Salary/wage: $40,155 (reported on 83.2% of returns)
Here:
$40,155
State:
$55,872
(% of AGI for various income ranges: 1046.4% for AGIs below $25k, 3529.5% for AGIs $25k-50k, 6594.4% for AGIs $50k-75k, 8237.0% for AGIs $75k-100k, 15615.6% for AGIs $100k-200k)
Taxable interest for individuals: $322 (reported on 20.6% of returns)
This zip code:
$322
Tennessee:
$1,945
(% of AGI for various income ranges: 5.3% for AGIs below $25k, 8.4% for AGIs $25k-50k, 10.0% for AGIs $50k-75k, 7.0% for AGIs $75k-100k, 22.2% for AGIs $100k-200k)
Ordinary dividends: $2,200 (reported on 3.9% of returns)
Here:
$2,200
State:
$8,105
(% of AGI for various income ranges: 14.7% for AGIs $25k-50k, 76.0% for AGIs $75k-100k)
Net capital gain/loss in AGI: +$9,757 (reported on 4.5% of returns)
Here:
+$9,757
State:
+$33,664
(% of AGI for various income ranges: 21.3% for AGIs $25k-50k, 668.9% for AGIs $100k-200k)
Profit/loss from business: +$14,712 (reported on 16.1% of returns)
Here:
+$14,712
State:
+$18,991
(% of AGI for various income ranges: 215.8% for AGIs below $25k, 226.1% for AGIs $25k-50k, 54.4% for AGIs $50k-75k, 511.0% for AGIs $75k-100k, 1196.7% for AGIs $100k-200k)
Taxable individual retirement arrangement distribution: $10,557 (reported on 4.5% of returns)
37779:
$10,557
Tennessee:
$20,036
(% of AGI for various income ranges: 22.5% for AGIs below $25k, 36.3% for AGIs $25k-50k, 301.2% for AGIs $50k-75k)
Earned income credit: $2,493 (reported on 26.5% of returns)
Here:
$2,493
State:
$2,391
(% of AGI for various income ranges: 133.2% for AGIs below $25k, 83.2% for AGIs $25k-50k)
Percentage of individuals using paid preparers for their 2020 taxes: 95.5%
Here:
95%
State:
93%
(% for various income ranges: 95.3% for AGIs below $25k, 95.6% for AGIs $25k-50k, 95.0% for AGIs $50k-75k, 100.0% for AGIs $75k-100k, 92.9% for AGIs $100k-200k)
Averages for the 2012 tax year for zip code 37779, filed in 2013:
Average Adjusted Gross Income (AGI) in 2012: $33,516 (Individual Income Tax Returns)
Here:
$33,516
State:
$53,767
Salary/wage: $32,073 (reported on 83.7% of returns)
Here:
$32,073
State:
$45,421
(% of AGI for various income ranges: 74.1% for AGIs below $25k, 83.5% for AGIs $25k-50k, 84.8% for AGIs $50k-75k, 83.6% for AGIs $75k-100k, 69.0% for AGIs $100k-200k)
Taxable interest for individuals: $677 (reported on 19.3% of returns)
This zip code:
$677
Tennessee:
$1,732
(% of AGI for various income ranges: 0.8% for AGIs below $25k, 0.2% for AGIs $25k-50k, 0.3% for AGIs $50k-75k, 0.5% for AGIs $75k-100k, 0.5% for AGIs $100k-200k)
Ordinary dividends: $833 (reported on 4.4% of returns)
Here:
$833
State:
$6,739
Net capital gain/loss in AGI: +$1,617 (reported on 4.4% of returns)
Here:
+$1,617
State:
+$19,082
Profit/loss from business: +$9,952 (reported on 17.0% of returns)
Here:
+$9,952
State:
+$15,240
(% of AGI for various income ranges: 14.2% for AGIs below $25k, 5.7% for AGIs $25k-50k, 2.9% for AGIs $50k-75k)
Taxable individual retirement arrangement distribution: $11,686 (reported on 5.2% of returns)
37779:
$11,686
Tennessee:
$15,505
Total itemized deductions: $18,775 (28% of AGI, reported on 8.9% of returns)
Here:
$18,775
State:
$21,976
Here:
27.9% of AGI
State:
17.8% of AGI
(% of AGI for various income ranges: 6.1% for AGIs $25k-50k, 5.2% for AGIs $50k-75k, 13.9% for AGIs $75k-100k)
Charity contributions: $4,767 (reported on 6.7% of returns)
Here:
$4,767
State:
$6,709
(% of AGI for various income ranges: 1.0% for AGIs below $25k, 0.7% for AGIs $50k-75k, 4.3% for AGIs $75k-100k)
Taxes paid: $3,025 (reported on 8.9% of returns)
37779:
$3,025
State:
$4,829
(% of AGI for various income ranges: 0.8% for AGIs $25k-50k, 0.8% for AGIs $50k-75k, 2.7% for AGIs $75k-100k)
Earned income credit: $2,519 (reported on 34.8% of returns)
Here:
$2,519
State:
$2,404
(% of AGI for various income ranges: 10.5% for AGIs below $25k, 2.2% for AGIs $25k-50k)
Percentage of individuals using paid preparers for their 2012 taxes: 68.1%
Here:
68%
State:
52%
(% for various income ranges: 66.7% for AGIs below $25k, 73.7% for AGIs $25k-50k, 66.7% for AGIs $50k-75k, 62.5% for AGIs $75k-100k, 60.0% for AGIs $100k-200k)
Averages for the 2004 tax year for zip code 37779, filed in 2005:
Average Adjusted Gross Income (AGI) in 2004: $27,733 (Individual Income Tax Returns)
Here:
$27,733
State:
$44,088
Salary/wage: $26,998 (reported on 86.5% of returns)
Here:
$26,998
State:
$38,825
(% of AGI for various income ranges: 93.8% for AGIs below $10k, 82.8% for AGIs $10k-25k, 89.3% for AGIs $25k-50k, 87.0% for AGIs $50k-75k, 88.1% for AGIs $75k-100k, 54.0% for AGIs over 100k)
Taxable interest for individuals: $971 (reported on 26.2% of returns)
This zip code:
$971
Tennessee:
$1,802
(% of AGI for various income ranges: 1.6% for AGIs below $10k, 1.6% for AGIs $10k-25k, 0.6% for AGIs $25k-50k, 0.5% for AGIs $50k-75k, 0.9% for AGIs $75k-100k, 1.8% for AGIs over 100k)
Taxable dividends: $1,023 (reported on 6.0% of returns)
Here:
$1,023
State:
$3,727
(% of AGI for various income ranges: 0.1% for AGIs $10k-25k, 0.1% for AGIs $25k-50k, 0.1% for AGIs $50k-75k, 1.4% for AGIs over 100k)
Net capital gain/loss: +$312 (reported on 5.4% of returns)
Here:
+$312
State:
+$15,776
(% of AGI for various income ranges: 0.2% for AGIs $10k-25k, -0.1% for AGIs $25k-50k, -0.1% for AGIs $50k-75k, 0.5% for AGIs over 100k)
Profit/loss from business: +$5,929 (reported on 17.8% of returns)
Here:
+$5,929
State:
+$12,882
(% of AGI for various income ranges: 12.5% for AGIs below $10k, 6.9% for AGIs $10k-25k, 3.2% for AGIs $25k-50k, 3.7% for AGIs $50k-75k)
IRA payment deduction: $2,300 (reported on 0.7% of returns)
37779:
$2,300
Tennessee:
$2,934
Total itemized deductions: $15,883 (30% of AGI, reported on 9.6% of returns)
Here:
$15,883
State:
$18,035
Here:
30.1% of AGI
State:
19.9% of AGI
(% of AGI for various income ranges: 3.7% for AGIs $10k-25k, 4.4% for AGIs $25k-50k, 8.4% for AGIs $50k-75k, 6.6% for AGIs $75k-100k, 8.0% for AGIs over 100k)
Charity contributions deductions: $3,406 (6% of AGI, reported on 7.4% of returns)
Here:
$3,406
State:
$5,167
Here:
6.0% of AGI
State:
5.3% of AGI
(% of AGI for various income ranges: 0.2% for AGIs $10k-25k, 0.6% for AGIs $25k-50k, 2.0% for AGIs $50k-75k, 2.2% for AGIs over 100k)
Total tax: $3,009 (reported on 67.1% of returns)
37779:
$3,009
State:
$7,482
(% of AGI for various income ranges: 4.3% for AGIs below $10k, 3.9% for AGIs $10k-25k, 5.8% for AGIs $25k-50k, 8.1% for AGIs $50k-75k, 11.1% for AGIs $75k-100k, 16.5% for AGIs over 100k)
Earned income credit: $1,862 (reported on 30.8% of returns)
Here:
$1,862
State:
$1,826
Percentage of individuals using paid preparers for their 2004 taxes: 74.0%
Here:
74%
State:
60%
(% for various income ranges: 65.9% for AGIs below $10k, 77.2% for AGIs $10k-25k, 75.4% for AGIs $25k-50k, 77.6% for AGIs $50k-75k, 70.3% for AGIs $75k-100k, 80.0% for AGIs over 100k)
Likely homosexual households (counted as self-reported same-sex unmarried-partner households)
Lesbian couples: 0.3% of all households
Gay men: 0.0% of all households
Household received Food Stamps/SNAP in the past 12 months: 197 Household did not receive Food Stamps/SNAP in the past 12 months: 1,143
Women who had a birth in the past 12 months: 17 (10 now married, 7 unmarried) Women who did not have a birth in the past 12 months: 660 (396 now married, 264 unmarried)
Housing units in zip code 37779 with a mortgage: 453 (35 second mortgage, 35 both second mortgage and home equity loan) Median monthly owner costs for units with a mortgage: $1,162 Median monthly owner costs for units without a mortgage: $310
Residents with income below the poverty level in 2022:
This zip code:
13.9%
Whole state:
13.3%
Residents with income below 50% of the poverty level in 2022:
This zip code:
9.9%
Whole state:
7.1%
Median number of rooms in houses and condos:
Here:
5.4
State:
6.5
Median number of rooms in apartments:
Here:
4.9
State:
4.4
Notable locations in this zip code not listed on our city pages
Churches in zip code 37779 include: Cedar Ford Church (A), Holiness Church (B), Willow Spring Church (C), Wyrick Chapel (D), Zion Church (E), New Friendship Church (F), Navehill Church (G). Display/hide their locations on the map
Cemeteries: Hubbs Cemetery (1), Sharp Cemetery (2), Kitts Cemetery (3), Wyrick Cemetery (4), Archer Cemetery (5), Baker Cemetery (6), Brock Cemetery (7). Display/hide their locations on the map
Streams, rivers, and creeks: Little Branch (A), Woods Gap Branch (B), Dryland Branch (C), Crooked Run (D), Hamilton Gap Branch (E), Bradley Branch (F), Little Creek (G), North Fork Bullrun Creek (H). Display/hide their locations on the map
Size of family households: 494 2-persons, 293 3-persons, 184 4-persons, 61 5-persons, 11 6-persons
Size of nonfamily households: 280 1-person, 15 2-persons
402 married couples with children.
128 single-parent households (14 men, 114 women).
99.0% of residents of 37779 zip code speak English at home.
0.8% of residents speak Spanish at home (67% very well, 33% well).
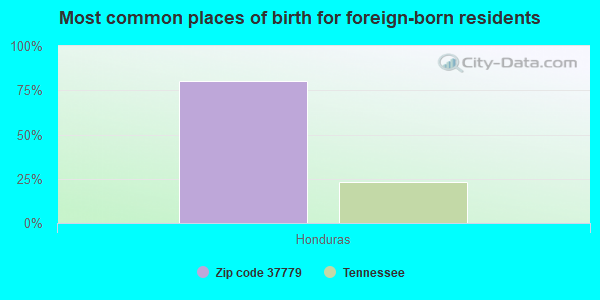
Foreign born population: 10 (0.3%) (49.6% of them are naturalized citizens)
This zip code:
0.3%
Whole state:
5.6%
80%Honduras
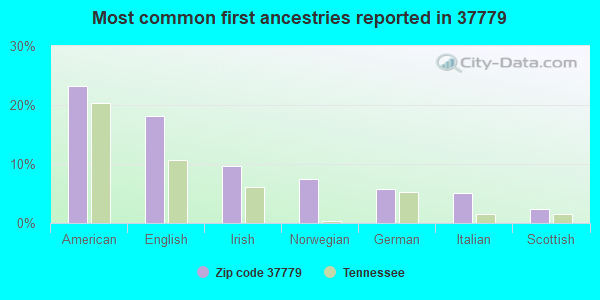
23%American
18%English
10%Irish
7%Norwegian
6%German
5%Italian
2%Scottish
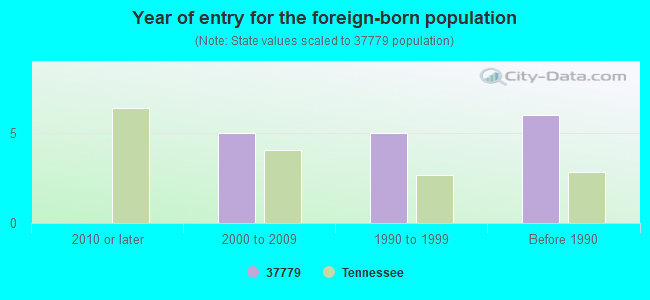
Year of entry for the foreign-born population
02010 or later
52000 to 2009
51990 to 1999
6Before 1990
Facilities with environmental interests located in this zip code:
DOMERMUTH ENVIRONMENTAL SERVICE, LLC (299 WOLF ROAD in LUTTRELL, TN)
AIR MINOR (AIRS/AFS) Business SIC classification: OIL AND GAS FIELD SERVICES
Housing units lacking complete plumbing facilities: 5.4% Housing units lacking complete kitchen facilities: 4.9%
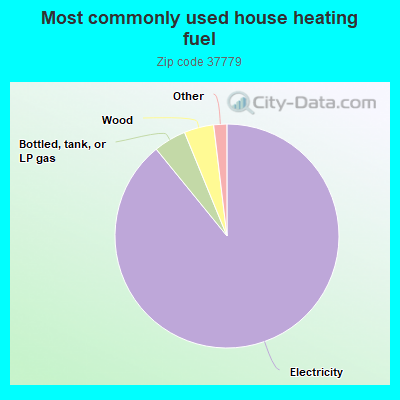
89.3%Electricity
4.7%Bottled, tank, or LP gas
4.3%Wood
0.9%Utility gas
0.5%No fuel used
Population in 1990: 3,554.
Place of birth for U.S.-born residents:
This state: 2,732
Northeast: 98
Midwest: 233
South: 267
West: 49
68% of the 37779 zip code residents lived in the same house 5 years ago. Out of people who lived in different houses, 51% lived in this county. Out of people who lived in different counties, 50% lived in Tennessee.
99% of the 37779 zip code residents lived in the same house 1 year ago. Out of people who lived in different houses, 60% moved from this county. Out of people who lived in different houses, 87% moved from different county within same state. Out of people who lived in different houses, 53% moved from different state.
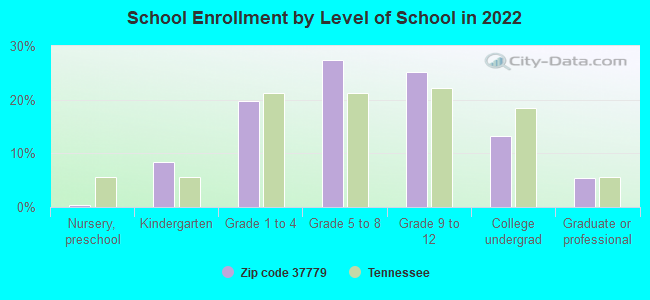
Private vs. public school enrollment:
Students in private schools in grades 1 to 8 (elementary and middle school): 17
Here:
5.7%
Tennessee:
15.0%
Students in private schools in grades 9 to 12 (high school): 22
Here:
13.6%
Tennessee:
16.2%
Students in private undergraduate colleges: 19
Here:
21.9%
Tennessee:
23.5%
Occupation by median earnings in the past 12 months ($)
73,590Transportation occupations
63,278Installation, maintenance, and repair occupations
61,427Management occupations
40,066Production occupations
37,724Building and grounds cleaning and maintenance occupations
34,673Construction and extraction occupations
Top industries in this zip code by the number of employees in 2005:
Construction: Plumbing, Heating, and Air-Conditioning Contractors (10-19: 1, 1-4: 1)
Construction: Site Preparation Contractors (5-9: 1, 1-4: 2)
Construction: New Single-Family Housing Construction (except Operative Builders) (5-9: 1, 1-4: 1)
Construction: Power and Communication Line and Related Structures Construction (5-9: 1)
Finance and Insurance: Commercial Banking (5-9: 1)
People in group quarters in 2000:
10 people in nursing homes
8 people in other noninstitutional group quarters
Fatal accident statistics in 2012:
Fatal accident count: 1
Vehicles involved in fatal accidents: 1
Fatal accidents caused by drunken drivers: 0
Fatalities: 1
Persons involved in fatal accidents: 1
Pedestrians involved in fatal accidents: 0
Fatal accident statistics in 2010:
Fatal accident count: 3
Vehicles involved in fatal accidents: 3
Fatal accidents caused by drunken drivers: 1
Fatalities: 3
Persons involved in fatal accidents: 7
Pedestrians involved in fatal accidents: 0
2002 - 2018 National Fire Incident Reporting System (NFIRS) incidents
According to the data from the years 2002 - 2018 the average number of fires per year is 36. The highest number of fires - 69 took place in 2005, and the least - 9 in 2015. The data has a decreasing trend.
When looking into fire subcategories, the most incidents belonged to: Structure Fires (45.6%), and Outside Fires (33.4%).
Fire incident types reported to NFIRS in Zip Code 37779


 Nearest zip codes: 37848, 37807, 37709, 37721, 37806, 37866.


 According to the data from the years 2002 - 2018 the average number of fires per year is 36. The highest number of fires - 69 took place in 2005, and the least - 9 in 2015. The data has a decreasing trend.
 When looking into fire subcategories, the most incidents belonged to: Structure Fires (45.6%), and Outside Fires (33.4%).