Estimated zip code population in 2022: 2,088 Zip code population in 2010: 1,928 Zip code population in 2000: 1,806
Houses and condos: 917 Renter-occupied apartments: 150
% of renters here:
20%
State:
33%
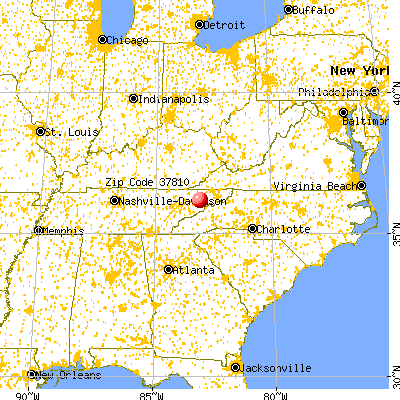
March 2022 cost of living index in zip code 37810: 77.9 (low, U.S. average is 100)
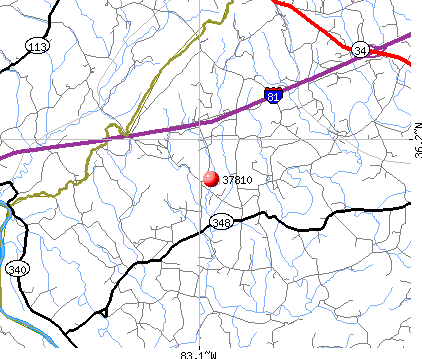
Land area: 33.5 sq. mi. Water area: 0.1 sq. mi.
Population density: 62 people per square mile
(very low).
OSM Map
General Map
Google Map
MSN Map
OSM Map
General Map
Google Map
MSN Map
OSM Map
General Map
Google Map
MSN Map
OSM Map
General Map
Google Map
MSN Map
Please wait while loading the map...
Real estate property taxes paid for housing units in 2022:
This zip code:
0.4% ($696)
Tennessee:
0.5% ($1,376)
Median real estate property taxes paid for housing units with mortgages in 2022: $902 (0.5%) Median real estate property taxes paid for housing units with no mortgage in 2022: $598 (0.6%)
Business Search- 14 Million verified businesses
Males: 1,015
(48.6%)
Females: 1,073
(51.4%)
For population 25 years and over in 37810:
High school or higher: 75.7%
Bachelor's degree or higher: 13.7%
Graduate or professional degree: 7.7%
Unemployed: 6.0%
Mean travel time to work (commute): 28.0 minutes
For population 15 years and over in 37810:
Never married: 22.0%
Now married: 57.6%
Separated: 0.9%
Widowed: 5.2%
Divorced: 14.3%
Zip code 37810 compared to state average:
Median household income below state average.
Median house value below state average.
Unemployed percentage above state average.
Black race population percentage significantly below state average.
Foreign-born population percentage significantly below state average.
Renting percentage below state average.
Length of stay since moving in significantly above state average.
House age above state average.
Number of college students significantly below state average.
Percentage of population with a bachelor's degree or higher significantly below state average.
Estimated median house/condo value in 2022: $163,935
37810:
$163,935
Tennessee:
$284,800
According to our research of Tennessee and other state lists, there were 3 registered sex offenders living in 37810 zip code as of May 28, 2024. The ratio of all residents to sex offenders in zip code 37810 is 576 to 1. The ratio of registered sex offenders to all residents in this zip code is lower than the state average.
Median resident age:
This zip code:
40.3 years
Tennessee median age:
39.2 years
Average household size:
This zip code:
2.8 people
Tennessee:
2.4 people
Averages for the 2020 tax year for zip code 37810, filed in 2021:
Average Adjusted Gross Income (AGI) in 2020: $45,342 (Individual Income Tax Returns)
Here:
$45,342
State:
$69,014
Salary/wage: $41,340 (reported on 85.0% of returns)
Here:
$41,340
State:
$55,872
(% of AGI for various income ranges: 1141.2% for AGIs below $25k, 3521.6% for AGIs $25k-50k, 6415.6% for AGIs $50k-75k, 9502.0% for AGIs $75k-100k, 20105.0% for AGIs $100k-200k)
Taxable interest for individuals: $590 (reported on 25.0% of returns)
This zip code:
$590
Tennessee:
$1,945
(% of AGI for various income ranges: 19.2% for AGIs below $25k, 4.7% for AGIs $25k-50k, 17.8% for AGIs $50k-75k, 54.0% for AGIs $75k-100k, 45.0% for AGIs $100k-200k)
Ordinary dividends: $700 (reported on 7.5% of returns)
Here:
$700
State:
$8,105
(% of AGI for various income ranges: 11.1% for AGIs $25k-50k, 42.0% for AGIs $75k-100k)
Net capital gain/loss in AGI: +$1,983 (reported on 7.5% of returns)
Here:
+$1,983
State:
+$33,664
(% of AGI for various income ranges: 8.4% for AGIs below $25k, 196.0% for AGIs $75k-100k)
Profit/loss from business: +$3,190 (reported on 12.5% of returns)
Here:
+$3,190
State:
+$18,991
(% of AGI for various income ranges: 40.8% for AGIs below $25k, 15.8% for AGIs $25k-50k, 374.0% for AGIs $75k-100k)
Taxable individual retirement arrangement distribution: $8,850 (reported on 5.0% of returns)
37810:
$8,850
Tennessee:
$20,036
(% of AGI for various income ranges: 186.3% for AGIs $25k-50k)
Earned income credit: $2,363 (reported on 23.8% of returns)
Here:
$2,363
State:
$2,391
(% of AGI for various income ranges: 117.6% for AGIs below $25k, 81.6% for AGIs $25k-50k)
Percentage of individuals using paid preparers for their 2020 taxes: 95.0%
Here:
95%
State:
93%
(% for various income ranges: 93.9% for AGIs below $25k, 95.5% for AGIs $25k-50k, 100.0% for AGIs $50k-75k, 85.7% for AGIs $75k-100k, 100.0% for AGIs $100k-200k)
Averages for the 2012 tax year for zip code 37810, filed in 2013:
Average Adjusted Gross Income (AGI) in 2012: $37,971 (Individual Income Tax Returns)
Here:
$37,971
State:
$53,767
Salary/wage: $36,683 (reported on 86.3% of returns)
Here:
$36,683
State:
$45,421
(% of AGI for various income ranges: 77.5% for AGIs below $25k, 88.5% for AGIs $25k-50k, 84.7% for AGIs $50k-75k, 80.5% for AGIs $75k-100k, 81.9% for AGIs $100k-200k)
Taxable interest for individuals: $465 (reported on 27.4% of returns)
This zip code:
$465
Tennessee:
$1,732
(% of AGI for various income ranges: 0.8% for AGIs below $25k, 0.3% for AGIs $25k-50k, 0.2% for AGIs $50k-75k, 0.4% for AGIs $75k-100k, 0.2% for AGIs $100k-200k)
Ordinary dividends: $500 (reported on 6.8% of returns)
Here:
$500
State:
$6,739
Net capital gain/loss in AGI: +$150 (reported on 5.5% of returns)
Here:
+$150
State:
+$19,082
Profit/loss from business: +$5,090 (reported on 13.7% of returns)
Here:
+$5,090
State:
+$15,240
Taxable individual retirement arrangement distribution: $6,725 (reported on 5.5% of returns)
37810:
$6,725
Tennessee:
$15,505
Total itemized deductions: $19,975 (25% of AGI, reported on 11.0% of returns)
Here:
$19,975
State:
$21,976
Here:
25.2% of AGI
State:
17.8% of AGI
(% of AGI for various income ranges: 6.2% for AGIs $25k-50k, 6.2% for AGIs $50k-75k, 15.7% for AGIs $75k-100k)
Charity contributions: $5,017 (reported on 8.2% of returns)
Here:
$5,017
State:
$6,709
Taxes paid: $2,725 (reported on 11.0% of returns)
37810:
$2,725
State:
$4,829
(% of AGI for various income ranges: 0.8% for AGIs $25k-50k, 0.7% for AGIs $50k-75k, 2.3% for AGIs $75k-100k)
Earned income credit: $2,395 (reported on 27.4% of returns)
Here:
$2,395
State:
$2,404
(% of AGI for various income ranges: 8.8% for AGIs below $25k, 1.5% for AGIs $25k-50k)
Percentage of individuals using paid preparers for their 2012 taxes: 64.4%
Here:
64%
State:
52%
(% for various income ranges: 60.6% for AGIs below $25k, 66.7% for AGIs $25k-50k, 70.0% for AGIs $50k-75k, 66.7% for AGIs $75k-100k, 66.7% for AGIs $100k-200k)
Averages for the 2004 tax year for zip code 37810, filed in 2005:
Average Adjusted Gross Income (AGI) in 2004: $29,080 (Individual Income Tax Returns)
Here:
$29,080
State:
$44,088
Salary/wage: $30,081 (reported on 88.5% of returns)
Here:
$30,081
State:
$38,825
(% of AGI for various income ranges: 134.0% for AGIs below $10k, 87.9% for AGIs $10k-25k, 89.4% for AGIs $25k-50k, 92.4% for AGIs $50k-75k, 93.7% for AGIs $75k-100k)
Taxable interest for individuals: $792 (reported on 27.3% of returns)
This zip code:
$792
Tennessee:
$1,802
(% of AGI for various income ranges: 8.1% for AGIs below $10k, 0.9% for AGIs $10k-25k, 0.7% for AGIs $25k-50k, 0.1% for AGIs $50k-75k, 0.7% for AGIs $75k-100k)
Taxable dividends: $307 (reported on 10.1% of returns)
Here:
$307
State:
$3,727
(% of AGI for various income ranges: 1.1% for AGIs below $10k, 0.1% for AGIs $10k-25k, 0.1% for AGIs $25k-50k, 0.1% for AGIs $50k-75k, 0.1% for AGIs $75k-100k)
Net capital gain/loss: +$148 (reported on 8.2% of returns)
Here:
+$148
State:
+$15,776
Profit/loss from business: +$2,122 (reported on 11.1% of returns)
Here:
+$2,122
State:
+$12,882
(% of AGI for various income ranges: -12.4% for AGIs below $10k, 2.9% for AGIs $10k-25k, 0.6% for AGIs $25k-50k, 1.2% for AGIs $50k-75k)
Total itemized deductions: $15,337 (29% of AGI, reported on 11.6% of returns)
Here:
$15,337
State:
$18,035
Here:
29.3% of AGI
State:
19.9% of AGI
(% of AGI for various income ranges: 5.4% for AGIs $10k-25k, 6.0% for AGIs $25k-50k, 5.6% for AGIs $50k-75k, 9.0% for AGIs $75k-100k)
Charity contributions deductions: $2,862 (5% of AGI, reported on 8.8% of returns)
Here:
$2,862
State:
$5,167
Here:
5.0% of AGI
State:
5.3% of AGI
Total tax: $2,899 (reported on 70.6% of returns)
37810:
$2,899
State:
$7,482
(% of AGI for various income ranges: 3.2% for AGIs below $10k, 3.8% for AGIs $10k-25k, 6.1% for AGIs $25k-50k, 8.2% for AGIs $50k-75k, 11.7% for AGIs $75k-100k)
Earned income credit: $1,781 (reported on 24.7% of returns)
Here:
$1,781
State:
$1,826
Percentage of individuals using paid preparers for their 2004 taxes: 70.7%
Here:
71%
State:
60%
(% for various income ranges: 61.0% for AGIs below $10k, 71.8% for AGIs $10k-25k, 71.6% for AGIs $25k-50k, 79.8% for AGIs $50k-75k, 75.7% for AGIs $75k-100k)
Household received Food Stamps/SNAP in the past 12 months: 76 Household did not receive Food Stamps/SNAP in the past 12 months: 660
Women who did not have a birth in the past 12 months: 446 (243 now married, 203 unmarried)
Housing units in zip code 37810 with a mortgage: 214 (21 second mortgage, 21 both second mortgage and home equity loan) Median monthly owner costs for units with a mortgage: $1,200 Median monthly owner costs for units without a mortgage: $338
Residents with income below the poverty level in 2022:
This zip code:
32.8%
Whole state:
13.3%
Residents with income below 50% of the poverty level in 2022:
This zip code:
17.4%
Whole state:
7.1%
Median number of rooms in houses and condos:
Here:
6.3
State:
6.5
Median number of rooms in apartments:
Here:
6.4
State:
4.4
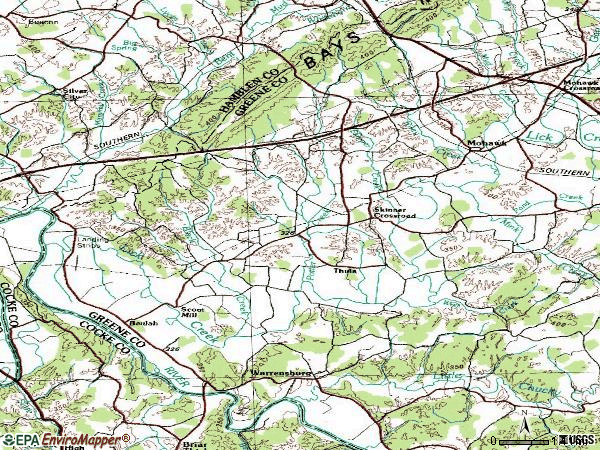
Notable locations in this zip code not listed on our city pages
Churches in zip code 37810 include: Fairview Church (A), Warrensburg Baptist Church (B), Beulah Church (C), Wesley Churh (D), Concord Church (E), Mountain Valley Church (F), Mount Hope Church (G). Display/hide their locations on the map
Cemeteries: Kesterson Cemetery (1), Wisecarver Cemetery (2), Wright Cemetery (3), Lyle Cemetery (4), McCorkel Cemetery (5), Courtney Cemetery (6), Drake Cemetery (7). Display/hide their locations on the map
Streams, rivers, and creeks: Gray Branch (A), Lick Creek (B), Skipper Creek (C), Black Creek (D), Cooper Branch (E), Wolf Creek (F), Mud Creek (G), Red Run (H), Potter Creek (I). Display/hide their locations on the map
Size of family households: 235 2-persons, 142 3-persons, 34 4-persons, 128 5-persons, 23 6-persons, 8 7-or-more-persons
Size of nonfamily households: 102 1-person, 66 2-persons
314 married couples with children.
92 single-parent households (92 women).
99.3% of residents of 37810 zip code speak English at home.
0.4% of residents speak Spanish at home (100% very well).
Foreign born population: 0 (0.0%)
:
0.0%
Whole state:
5.6%
17%Irish
17%English
11%American
6%German
2%European
1%Scottish
1%British
Facilities with environmental interests located in this zip code:
BUSH BROTHERS & COMPANY (RR2 in MOHAWK, TN)
(Resource Conservation and Recovery Act (tracking hazardous waste)) Business NAICS classification: FRUIT AND VEGETABLE CANNING.
Housing units lacking complete plumbing facilities: 11.2% Housing units lacking complete kitchen facilities: 10.8%
81.8%Electricity
9.6%Wood
7.7%Bottled, tank, or LP gas
1.1%No fuel used
Population in 1990: 1,765. Population change in the 1990s: +41 (+2.3%).
Place of birth for U.S.-born residents:
This state: 1,505
Northeast: 56
Midwest: 115
South: 296
West: 102
53% of the 37810 zip code residents lived in the same house 5 years ago. Out of people who lived in different houses, 46% lived in this county. Out of people who lived in different counties, 50% lived in Tennessee.
97% of the 37810 zip code residents lived in the same house 1 year ago. Out of people who lived in different houses, 29% moved from this county. Out of people who lived in different houses, 87% moved from different county within same state.
Private vs. public school enrollment:
Students in private schools in grades 1 to 8 (elementary and middle school): 4
Here:
1.5%
Tennessee:
15.0%
Students in private schools in grades 9 to 12 (high school): 22
Here:
10.4%
Tennessee:
16.2%
Students in private undergraduate colleges:
Here:
0.0%
Tennessee:
23.5%
Occupation by median earnings in the past 12 months ($)
111,081Health diagnosing and treating practitioners and other technical occupations
69,373Education, training, and library occupations
57,882Management occupations
43,359Construction and extraction occupations
37,416Production occupations
37,411Office and administrative support occupations
Top industries in this zip code by the number of employees in 2005:
Accommodation and Food Services: Limited-Service Restaurants (20-49 employees: 1 establishment)
Construction: Site Preparation Contractors (10-19: 1)
Administrative and Support and Waste Management and Remediation Services: Exterminating and Pest Control Services (5-9: 1)
Construction: Other Building Equipment Contractors (5-9: 1)
Construction: Plumbing, Heating, and Air-Conditioning Contractors (5-9: 1)
Other Services (except Public Administration): Religious Organizations (1-4: 3)
Fatal accident statistics in 2013:
Fatal accident count: 2
Vehicles involved in fatal accidents: 3
Fatal accidents caused by drunken drivers: 1
Fatalities: 2
Persons involved in fatal accidents: 4
Pedestrians involved in fatal accidents: 0
Fatal accident statistics in 2011:
Fatal accident count: 1
Vehicles involved in fatal accidents: 2
Fatal accidents caused by drunken drivers: 0
Fatalities: 1
Persons involved in fatal accidents: 4
Pedestrians involved in fatal accidents: 0
2003 - 2018 National Fire Incident Reporting System (NFIRS) incidents
Based on the data from the years 2003 - 2018 the average number of fire incidents per year is 9. The highest number of fire incidents - 25 took place in 2018, and the least - 1 in 2003. The data has a growing trend.
When looking into fire subcategories, the most incidents belonged to: Structure Fires (56.7%), and Outside Fires (32.7%).
Fire incident types reported to NFIRS in Zip Code 37810


 Nearest zip codes: 37809, 37860, 37713, 37891, 37711, 37813.


 Based on the data from the years 2003 - 2018 the average number of fire incidents per year is 9. The highest number of fire incidents - 25 took place in 2018, and the least - 1 in 2003. The data has a growing trend.
 When looking into fire subcategories, the most incidents belonged to: Structure Fires (56.7%), and Outside Fires (32.7%).