Estimated zip code population in 2022: 4,966 Zip code population in 2010: 5,031 Zip code population in 2000: 4,877
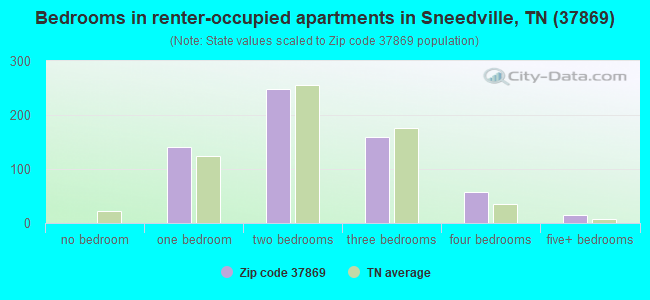
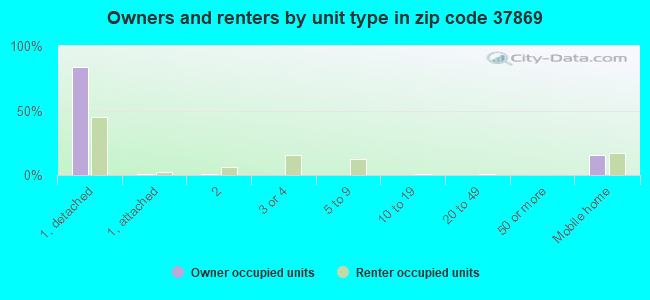
Houses and condos: 2,593 Renter-occupied apartments: 620
% of renters here:
29%
State:
33%
March 2022 cost of living index in zip code 37869: 79.7 (low, U.S. average is 100)
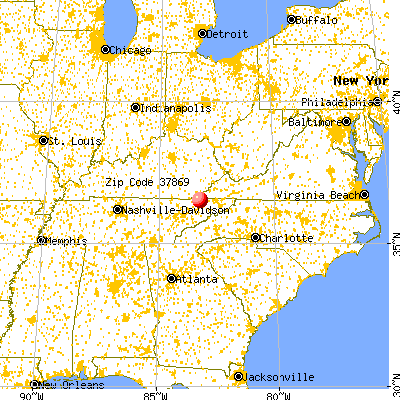
Land area: 135.1 sq. mi. Water area: 0.3 sq. mi.
Population density: 37 people per square mile
(very low).
OSM Map
General Map
Google Map
MSN Map
OSM Map
General Map
Google Map
MSN Map
OSM Map
General Map
Google Map
MSN Map
OSM Map
General Map
Google Map
MSN Map
Please wait while loading the map...
Real estate property taxes paid for housing units in 2022:
This zip code:
0.4% ($538)
Tennessee:
0.5% ($1,376)
Median real estate property taxes paid for housing units with mortgages in 2022: $824 (0.5%) Median real estate property taxes paid for housing units with no mortgage in 2022: $438 (0.3%)
Business Search- 14 Million verified businesses
Males: 2,408
(48.5%)
Females: 2,557
(51.5%)
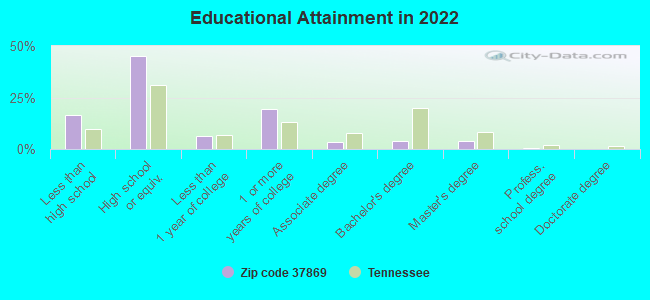
For population 25 years and over in 37869:
High school or higher: 81.4%
Bachelor's degree or higher: 8.6%
Graduate or professional degree: 4.8%
Unemployed: 6.4%
Mean travel time to work (commute): 31.6 minutes
For population 15 years and over in 37869:
Never married: 22.1%
Now married: 48.8%
Separated: 4.2%
Widowed: 10.7%
Divorced: 14.2%
Zip code 37869 compared to state average:
Median household income below state average.
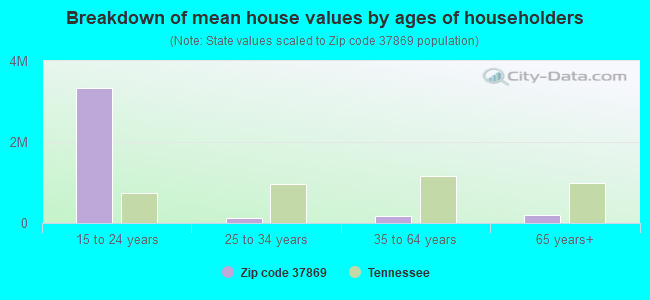
Median house value below state average.
Unemployed percentage above state average.
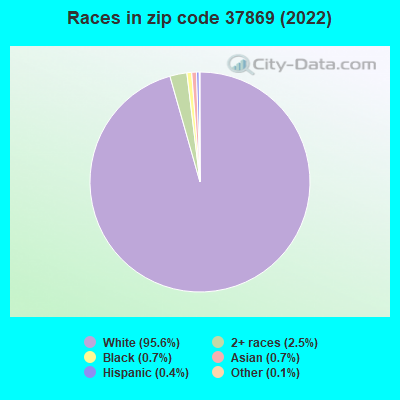
Black race population percentage significantly below state average.
Hispanic race population percentage significantly below state average.
Foreign-born population percentage significantly below state average.
Length of stay since moving in significantly above state average.
Percentage of population with a bachelor's degree or higher significantly below state average.
Estimated median house/condo value in 2022: $148,965
37869:
$148,965
Tennessee:
$284,800
According to our research of Tennessee and other state lists, there were 17 registered sex offenders living in 37869 zip code as of May 28, 2024. The ratio of all residents to sex offenders in zip code 37869 is 286 to 1. The ratio of registered sex offenders to all residents in this zip code is near the state average.
Median resident age:
This zip code:
39.9 years
Tennessee median age:
39.2 years
Average household size:
This zip code:
2.3 people
Tennessee:
2.4 people
Averages for the 2020 tax year for zip code 37869, filed in 2021:
Average Adjusted Gross Income (AGI) in 2020: $38,681 (Individual Income Tax Returns)
Here:
$38,681
State:
$69,014
Salary/wage: $34,604 (reported on 80.4% of returns)
Here:
$34,604
State:
$55,872
(% of AGI for various income ranges: 1018.3% for AGIs below $25k, 3501.4% for AGIs $25k-50k, 6038.4% for AGIs $50k-75k, 9122.2% for AGIs $75k-100k, 12976.2% for AGIs $100k-200k)
Taxable interest for individuals: $781 (reported on 24.9% of returns)
This zip code:
$781
Tennessee:
$1,945
(% of AGI for various income ranges: 13.9% for AGIs below $25k, 16.6% for AGIs $25k-50k, 44.2% for AGIs $50k-75k, 25.6% for AGIs $75k-100k, 112.5% for AGIs $100k-200k)
Ordinary dividends: $1,600 (reported on 5.8% of returns)
Here:
$1,600
State:
$8,105
(% of AGI for various income ranges: 8.9% for AGIs below $25k, 7.0% for AGIs $25k-50k, 26.3% for AGIs $50k-75k, 41.2% for AGIs $100k-200k)
Net capital gain/loss in AGI: +$8,154 (reported on 6.9% of returns)
Here:
+$8,154
State:
+$33,664
(% of AGI for various income ranges: 12.4% for AGIs below $25k, 45.7% for AGIs $25k-50k, 170.0% for AGIs $75k-100k, 773.8% for AGIs $100k-200k)
Profit/loss from business: +$8,107 (reported on 15.9% of returns)
Here:
+$8,107
State:
+$18,991
(% of AGI for various income ranges: 141.7% for AGIs below $25k, 104.3% for AGIs $25k-50k, 96.3% for AGIs $50k-75k, 886.7% for AGIs $75k-100k)
Taxable individual retirement arrangement distribution: $14,667 (reported on 4.8% of returns)
37869:
$14,667
Tennessee:
$20,036
(% of AGI for various income ranges: 19.1% for AGIs below $25k, 76.4% for AGIs $25k-50k, 944.4% for AGIs $75k-100k)
Earned income credit: $2,468 (reported on 30.2% of returns)
Here:
$2,468
State:
$2,391
(% of AGI for various income ranges: 140.1% for AGIs below $25k, 96.8% for AGIs $25k-50k)
Percentage of individuals using paid preparers for their 2020 taxes: 93.7%
Here:
94%
State:
93%
(% for various income ranges: 93.2% for AGIs below $25k, 94.3% for AGIs $25k-50k, 95.7% for AGIs $50k-75k, 92.3% for AGIs $75k-100k, 91.7% for AGIs $100k-200k)
Averages for the 2012 tax year for zip code 37869, filed in 2013:
Average Adjusted Gross Income (AGI) in 2012: $31,640 (Individual Income Tax Returns)
Here:
$31,640
State:
$53,767
Salary/wage: $30,336 (reported on 77.5% of returns)
Here:
$30,336
State:
$45,421
(% of AGI for various income ranges: 68.5% for AGIs below $25k, 81.8% for AGIs $25k-50k, 85.0% for AGIs $50k-75k, 81.8% for AGIs $75k-100k, 43.4% for AGIs $100k-200k)
Taxable interest for individuals: $718 (reported on 23.1% of returns)
This zip code:
$718
Tennessee:
$1,732
(% of AGI for various income ranges: 0.9% for AGIs below $25k, 0.5% for AGIs $25k-50k, 0.6% for AGIs $50k-75k, 0.1% for AGIs $75k-100k, 0.3% for AGIs $100k-200k)
Ordinary dividends: $1,043 (reported on 4.1% of returns)
Here:
$1,043
State:
$6,739
Net capital gain/loss in AGI: +$640 (reported on 8.9% of returns)
Here:
+$640
State:
+$19,082
(% of AGI for various income ranges: 0.2% for AGIs below $25k, 0.1% for AGIs $25k-50k, 0.5% for AGIs $50k-75k)
Profit/loss from business: +$7,238 (reported on 23.1% of returns)
Here:
+$7,238
State:
+$15,240
(% of AGI for various income ranges: 17.1% for AGIs below $25k, 2.4% for AGIs $25k-50k, 2.6% for AGIs $50k-75k, 2.6% for AGIs $75k-100k)
Taxable individual retirement arrangement distribution: $10,457 (reported on 4.1% of returns)
37869:
$10,457
Tennessee:
$15,505
(% of AGI for various income ranges: 1.7% for AGIs below $25k, 1.2% for AGIs $25k-50k, 3.1% for AGIs $50k-75k)
Total itemized deductions: $16,177 (25% of AGI, reported on 7.7% of returns)
Here:
$16,177
State:
$21,976
Here:
24.7% of AGI
State:
17.8% of AGI
(% of AGI for various income ranges: 4.0% for AGIs $25k-50k, 5.0% for AGIs $50k-75k, 4.7% for AGIs $75k-100k, 7.4% for AGIs $100k-200k)
Charity contributions: $3,943 (reported on 4.1% of returns)
Here:
$3,943
State:
$6,709
(% of AGI for various income ranges: 0.7% for AGIs below $25k, 0.6% for AGIs $50k-75k, 1.7% for AGIs $75k-100k)
Taxes paid: $2,817 (reported on 7.1% of returns)
37869:
$2,817
State:
$4,829
(% of AGI for various income ranges: 0.5% for AGIs $25k-50k, 0.7% for AGIs $50k-75k, 0.7% for AGIs $75k-100k, 1.7% for AGIs $100k-200k)
Earned income credit: $2,434 (reported on 38.5% of returns)
Here:
$2,434
State:
$2,404
(% of AGI for various income ranges: 11.6% for AGIs below $25k, 1.7% for AGIs $25k-50k)
Percentage of individuals using paid preparers for their 2012 taxes: 73.4%
Here:
73%
State:
52%
(% for various income ranges: 76.3% for AGIs below $25k, 72.1% for AGIs $25k-50k, 68.4% for AGIs $50k-75k, 60.0% for AGIs $75k-100k, 75.0% for AGIs $100k-200k)
Averages for the 2004 tax year for zip code 37869, filed in 2005:
Average Adjusted Gross Income (AGI) in 2004: $24,672 (Individual Income Tax Returns)
Here:
$24,672
State:
$44,088
Salary/wage: $24,658 (reported on 83.4% of returns)
Here:
$24,658
State:
$38,825
(% of AGI for various income ranges: 87.6% for AGIs below $10k, 78.8% for AGIs $10k-25k, 88.7% for AGIs $25k-50k, 91.0% for AGIs $50k-75k, 87.4% for AGIs $75k-100k, 40.1% for AGIs over 100k)
Taxable interest for individuals: $907 (reported on 30.8% of returns)
This zip code:
$907
Tennessee:
$1,802
(% of AGI for various income ranges: 4.0% for AGIs below $10k, 1.3% for AGIs $10k-25k, 1.0% for AGIs $25k-50k, 0.9% for AGIs $50k-75k, 0.6% for AGIs $75k-100k, 0.6% for AGIs over 100k)
Taxable dividends: $517 (reported on 6.8% of returns)
Here:
$517
State:
$3,727
(% of AGI for various income ranges: 0.5% for AGIs below $10k, 0.2% for AGIs $10k-25k, 0.1% for AGIs $25k-50k, 0.1% for AGIs $50k-75k)
Net capital gain/loss: +$5,030 (reported on 5.7% of returns)
Here:
+$5,030
State:
+$15,776
(% of AGI for various income ranges: -0.3% for AGIs below $10k, -0.1% for AGIs $10k-25k, 0.4% for AGIs $25k-50k, -0.1% for AGIs $50k-75k, 12.7% for AGIs $75k-100k)
Profit/loss from business: +$4,650 (reported on 20.3% of returns)
Here:
+$4,650
State:
+$12,882
(% of AGI for various income ranges: 16.3% for AGIs below $10k, 9.2% for AGIs $10k-25k, 2.2% for AGIs $25k-50k, -0.2% for AGIs $50k-75k, 1.9% for AGIs $75k-100k)
IRA payment deduction: $1,846 (reported on 1.5% of returns)
37869:
$1,846
Tennessee:
$2,934
Total itemized deductions: $14,984 (28% of AGI, reported on 7.0% of returns)
Here:
$14,984
State:
$18,035
Here:
27.7% of AGI
State:
19.9% of AGI
(% of AGI for various income ranges: 3.3% for AGIs $10k-25k, 3.3% for AGIs $25k-50k, 6.1% for AGIs $50k-75k, 12.0% for AGIs $75k-100k)
Charity contributions deductions: $3,573 (7% of AGI, reported on 5.1% of returns)
Here:
$3,573
State:
$5,167
Here:
6.8% of AGI
State:
5.3% of AGI
(% of AGI for various income ranges: 0.5% for AGIs $10k-25k, 0.4% for AGIs $25k-50k, 1.4% for AGIs $50k-75k, 2.0% for AGIs $75k-100k)
Total tax: $2,514 (reported on 67.5% of returns)
37869:
$2,514
State:
$7,482
(% of AGI for various income ranges: 4.9% for AGIs below $10k, 3.9% for AGIs $10k-25k, 5.6% for AGIs $25k-50k, 8.2% for AGIs $50k-75k, 10.2% for AGIs $75k-100k, 16.1% for AGIs over 100k)
Earned income credit: $1,866 (reported on 34.1% of returns)
Here:
$1,866
State:
$1,826
Percentage of individuals using paid preparers for their 2004 taxes: 82.7%
Here:
83%
State:
60%
(% for various income ranges: 80.8% for AGIs below $10k, 85.7% for AGIs $10k-25k, 84.0% for AGIs $25k-50k, 77.8% for AGIs $50k-75k, 68.2% for AGIs $75k-100k, 81.0% for AGIs over 100k)
Household received Food Stamps/SNAP in the past 12 months: 590 Household did not receive Food Stamps/SNAP in the past 12 months: 1,498
Women who had a birth in the past 12 months: 29 (7 now married, 21 unmarried) Women who did not have a birth in the past 12 months: 1,089 (642 now married, 447 unmarried)
Housing units in zip code 37869 with a mortgage: 430 (44 second mortgage, 41 both second mortgage and home equity loan) Houses without a mortgage: 6
Median monthly owner costs for units with a mortgage: $1,067 Median monthly owner costs for units without a mortgage: $279
Residents with income below the poverty level in 2022:
This zip code:
30.2%
Whole state:
13.3%
Residents with income below 50% of the poverty level in 2022:
This zip code:
15.2%
Whole state:
7.1%
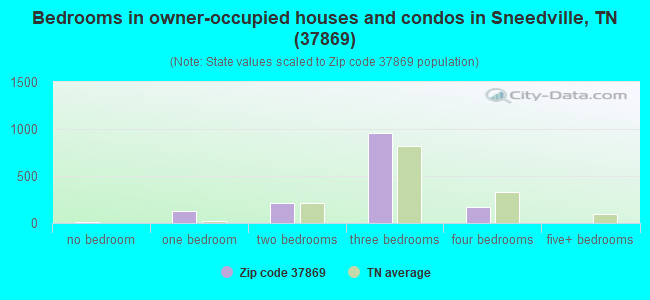
Median number of rooms in houses and condos:
Here:
5.5
State:
6.5
Median number of rooms in apartments:
Here:
4.2
State:
4.4
Notable locations in this zip code not listed on our city pages
Notable locations in zip code 37869: Mulberry Gap (A), Manning Ferry (B), Sneedville Volunteer Fire Department (C), Clinch Valley Volunteer Fire Department Station 2 (D), Hancock County Courthouse (E), Mathis Mill (F), Vardy / Blackwater Volunteer Fire Department (G), Chestnut Ridge Volunteer Fire Department (H), Seal Mathis Community Center (I), Camps Volunteer Fire Department (J), Hancock County Rescue (K), Pressmens Home Power Plant (L), Hancock County Ambulance Service (M). Display/hide their locations on the map
Churches in zip code 37869 include: Gap Church (A), Shiloh Church (B), Thomas Chapel (C), Swan Creek Chapel (D), Union Hill Church (E), Yellow Springs Church (F), Sandy Springs Church (G), Yellow Branch Church (H), Ida Chapel (I). Display/hide their locations on the map
Cemeteries: Seal Cemetery (1), Trent Cemetery (2), Johnson Cemetery (3), Jones Cemetery (4), Kinsler Cemetery (5), Williams Cemetery (6), Winkler Cemetery (7). Display/hide their locations on the map
Streams, rivers, and creeks: Greasy Rock Creek (A), Flea Creek (B), Farmers Branch (C), Fall Branch (D), Duck Creek (E), Yellow Branch (F), Brier Creek (G), Panther Creek (H), Painter Branch (I). Display/hide their locations on the map
593 married couples with children.
192 single-parent households (89 men, 103 women).
97.5% of residents of 37869 zip code speak English at home.
0.9% of residents speak Spanish at home (84% very well, 9% well, 7% not well).
0.7% of residents speak other Indo-European language at home (100% very well).
0.7% of residents speak Asian or Pacific Island language at home (74% very well, 26% not well).
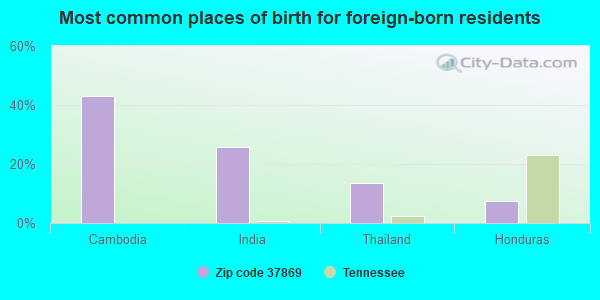
Foreign born population: 81 (1.6%) (45.8% of them are naturalized citizens)
This zip code:
1.6%
Whole state:
5.6%
43%Cambodia
26%India
14%Thailand
7%Honduras
32%English
24%American
7%Irish
3%German
2%Italian
2%European
1%Welsh
Year of entry for the foreign-born population
622010 or later
02000 to 2009
411990 to 1999
22Before 1990
Facilities with environmental interests located in this zip code:
BUTTRY STONE CO (RT 1 in SNEEDVILLE, TN)
AIR MINOR (AIRS/AFS) Business SIC classification: CRUSHED AND BROKEN LIMESTONE
Housing units lacking complete plumbing facilities: 5.9% Housing units lacking complete kitchen facilities: 7.2%
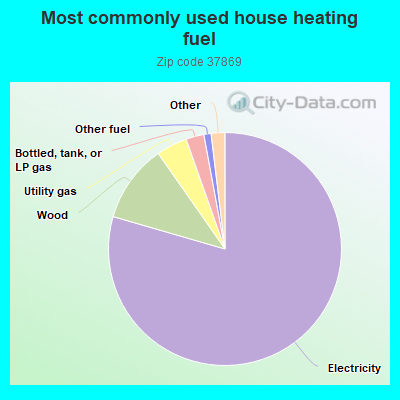
79.5%Electricity
10.8%Wood
4.3%Utility gas
2.5%Bottled, tank, or LP gas
1.0%Other fuel
0.9%Fuel oil, kerosene, etc.
0.8%Coal or coke
Population in 1990: 5,203.
Place of birth for U.S.-born residents:
This state: 3,312
Northeast: 307
Midwest: 202
South: 954
West: 40
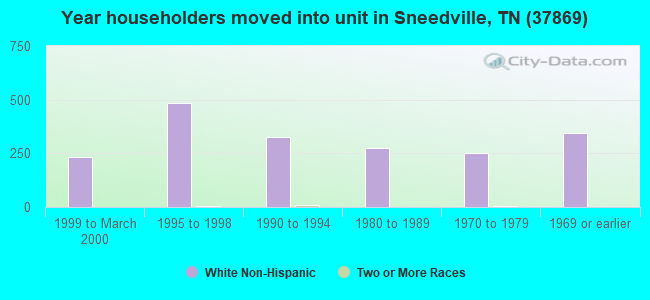
66% of the 37869 zip code residents lived in the same house 5 years ago. Out of people who lived in different houses, 63% lived in this county. Out of people who lived in different counties, 50% lived in Tennessee.
93% of the 37869 zip code residents lived in the same house 1 year ago. Out of people who lived in different houses, 48% moved from this county. Out of people who lived in different houses, 25% moved from different county within same state. Out of people who lived in different houses, 29% moved from different state.
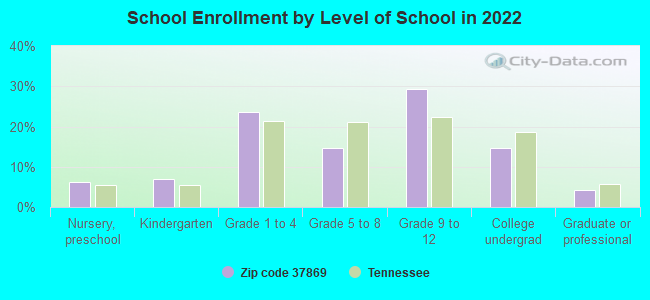
Private vs. public school enrollment:
Students in private schools in grades 1 to 8 (elementary and middle school): 28
Here:
7.1%
Tennessee:
15.0%
Students in private schools in grades 9 to 12 (high school): 4
Here:
1.5%
Tennessee:
16.2%
Students in private undergraduate colleges: 21
Here:
13.5%
Tennessee:
23.5%
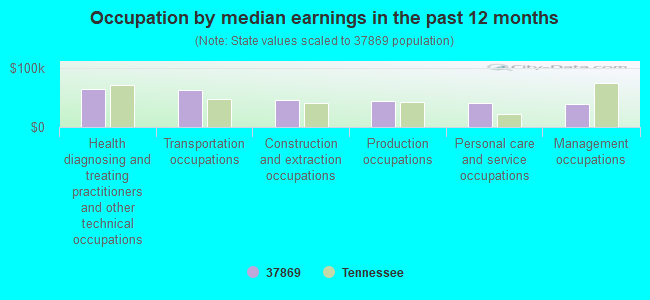
Occupation by median earnings in the past 12 months ($)
64,037Health diagnosing and treating practitioners and other technical occupations
63,783Transportation occupations
46,469Construction and extraction occupations
45,033Production occupations
40,504Personal care and service occupations
40,070Management occupations
Top industries in this zip code by the number of employees in 2005:
Health Care and Social Assistance: Nursing Care Facilities (50-99 employees: 1 establishment)
Accommodation and Food Services: Limited-Service Restaurants (20-49: 1, 10-19: 1)
Finance and Insurance: Commercial Banking (10-19: 1, 5-9: 1)
Health Care and Social Assistance: All Other Outpatient Care Centers (10-19: 1, 1-4: 1)
People in group quarters in 2010:
101 people in local jails and other municipal confinement facilities
40 people in nursing facilities/skilled-nursing facilities
8 people in group homes intended for adults
People in group quarters in 2000:
116 people in local jails and other confinement facilities (including police lockups)
46 people in nursing homes
Fatal accident statistics in 2014:
Fatal accident count: 2
Vehicles involved in fatal accidents: 2
Fatal accidents caused by drunken drivers: 0
Fatalities: 2
Persons involved in fatal accidents: 4
Pedestrians involved in fatal accidents: 0
Fatal accident statistics in 2013:
Fatal accident count: 1
Vehicles involved in fatal accidents: 1
Fatal accidents caused by drunken drivers: 0
Fatalities: 1
Persons involved in fatal accidents: 1
Pedestrians involved in fatal accidents: 0
2004 - 2018 National Fire Incident Reporting System (NFIRS) incidents
Based on the data from the years 2004 - 2018 the average number of fires per year is 22. The highest number of reported fires - 39 took place in 2014, and the least - 8 in 2004. The data has an increasing trend.
When looking into fire subcategories, the most reports belonged to: Structure Fires (43.8%), and Outside Fires (42.9%).
Fire incident types reported to NFIRS in Zip Code 37869


 Nearest zip codes: 37881, 24281, 37811, 24263, 37765, 37708.


 Based on the data from the years 2004 - 2018 the average number of fires per year is 22. The highest number of reported fires - 39 took place in 2014, and the least - 8 in 2004. The data has an increasing trend.
 When looking into fire subcategories, the most reports belonged to: Structure Fires (43.8%), and Outside Fires (42.9%).