Estimated zip code population in 2022: 4,937 Zip code population in 2010: 5,193 Zip code population in 2000: 5,347
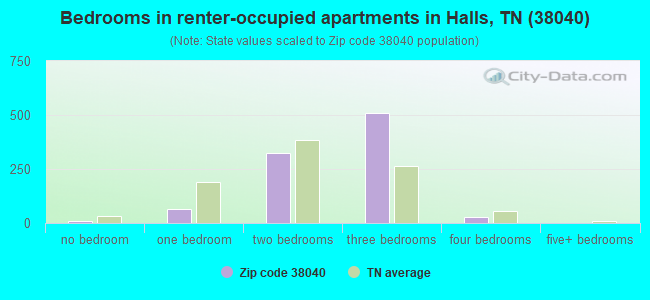
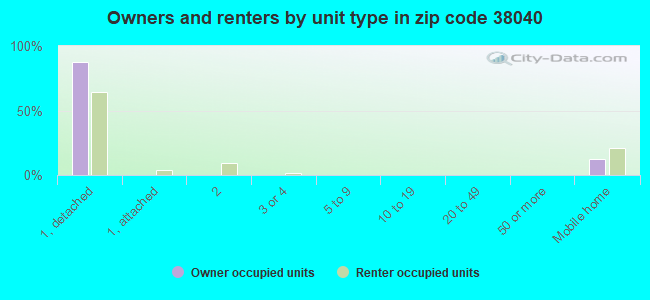
Houses and condos: 2,462 Renter-occupied apartments: 949
% of renters here:
43%
State:
33%
March 2022 cost of living index in zip code 38040: 78.2 (low, U.S. average is 100)
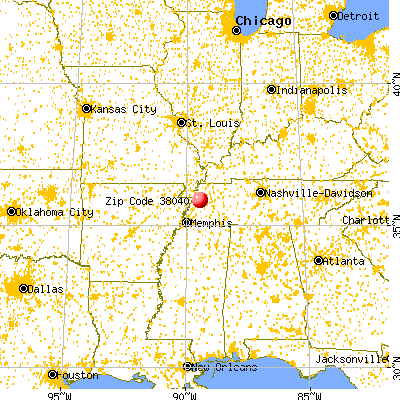
Land area: 108.9 sq. mi. Water area: 0.2 sq. mi.
Population density: 45 people per square mile
(very low).
OSM Map
General Map
Google Map
MSN Map
OSM Map
General Map
Google Map
MSN Map
OSM Map
General Map
Google Map
MSN Map
OSM Map
General Map
Google Map
MSN Map
Please wait while loading the map...
Real estate property taxes paid for housing units in 2022:
This zip code:
0.6% ($716)
Tennessee:
0.5% ($1,376)
Median real estate property taxes paid for housing units with mortgages in 2022: $672 (0.6%) Median real estate property taxes paid for housing units with no mortgage in 2022: $813 (0.6%)
Business Search- 14 Million verified businesses
Males: 2,461
(49.9%)
Females: 2,475
(50.1%)
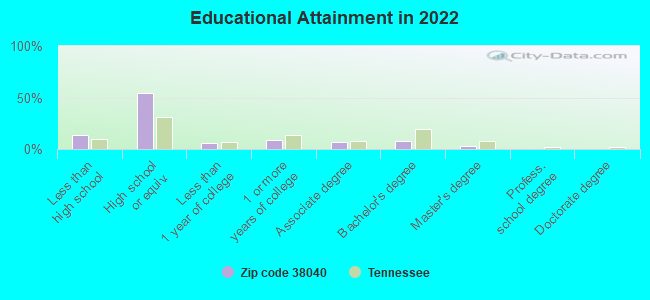
For population 25 years and over in 38040:
High school or higher: 84.8%
Bachelor's degree or higher: 10.6%
Graduate or professional degree: 2.7%
Unemployed: 1.6%
Mean travel time to work (commute): 25.0 minutes
For population 15 years and over in 38040:
Never married: 19.9%
Now married: 54.8%
Separated: 2.5%
Widowed: 8.2%
Divorced: 14.6%
Zip code 38040 compared to state average:
Median house value significantly below state average.
Unemployed percentage below state average.
Foreign-born population percentage significantly below state average.
Length of stay since moving in significantly above state average.
Percentage of population with a bachelor's degree or higher significantly below state average.
Averages for the 2020 tax year for zip code 38040, filed in 2021:
Average Adjusted Gross Income (AGI) in 2020: $55,531 (Individual Income Tax Returns)
Here:
$55,531
State:
$69,014
Salary/wage: $43,763 (reported on 82.8% of returns)
Here:
$43,763
State:
$55,872
(% of AGI for various income ranges: 1060.5% for AGIs below $25k, 3648.7% for AGIs $25k-50k, 6335.4% for AGIs $50k-75k, 9443.6% for AGIs $75k-100k, 13316.0% for AGIs $100k-200k)
Taxable interest for individuals: $1,402 (reported on 22.5% of returns)
This zip code:
$1,402
Tennessee:
$1,945
(% of AGI for various income ranges: 14.3% for AGIs below $25k, 6.7% for AGIs $25k-50k, 18.3% for AGIs $50k-75k, 17.9% for AGIs $75k-100k, 126.7% for AGIs $100k-200k)
Ordinary dividends: $2,716 (reported on 9.1% of returns)
Here:
$2,716
State:
$8,105
(% of AGI for various income ranges: 14.3% for AGIs below $25k, 17.0% for AGIs $25k-50k, 9.6% for AGIs $50k-75k, 109.3% for AGIs $100k-200k)
Net capital gain/loss in AGI: +$9,017 (reported on 8.6% of returns)
Here:
+$9,017
State:
+$33,664
(% of AGI for various income ranges: 21.7% for AGIs $25k-50k, 62.1% for AGIs $50k-75k, 346.7% for AGIs $100k-200k)
Profit/loss from business: +$10,372 (reported on 13.9% of returns)
Here:
+$10,372
State:
+$18,991
(% of AGI for various income ranges: 151.6% for AGIs below $25k, 51.3% for AGIs $25k-50k, 70.0% for AGIs $50k-75k, 1119.3% for AGIs $100k-200k)
Taxable individual retirement arrangement distribution: $16,773 (reported on 7.2% of returns)
38040:
$16,773
Tennessee:
$20,036
(% of AGI for various income ranges: 52.6% for AGIs below $25k, 72.4% for AGIs $25k-50k, 383.8% for AGIs $50k-75k, 627.3% for AGIs $100k-200k)
Total itemized deductions: $46,575 (reported on 1.9% of returns)
Here:
$46,575
State:
$40,136
(% of AGI for various income ranges: 149.3% for AGIs $25k-50k, 784.0% for AGIs $100k-200k)
Charity contributions: $33,067 (reported on 1.4% of returns)
Here:
$33,067
State:
$19,852
(% of AGI for various income ranges: 708.6% for AGIs $75k-100k)
Taxes paid: $5,525 (reported on 1.9% of returns)
38040:
$5,525
State:
$6,038
(% of AGI for various income ranges: 147.3% for AGIs $100k-200k)
Earned income credit: $2,414 (reported on 23.4% of returns)
Here:
$2,414
State:
$2,391
(% of AGI for various income ranges: 139.7% for AGIs below $25k, 72.0% for AGIs $25k-50k)
Percentage of individuals using paid preparers for their 2020 taxes: 96.2%
Here:
96%
State:
93%
(% for various income ranges: 96.2% for AGIs below $25k, 96.4% for AGIs $25k-50k, 96.8% for AGIs $50k-75k, 94.7% for AGIs $75k-100k, 95.5% for AGIs $100k-200k, 100.0% for AGIs over 200k)
Averages for the 2012 tax year for zip code 38040, filed in 2013:
Average Adjusted Gross Income (AGI) in 2012: $44,107 (Individual Income Tax Returns)
Here:
$44,107
State:
$53,767
Salary/wage: $36,181 (reported on 84.1% of returns)
Here:
$36,181
State:
$45,421
(% of AGI for various income ranges: 76.9% for AGIs below $25k, 84.3% for AGIs $25k-50k, 81.9% for AGIs $50k-75k, 76.9% for AGIs $75k-100k, 71.2% for AGIs $100k-200k, 21.9% for AGIs over 200k)
Taxable interest for individuals: $1,243 (reported on 25.5% of returns)
This zip code:
$1,243
Tennessee:
$1,732
(% of AGI for various income ranges: 0.9% for AGIs below $25k, 0.3% for AGIs $25k-50k, 0.3% for AGIs $50k-75k, 0.8% for AGIs $75k-100k, 0.9% for AGIs $100k-200k, 1.3% for AGIs over 200k)
Ordinary dividends: $4,022 (reported on 8.7% of returns)
Here:
$4,022
State:
$6,739
(% of AGI for various income ranges: 0.5% for AGIs below $25k, 0.3% for AGIs $25k-50k, 0.3% for AGIs $50k-75k, 0.7% for AGIs $75k-100k, 3.3% for AGIs $100k-200k)
Net capital gain/loss in AGI: +$4,593 (reported on 6.7% of returns)
Here:
+$4,593
State:
+$19,082
(% of AGI for various income ranges: 0.5% for AGIs $25k-50k, 0.3% for AGIs $50k-75k, 3.4% for AGIs $100k-200k)
Profit/loss from business: +$5,200 (reported on 16.8% of returns)
Here:
+$5,200
State:
+$15,240
(% of AGI for various income ranges: 9.1% for AGIs below $25k, 1.5% for AGIs $25k-50k, 1.2% for AGIs $50k-75k, 0.9% for AGIs $75k-100k, 0.8% for AGIs $100k-200k)
Taxable individual retirement arrangement distribution: $12,388 (reported on 7.7% of returns)
38040:
$12,388
Tennessee:
$15,505
(% of AGI for various income ranges: 3.0% for AGIs below $25k, 2.6% for AGIs $25k-50k, 2.1% for AGIs $50k-75k, 6.1% for AGIs $75k-100k)
Total itemized deductions: $18,408 (19% of AGI, reported on 12.5% of returns)
Here:
$18,408
State:
$21,976
Here:
18.6% of AGI
State:
17.8% of AGI
(% of AGI for various income ranges: 3.4% for AGIs below $25k, 4.2% for AGIs $25k-50k, 6.0% for AGIs $50k-75k, 5.8% for AGIs $75k-100k, 12.4% for AGIs $100k-200k)
Charity contributions: $6,518 (reported on 10.6% of returns)
Here:
$6,518
State:
$6,709
(% of AGI for various income ranges: 1.0% for AGIs $25k-50k, 1.3% for AGIs $50k-75k, 2.3% for AGIs $75k-100k, 5.0% for AGIs $100k-200k)
Taxes paid: $3,435 (reported on 12.5% of returns)
38040:
$3,435
State:
$4,829
(% of AGI for various income ranges: 0.7% for AGIs $25k-50k, 0.9% for AGIs $50k-75k, 1.0% for AGIs $75k-100k, 1.8% for AGIs $100k-200k, 1.3% for AGIs over 200k)
Earned income credit: $2,581 (reported on 30.3% of returns)
Here:
$2,581
State:
$2,404
(% of AGI for various income ranges: 10.9% for AGIs below $25k, 1.6% for AGIs $25k-50k)
Percentage of individuals using paid preparers for their 2012 taxes: 68.8%
Here:
69%
State:
52%
(% for various income ranges: 64.9% for AGIs below $25k, 69.5% for AGIs $25k-50k, 73.1% for AGIs $50k-75k, 71.4% for AGIs $75k-100k, 75.0% for AGIs $100k-200k, 100.0% for AGIs over 200k)
Averages for the 2004 tax year for zip code 38040, filed in 2005:
Average Adjusted Gross Income (AGI) in 2004: $34,123 (Individual Income Tax Returns)
Here:
$34,123
State:
$44,088
Salary/wage: $30,713 (reported on 85.9% of returns)
Here:
$30,713
State:
$38,825
(% of AGI for various income ranges: 133.3% for AGIs below $10k, 81.1% for AGIs $10k-25k, 86.8% for AGIs $25k-50k, 83.4% for AGIs $50k-75k, 78.6% for AGIs $75k-100k, 43.1% for AGIs over 100k)
Taxable interest for individuals: $1,853 (reported on 32.1% of returns)
This zip code:
$1,853
Tennessee:
$1,802
(% of AGI for various income ranges: 8.8% for AGIs below $10k, 2.1% for AGIs $10k-25k, 1.1% for AGIs $25k-50k, 1.0% for AGIs $50k-75k, 1.4% for AGIs $75k-100k, 3.0% for AGIs over 100k)
Taxable dividends: $1,123 (reported on 10.8% of returns)
Here:
$1,123
State:
$3,727
(% of AGI for various income ranges: 1.0% for AGIs below $10k, 0.4% for AGIs $10k-25k, 0.1% for AGIs $25k-50k, 0.4% for AGIs $50k-75k, 0.4% for AGIs $75k-100k, 0.6% for AGIs over 100k)
Net capital gain/loss: +$2,308 (reported on 8.5% of returns)
Here:
+$2,308
State:
+$15,776
(% of AGI for various income ranges: 2.7% for AGIs below $10k, 0.3% for AGIs $10k-25k, 0.2% for AGIs $25k-50k, 0.2% for AGIs $50k-75k, 0.4% for AGIs $75k-100k, 1.9% for AGIs over 100k)
Profit/loss from business: +$6,459 (reported on 16.2% of returns)
Here:
+$6,459
State:
+$12,882
(% of AGI for various income ranges: 22.7% for AGIs below $10k, 4.9% for AGIs $10k-25k, 2.7% for AGIs $25k-50k, 1.2% for AGIs $50k-75k, 0.0% for AGIs $75k-100k, 4.7% for AGIs over 100k)
Profit/loss from farming: +$2,018 (reported on 5.4% of returns)
Here:
+$2,018
State:
-$6,038
(% of AGI for various income ranges: -0.6% for AGIs below $10k, -1.1% for AGIs $10k-25k, 0.4% for AGIs $25k-50k, 0.0% for AGIs $50k-75k, 2.7% for AGIs $75k-100k)
IRA payment deduction: $2,533 (reported on 0.7% of returns)
38040:
$2,533
Tennessee:
$2,934
Total itemized deductions: $15,281 (19% of AGI, reported on 13.7% of returns)
Here:
$15,281
State:
$18,035
Here:
19.3% of AGI
State:
19.9% of AGI
(% of AGI for various income ranges: 5.5% for AGIs $10k-25k, 5.4% for AGIs $25k-50k, 7.1% for AGIs $50k-75k, 8.5% for AGIs $75k-100k, 5.5% for AGIs over 100k)
Charity contributions deductions: $4,607 (5% of AGI, reported on 11.8% of returns)
Here:
$4,607
State:
$5,167
Here:
5.4% of AGI
State:
5.3% of AGI
(% of AGI for various income ranges: 0.6% for AGIs $10k-25k, 1.0% for AGIs $25k-50k, 1.9% for AGIs $50k-75k, 2.5% for AGIs $75k-100k, 2.6% for AGIs over 100k)
Total tax: $4,252 (reported on 68.5% of returns)
38040:
$4,252
State:
$7,482
(% of AGI for various income ranges: 6.3% for AGIs below $10k, 3.3% for AGIs $10k-25k, 6.1% for AGIs $25k-50k, 8.7% for AGIs $50k-75k, 11.1% for AGIs $75k-100k, 15.3% for AGIs over 100k)
Earned income credit: $1,807 (reported on 28.3% of returns)
Here:
$1,807
State:
$1,826
Percentage of individuals using paid preparers for their 2004 taxes: 73.9%
Here:
74%
State:
60%
(% for various income ranges: 69.0% for AGIs below $10k, 75.0% for AGIs $10k-25k, 75.3% for AGIs $25k-50k, 73.4% for AGIs $50k-75k, 75.2% for AGIs $75k-100k, 86.0% for AGIs over 100k)
Likely homosexual households (counted as self-reported same-sex unmarried-partner households)
Lesbian couples: 0.2% of all households
Gay men: 0.0% of all households
Household received Food Stamps/SNAP in the past 12 months: 428 Household did not receive Food Stamps/SNAP in the past 12 months: 1,747
Women who had a birth in the past 12 months: 114 (31 now married, 80 unmarried) Women who did not have a birth in the past 12 months: 858 (438 now married, 419 unmarried)
Housing units in zip code 38040 with a mortgage: 499 (18 second mortgage, 8 home equity loan, 7 both second mortgage and home equity loan) Houses without a mortgage: 6
Median monthly owner costs for units with a mortgage: $888 Median monthly owner costs for units without a mortgage: $434
Residents with income below the poverty level in 2022:
This zip code:
17.4%
Whole state:
13.3%
Residents with income below 50% of the poverty level in 2022:
This zip code:
9.7%
Whole state:
7.1%
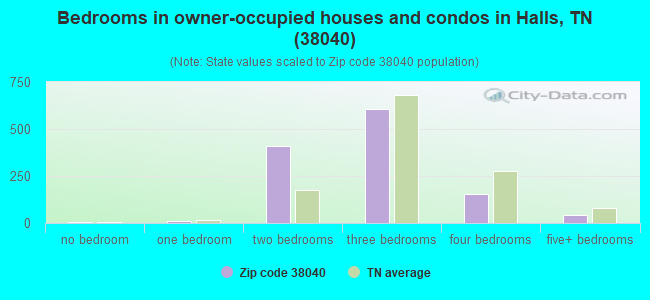
Median number of rooms in houses and condos:
Here:
5.6
State:
6.5
Median number of rooms in apartments:
Here:
4.9
State:
4.4
Notable locations in this zip code not listed on our city pages
Churches in zip code 38040 include: Halls First Baptist Church (A), Hales Point Church (B), Elon CHurch (C), Poplar Grove Church (D), Archer Chapel (E), Williams Chapel (F), Antioch Church (G), Helm Church (H), Henning Grove Church (I). Display/hide their locations on the map
Cemeteries: Anderson Cemetery (1), Anderson Chapel Cemetery (2), Beech Bluff Cemetery (3), Thurmand Cemetery (4), Dunavant Cemetery (5), Parr Cemetery (6), Elon Cemetery (7). Display/hide their locations on the map
Streams, rivers, and creeks: Lick Creek (A), Knob Creek (B), Double Branches (C), Chambers Branch (D), Halls Creek (E), Black Creek (F), Beech Bluff (G), Bear Creek (H), Sunrow Creek (I). Display/hide their locations on the map
Size of family households: 827 2-persons, 262 3-persons, 190 4-persons, 120 5-persons, 33 6-persons, 8 7-or-more-persons
Size of nonfamily households: 601 1-person, 141 2-persons
601 married couples with children.
428 single-parent households (90 men, 338 women).
96.0% of residents of 38040 zip code speak English at home.
3.7% of residents speak Spanish at home (55% very well, 45% not well).
0.2% of residents speak other Indo-European language at home (100% very well).
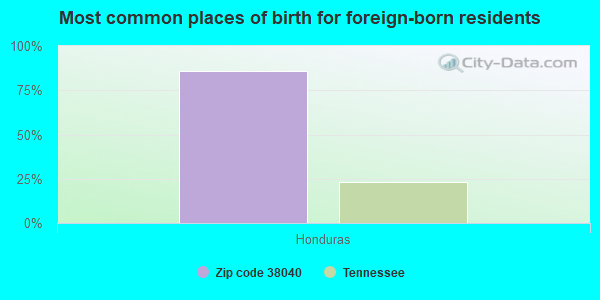
Foreign born population: 78 (1.6%) (100.0% of them are naturalized citizens)
This zip code:
1.6%
Whole state:
5.6%
86%Honduras
26%American
15%English
10%Irish
7%German
1%Norwegian
1%Italian
1%Scotch-Irish
Year of entry for the foreign-born population
02010 or later
762000 to 2009
01990 to 1999
0Before 1990
Facilities with environmental interests located in this zip code:
ANDERSON HICKEY COMPANY (60 INDUSTRIAL PARK ROAD in HALLS, TN)
AIR MINOR (AIRS/AFS) CRITERIA AND HAZARDOUS AIR POLLUTANT INVENTORY (Inventory of air pollution sources) (Resource Conservation and Recovery Act (tracking hazardous waste)) TRI REPORTER (Tracking of toxic chemicals releasing facilities) Business SIC classification: METAL HOUSEHOLD FURNITURE; OFFICE FURNITURE, EXCEPT WOOD Business NAICS classification: NONUPHOLSTERED WOOD HOUSEHOLD FURNITURE MANUFACTURING.; INSTITUTIONAL FURNITURE MANUFACTURING.
DELWOOD FURN CO (VIAR RD in HALLS, TN)
AIR MINOR (AIRS/AFS) Business SIC classification: WOOD HOUSEHOLD FURNITURE, UPHOLSTERED
CRAFCO, INC. - HALLS (121 INDUSTRIAL PARK RD. in HALLS, TN)
TRI REPORTER (Tracking of toxic chemicals releasing facilities) Business SIC classification: ASPHALT PAVING MIXTURES AND BLOCKS Alternative names: CRAFCO INC. HALLS
Housing units lacking complete plumbing facilities: 1.8% Housing units lacking complete kitchen facilities: 3.5%
57.0%Utility gas
38.6%Electricity
3.8%Bottled, tank, or LP gas
Population in 1990: 3,755. Population change in the 1990s: +1,592 (+42.4%).
Place of birth for U.S.-born residents:
This state: 3,998
Northeast: 61
Midwest: 359
South: 351
West: 21
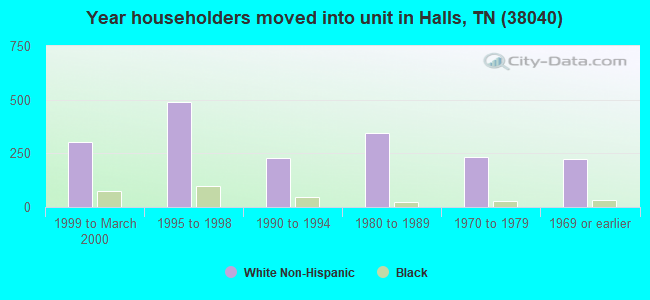
55% of the 38040 zip code residents lived in the same house 5 years ago. Out of people who lived in different houses, 64% lived in this county. Out of people who lived in different counties, 50% lived in Tennessee.
92% of the 38040 zip code residents lived in the same house 1 year ago. Out of people who lived in different houses, 67% moved from this county. Out of people who lived in different houses, 24% moved from different county within same state. Out of people who lived in different houses, 7% moved from different state.
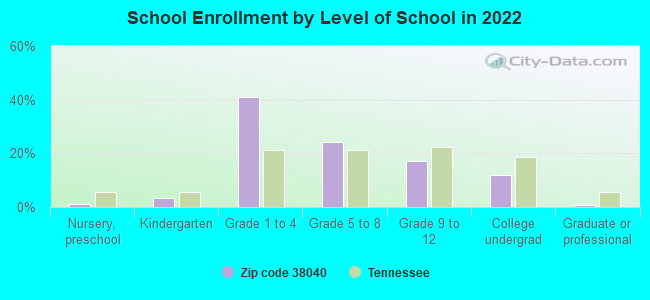
Private vs. public school enrollment:
Students in private schools in grades 1 to 8 (elementary and middle school): 33
Here:
4.6%
Tennessee:
15.0%
Students in private schools in grades 9 to 12 (high school): 5
Here:
3.0%
Tennessee:
16.2%
Students in private undergraduate colleges:
Here:
0.0%
Tennessee:
23.5%
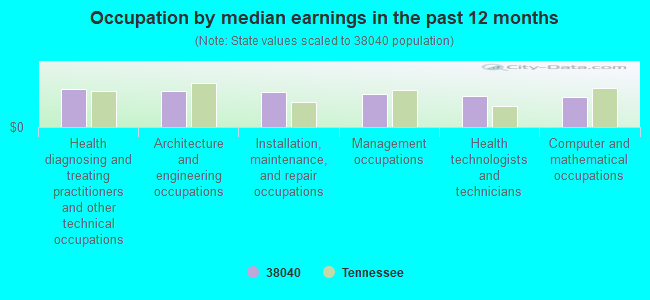
Occupation by median earnings in the past 12 months ($)
52,720Health diagnosing and treating practitioners and other technical occupations
50,780Architecture and engineering occupations
48,259Installation, maintenance, and repair occupations
45,663Management occupations
42,771Health technologists and technicians
41,509Computer and mathematical occupations
Top industries in this zip code by the number of employees in 2005:
Wholesale Trade: Recyclable Material Merchant Wholesalers (20-49: 1)
Finance and Insurance: Commercial Banking (10-19: 2, 1-4: 1)
Wholesale Trade: Grain and Field Bean Merchant Wholesalers (10-19: 1, 5-9: 1)
Fatal accident statistics in 2013:
Fatal accident count: 1
Vehicles involved in fatal accidents: 1
Fatal accidents caused by drunken drivers: 0
Fatalities: 1
Persons involved in fatal accidents: 2
Pedestrians involved in fatal accidents: 1
Fatal accident statistics in 2012:
Fatal accident count: 3
Vehicles involved in fatal accidents: 4
Fatal accidents caused by drunken drivers: 2
Fatalities: 3
Persons involved in fatal accidents: 4
Pedestrians involved in fatal accidents: 0
2004 - 2018 National Fire Incident Reporting System (NFIRS) incidents
According to the data from the years 2004 - 2018 the average number of fires per year is 31. The highest number of fire incidents - 75 took place in 2006, and the least - 4 in 2004. The data has a rising trend.
When looking into fire subcategories, the most incidents belonged to: Outside Fires (48.3%), and Structure Fires (38.8%).
Fire incident types reported to NFIRS in Zip Code 38040


+$2,018
-$6,038
(% of AGI for various income ranges: -0.6% for AGIs below $10k, -1.1% for AGIs $10k-25k, 0.4% for AGIs $25k-50k, 0.0% for AGIs $50k-75k, 2.7% for AGIs $75k-100k)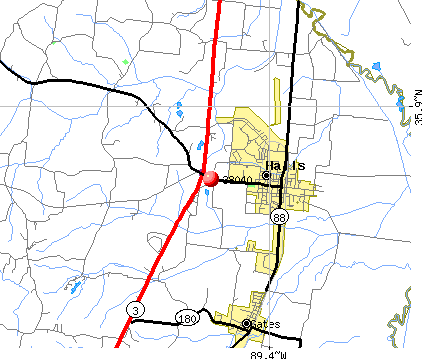 Nearest zip codes: 38037, 38024, 38030, 38047, 38034, 38070.


 According to the data from the years 2004 - 2018 the average number of fires per year is 31. The highest number of fire incidents - 75 took place in 2006, and the least - 4 in 2004. The data has a rising trend.
 When looking into fire subcategories, the most incidents belonged to: Outside Fires (48.3%), and Structure Fires (38.8%).