Estimated zip code population in 2022: 4,608 Zip code population in 2010: 5,085 Zip code population in 2000: 4,964
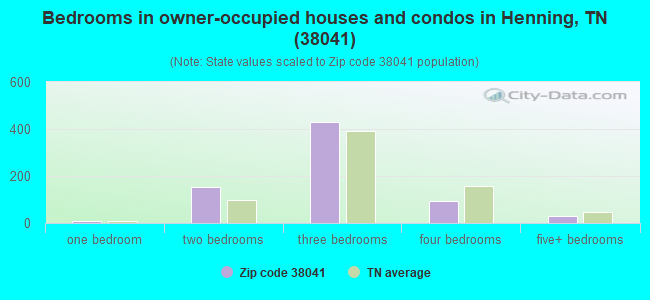
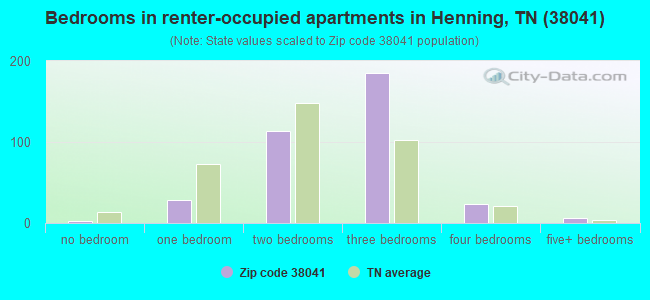
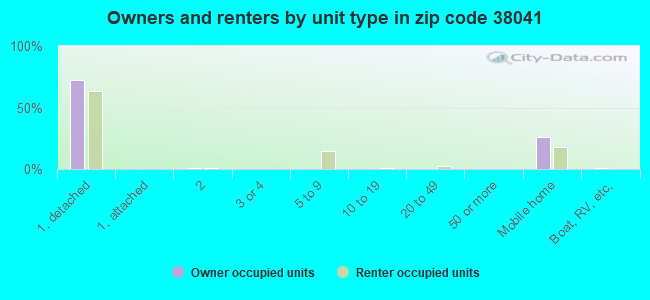
Houses and condos: 1,376 Renter-occupied apartments: 366
% of renters here:
34%
State:
33%
March 2022 cost of living index in zip code 38041: 77.5 (low, U.S. average is 100)
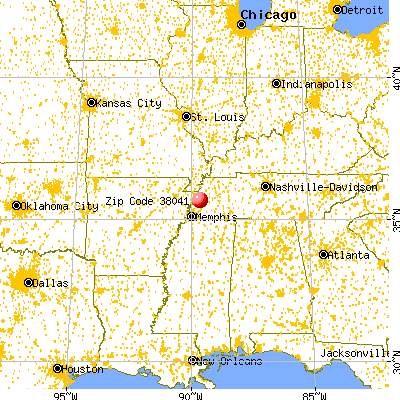
Land area: 100.5 sq. mi. Water area: 4.6 sq. mi.
Population density: 46 people per square mile
(very low).
OSM Map
General Map
Google Map
MSN Map
OSM Map
General Map
Google Map
MSN Map
OSM Map
General Map
Google Map
MSN Map
OSM Map
General Map
Google Map
MSN Map
Please wait while loading the map...
Real estate property taxes paid for housing units in 2022:
This zip code:
0.6% ($641)
Tennessee:
0.5% ($1,376)
Median real estate property taxes paid for housing units with mortgages in 2022: $516 (0.5%) Median real estate property taxes paid for housing units with no mortgage in 2022: $786 (0.7%)
Business Search- 14 Million verified businesses
Males: 2,741
(59.5%)
Females: 1,866
(40.5%)
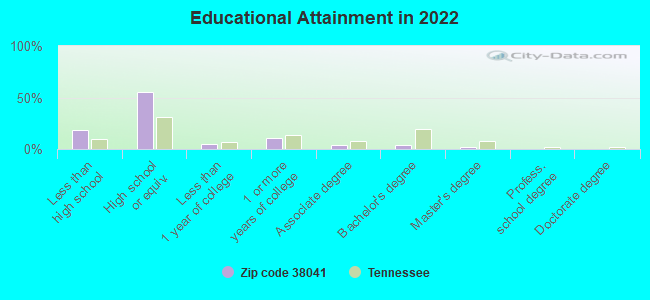
For population 25 years and over in 38041:
High school or higher: 79.8%
Bachelor's degree or higher: 6.6%
Graduate or professional degree: 2.5%
Unemployed: 7.6%
Mean travel time to work (commute): 28.1 minutes
For population 15 years and over in 38041:
Never married: 47.9%
Now married: 29.3%
Separated: 3.6%
Widowed: 5.8%
Divorced: 13.4%
Zip code 38041 compared to state average:
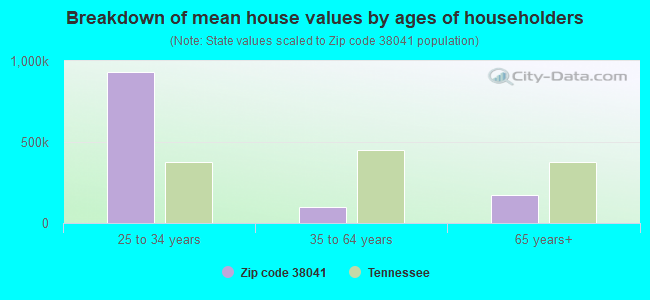
Median house value significantly below state average.
Unemployed percentage above state average.
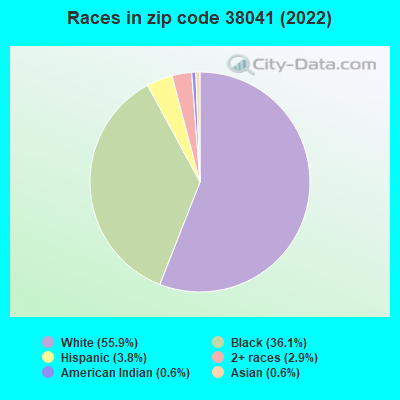
Black race population percentage above state average.
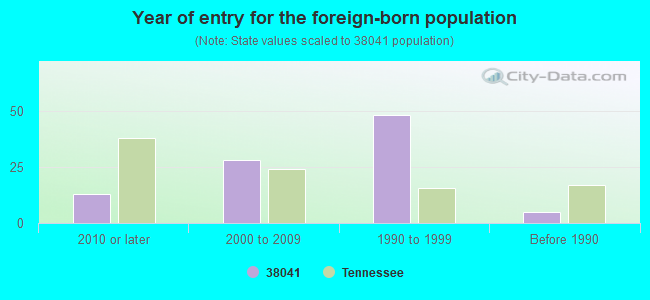
Foreign-born population percentage significantly below state average.
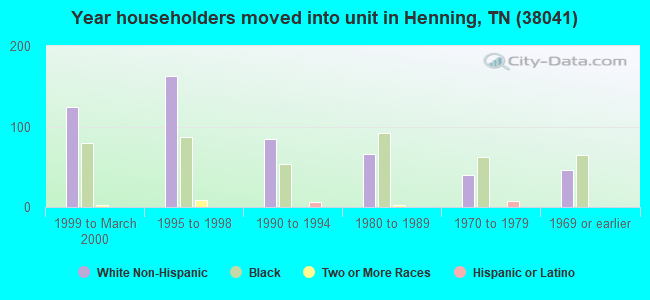
Length of stay since moving in significantly above state average.
Percentage of population with a bachelor's degree or higher significantly below state average.
Averages for the 2020 tax year for zip code 38041, filed in 2021:
Average Adjusted Gross Income (AGI) in 2020: $34,725 (Individual Income Tax Returns)
Here:
$34,725
State:
$69,014
Salary/wage: $31,915 (reported on 83.1% of returns)
Here:
$31,915
State:
$55,872
(% of AGI for various income ranges: 1175.7% for AGIs below $25k, 3690.4% for AGIs $25k-50k, 6445.5% for AGIs $50k-75k, 9077.5% for AGIs $75k-100k, 20360.0% for AGIs $100k-200k)
Taxable interest for individuals: $294 (reported on 15.3% of returns)
This zip code:
$294
Tennessee:
$1,945
(% of AGI for various income ranges: 0.9% for AGIs below $25k, 3.9% for AGIs $25k-50k, 14.5% for AGIs $50k-75k, 76.7% for AGIs $100k-200k)
Ordinary dividends: $833 (reported on 2.5% of returns)
Here:
$833
State:
$8,105
(% of AGI for various income ranges: 8.9% for AGIs $25k-50k)
Net capital gain/loss in AGI: +$10,775 (reported on 3.4% of returns)
Here:
+$10,775
State:
+$33,664
(% of AGI for various income ranges: 2.9% for AGIs below $25k, 1052.5% for AGIs $75k-100k)
Profit/loss from business: +$1,757 (reported on 11.9% of returns)
Here:
+$1,757
State:
+$18,991
(% of AGI for various income ranges: 51.4% for AGIs below $25k, 305.0% for AGIs $75k-100k)
Taxable individual retirement arrangement distribution: $12,533 (reported on 2.5% of returns)
38041:
$12,533
Tennessee:
$20,036
(% of AGI for various income ranges: 134.3% for AGIs $25k-50k)
Earned income credit: $2,446 (reported on 23.7% of returns)
Here:
$2,446
State:
$2,391
(% of AGI for various income ranges: 132.9% for AGIs below $25k, 78.6% for AGIs $25k-50k)
Percentage of individuals using paid preparers for their 2020 taxes: 82.2%
Here:
82%
State:
93%
(% for various income ranges: 67.2% for AGIs below $25k, 97.1% for AGIs $25k-50k, 92.9% for AGIs $50k-75k, 100.0% for AGIs $75k-100k, 100.0% for AGIs $100k-200k)
Averages for the 2012 tax year for zip code 38041, filed in 2013:
Average Adjusted Gross Income (AGI) in 2012: $31,174 (Individual Income Tax Returns)
Here:
$31,174
State:
$53,767
Salary/wage: $28,259 (reported on 89.1% of returns)
Here:
$28,259
State:
$45,421
(% of AGI for various income ranges: 84.2% for AGIs below $25k, 85.3% for AGIs $25k-50k, 80.5% for AGIs $50k-75k, 72.3% for AGIs $75k-100k, 66.1% for AGIs $100k-200k)
Taxable interest for individuals: $287 (reported on 14.9% of returns)
This zip code:
$287
Tennessee:
$1,732
(% of AGI for various income ranges: 0.1% for AGIs below $25k, 0.1% for AGIs $25k-50k, 0.5% for AGIs $75k-100k)
Ordinary dividends: $500 (reported on 3.0% of returns)
Here:
$500
State:
$6,739
Net capital gain/loss in AGI: +$467 (reported on 3.0% of returns)
Here:
+$467
State:
+$19,082
Profit/loss from business: +$5,508 (reported on 11.9% of returns)
Here:
+$5,508
State:
+$15,240
(% of AGI for various income ranges: 5.8% for AGIs below $25k, 0.3% for AGIs $25k-50k, 3.3% for AGIs $50k-75k)
Taxable individual retirement arrangement distribution: $5,225 (reported on 4.0% of returns)
38041:
$5,225
Tennessee:
$15,505
Total itemized deductions: $17,718 (33% of AGI, reported on 10.9% of returns)
Here:
$17,718
State:
$21,976
Here:
32.9% of AGI
State:
17.8% of AGI
(% of AGI for various income ranges: 4.2% for AGIs below $25k, 6.5% for AGIs $25k-50k, 6.1% for AGIs $50k-75k, 16.9% for AGIs $75k-100k)
Charity contributions: $4,956 (reported on 8.9% of returns)
Here:
$4,956
State:
$6,709
Taxes paid: $2,355 (reported on 10.9% of returns)
38041:
$2,355
State:
$4,829
(% of AGI for various income ranges: 0.4% for AGIs below $25k, 0.8% for AGIs $25k-50k, 0.9% for AGIs $50k-75k, 2.8% for AGIs $75k-100k)
Earned income credit: $2,616 (reported on 37.6% of returns)
Here:
$2,616
State:
$2,404
(% of AGI for various income ranges: 11.6% for AGIs below $25k, 1.6% for AGIs $25k-50k)
Percentage of individuals using paid preparers for their 2012 taxes: 65.3%
Here:
65%
State:
52%
(% for various income ranges: 62.0% for AGIs below $25k, 63.6% for AGIs $25k-50k, 81.8% for AGIs $50k-75k, 75.0% for AGIs $75k-100k, 66.7% for AGIs $100k-200k)
Averages for the 2004 tax year for zip code 38041, filed in 2005:
Average Adjusted Gross Income (AGI) in 2004: $27,322 (Individual Income Tax Returns)
Here:
$27,322
State:
$44,088
Salary/wage: $25,757 (reported on 91.5% of returns)
Here:
$25,757
State:
$38,825
(% of AGI for various income ranges: 84.2% for AGIs below $10k, 91.1% for AGIs $10k-25k, 90.2% for AGIs $25k-50k, 88.7% for AGIs $50k-75k, 73.1% for AGIs $75k-100k, 54.8% for AGIs over 100k)
Taxable interest for individuals: $818 (reported on 15.3% of returns)
This zip code:
$818
Tennessee:
$1,802
(% of AGI for various income ranges: 1.3% for AGIs below $10k, 0.4% for AGIs $10k-25k, 0.6% for AGIs $25k-50k, 0.2% for AGIs $50k-75k, 0.7% for AGIs $75k-100k)
Taxable dividends: $463 (reported on 3.5% of returns)
Here:
$463
State:
$3,727
(% of AGI for various income ranges: 0.4% for AGIs below $10k, 0.1% for AGIs $25k-50k, 0.0% for AGIs $50k-75k, 0.1% for AGIs $75k-100k)
Net capital gain/loss: +$1,276 (reported on 2.4% of returns)
Here:
+$1,276
State:
+$15,776
Profit/loss from business: +$3,714 (reported on 10.6% of returns)
Here:
+$3,714
State:
+$12,882
(% of AGI for various income ranges: 5.4% for AGIs below $10k, 1.2% for AGIs $10k-25k, 2.0% for AGIs $25k-50k, 0.9% for AGIs $50k-75k, 0.0% for AGIs $75k-100k)
Total itemized deductions: $13,359 (28% of AGI, reported on 9.9% of returns)
Here:
$13,359
State:
$18,035
Here:
28.0% of AGI
State:
19.9% of AGI
(% of AGI for various income ranges: 2.8% for AGIs $10k-25k, 4.7% for AGIs $25k-50k, 6.9% for AGIs $50k-75k, 10.6% for AGIs $75k-100k)
Charity contributions deductions: $3,762 (7% of AGI, reported on 7.1% of returns)
Here:
$3,762
State:
$5,167
Here:
7.5% of AGI
State:
5.3% of AGI
(% of AGI for various income ranges: 0.2% for AGIs $10k-25k, 0.8% for AGIs $25k-50k, 1.8% for AGIs $50k-75k, 2.8% for AGIs $75k-100k)
Total tax: $3,104 (reported on 58.3% of returns)
38041:
$3,104
State:
$7,482
(% of AGI for various income ranges: 1.5% for AGIs below $10k, 2.6% for AGIs $10k-25k, 5.4% for AGIs $25k-50k, 9.3% for AGIs $50k-75k, 11.1% for AGIs $75k-100k, 17.8% for AGIs over 100k)
Earned income credit: $1,768 (reported on 39.0% of returns)
Here:
$1,768
State:
$1,826
Percentage of individuals using paid preparers for their 2004 taxes: 73.3%
Here:
73%
State:
60%
(% for various income ranges: 71.0% for AGIs below $10k, 73.2% for AGIs $10k-25k, 75.9% for AGIs $25k-50k, 70.3% for AGIs $50k-75k, 70.3% for AGIs $75k-100k, 83.3% for AGIs over 100k)
Likely homosexual households (counted as self-reported same-sex unmarried-partner households)
Lesbian couples: 0.4% of all households
Gay men: 0.0% of all households
Household received Food Stamps/SNAP in the past 12 months: 223 Household did not receive Food Stamps/SNAP in the past 12 months: 848
Women who had a birth in the past 12 months: 43 (12 now married, 30 unmarried) Women who did not have a birth in the past 12 months: 916 (242 now married, 673 unmarried)
Housing units in zip code 38041 with a mortgage: 225 Median monthly owner costs for units with a mortgage: $860 Median monthly owner costs for units without a mortgage: $447
Residents with income below the poverty level in 2022:
This zip code:
19.1%
Whole state:
13.3%
Residents with income below 50% of the poverty level in 2022:
This zip code:
5.5%
Whole state:
7.1%
Median number of rooms in houses and condos:
Here:
6.0
State:
6.5
Median number of rooms in apartments:
Here:
4.6
State:
4.4
Notable locations in this zip code not listed on our city pages
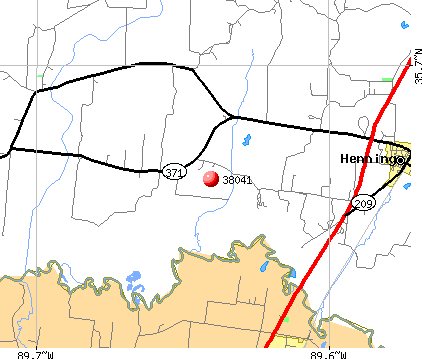
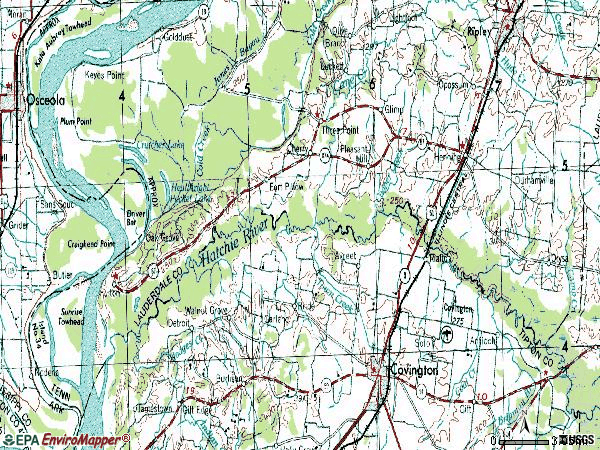
Notable locations in zip code 38041: Fort Pillow State Farm (A), Fort Pillow Landing (B), Head of Island Number Thirtyfour Landing (C), Lookout Landing (D), Saw Mill Landing (E), Henning Volunteer Fire Department (F). Display/hide their locations on the map
Churches in zip code 38041 include: Pilgrims Rest Church (A), Fulton Baptist Church (B), Bethel Church (C), Saint James Church (D), Saint Mark Church (E), Salem Church (F), El Canaan Church (G), Hamlett Temple (H), Oak Grove Church (I). Display/hide their locations on the map
Cemeteries: Samuels Cemetery (1), Bates Cemetery (2), Bethlehem Cemetery (3), Marrows Cemetery (4), Western Valley Cemetery (5), Saint James Cemetery (6), Elcanaan Cemetery (7). Display/hide their locations on the map
Lakes, reservoirs, and swamps: Champion Lake (A), Goose Pond (B), Bee Tree Pond (C), Convict Lake (D), Walker Pond (E), Trout Pond (F), Little Champion Lake (G), Ried Dunavant Lake (H). Display/hide their locations on the map
Streams, rivers, and creeks: Cold Creek (A), Cane Creek (B), Campground Creek (C), Camp Creek (D), Hatchie River (E), Boar Creek (F), Copper Springs Creek (G), Adams Bayou (H), The Chute (I). Display/hide their locations on the map
Parks in zip code 38041 include: Lower Hatchie National Wildlife Refuge (1), Fort Pillow State Park (2), Fort Pillow State Historic Area (3). Display/hide their locations on the map
In group quarters: 1,943 (-1 institutionalized population)
Size of family households: 306 2-persons, 169 3-persons, 79 4-persons, 52 5-persons, 35 6-persons, 11 7-or-more-persons
Size of nonfamily households: 376 1-person, 32 2-persons, 11 3-persons
265 married couples with children.
256 single-parent households (11 men, 245 women).
95.3% of residents of 38041 zip code speak English at home.
2.6% of residents speak Spanish at home (81% very well, 9% well, 3% not well, 6% not at all).
0.7% of residents speak other Indo-European language at home (100% very well).
0.5% of residents speak Asian or Pacific Island language at home (100% well).
0.4% of residents speak other language at home (100% very well).
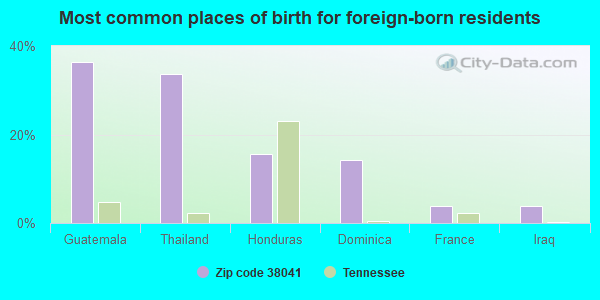
Foreign born population: 77 (1.7%) (8.0% of them are naturalized citizens)
This zip code:
1.7%
Whole state:
5.6%
36%Guatemala
34%Thailand
16%Honduras
14%Dominica
4%France
4%Iraq
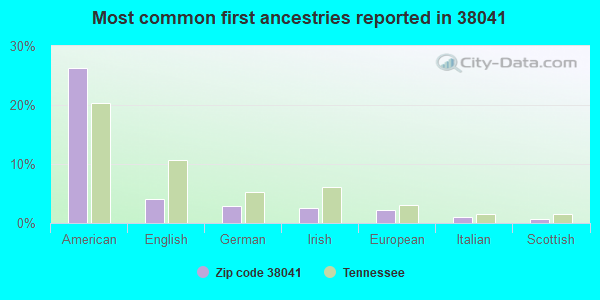
26%American
4%English
3%German
3%Irish
2%European
1%Italian
1%Scottish
Year of entry for the foreign-born population
132010 or later
282000 to 2009
481990 to 1999
5Before 1990
Facilities with environmental interests located in this zip code:
FIELDS & THOMPSON (NORTH MAIN STREET in HENNING, TN)
(Resource Conservation and Recovery Act (tracking hazardous waste)) Business NAICS classification: FABRICATED STRUCTURAL METAL MANUFACTURING.
Housing units lacking complete plumbing facilities: 4.9% Housing units lacking complete kitchen facilities: 6.9%
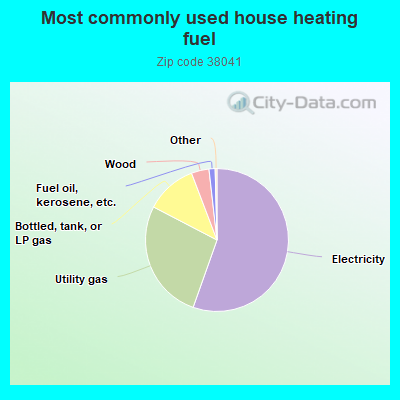
55.6%Electricity
27.3%Utility gas
11.6%Bottled, tank, or LP gas
4.0%Wood
1.4%Fuel oil, kerosene, etc.
Population in 1990: 4,298. Population change in the 1990s: +666 (+15.5%).
Place of birth for U.S.-born residents:
This state: 3,268
Northeast: 68
Midwest: 432
South: 617
West: 82
54% of the 38041 zip code residents lived in the same house 5 years ago. Out of people who lived in different houses, 40% lived in this county. Out of people who lived in different counties, 50% lived in Tennessee.
86% of the 38041 zip code residents lived in the same house 1 year ago. Out of people who lived in different houses, 10% moved from this county. Out of people who lived in different houses, 88% moved from different county within same state. Out of people who lived in different houses, 3% moved from different state. Out of people who lived in different houses, 2% moved from abroad.
Private vs. public school enrollment:
Students in private schools in grades 1 to 8 (elementary and middle school): 18
Here:
6.0%
Tennessee:
15.0%
Students in private schools in grades 9 to 12 (high school): 199
Here:
58.0%
Tennessee:
16.2%
Students in private undergraduate colleges: 123
Here:
65.8%
Tennessee:
23.5%
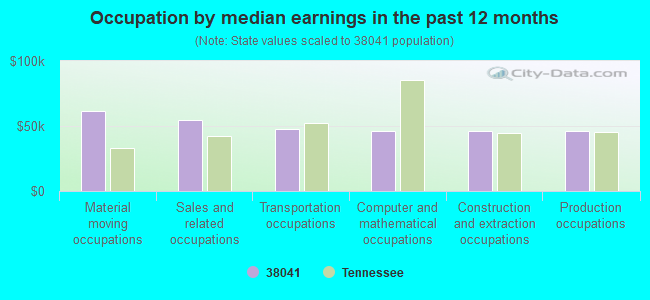
Occupation by median earnings in the past 12 months ($)
61,730Material moving occupations
54,883Sales and related occupations
47,899Transportation occupations
46,166Computer and mathematical occupations
45,876Construction and extraction occupations
45,846Production occupations
Top industries in this zip code by the number of employees in 2005:
Other Services (except Public Administration): Religious Organizations (5-9 employees: 1 establishment, 1-4 employees: 2 establishments)
Finance and Insurance: Commercial Banking (5-9: 1)
Wholesale Trade: Other Miscellaneous Nondurable Goods Merchant Wholesalers (5-9: 1)
Arts, Entertainment, and Recreation: Museums (1-4: 1)
People in group quarters in 2010:
2,494 people in state prisons
People in group quarters in 2000:
2,346 people in state prisons
Fatal accident statistics in 2014:
Fatal accident count: 1
Vehicles involved in fatal accidents: 1
Fatal accidents caused by drunken drivers: 0
Fatalities: 1
Persons involved in fatal accidents: 1
Pedestrians involved in fatal accidents: 0
Fatal accident statistics in 2012:
Fatal accident count: 1
Vehicles involved in fatal accidents: 2
Fatal accidents caused by drunken drivers: 0
Fatalities: 1
Persons involved in fatal accidents: 2
Pedestrians involved in fatal accidents: 0
2005 - 2018 National Fire Incident Reporting System (NFIRS) incidents
According to the data from the years 2005 - 2018 the average number of fire incidents per year is 27. The highest number of fire incidents - 45 took place in 2013, and the least - 9 in 2006. The data has a growing trend.
When looking into fire subcategories, the most reports belonged to: Structure Fires (39.0%), and Outside Fires (37.9%).
Fire incident types reported to NFIRS in Zip Code 38041


 Nearest zip codes: 38063, 38019, 38015, 38011, 72358, 38058.


 According to the data from the years 2005 - 2018 the average number of fire incidents per year is 27. The highest number of fire incidents - 45 took place in 2013, and the least - 9 in 2006. The data has a growing trend.
 When looking into fire subcategories, the most reports belonged to: Structure Fires (39.0%), and Outside Fires (37.9%).