Estimated zip code population in 2022: 2,842 Zip code population in 2010: 2,376 Zip code population in 2000: 2,523
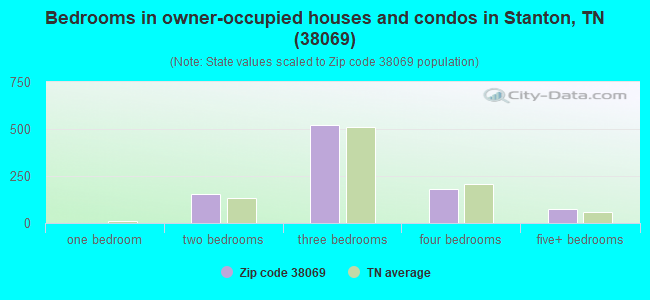
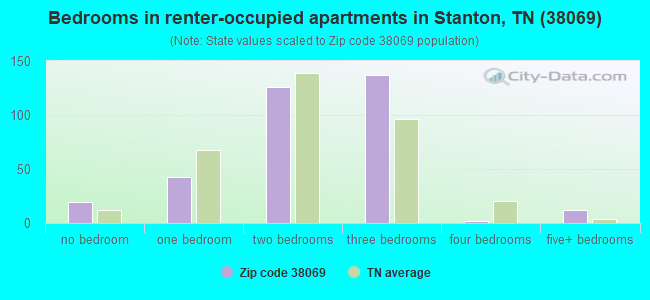
Houses and condos: 1,496 Renter-occupied apartments: 342
% of renters here:
27%
State:
33%
March 2022 cost of living index in zip code 38069: 78.5 (low, U.S. average is 100)
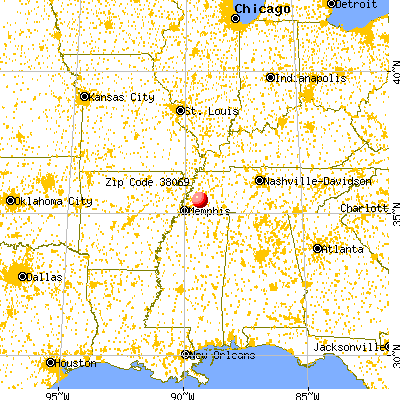
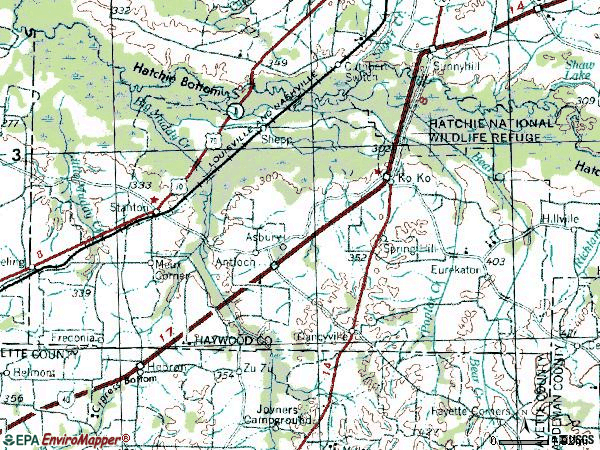
Land area: 131.5 sq. mi. Water area: 0.1 sq. mi.
Population density: 22 people per square mile
(very low).
OSM Map
General Map
Google Map
MSN Map
OSM Map
General Map
Google Map
MSN Map
OSM Map
General Map
Google Map
MSN Map
OSM Map
General Map
Google Map
MSN Map
Please wait while loading the map...
Real estate property taxes paid for housing units in 2022:
This zip code:
0.4% ($634)
Tennessee:
0.5% ($1,376)
Median real estate property taxes paid for housing units with mortgages in 2022: $642 (0.4%) Median real estate property taxes paid for housing units with no mortgage in 2022: $630 (0.4%)
Business Search- 14 Million verified businesses
Males: 1,161
(40.9%)
Females: 1,680
(59.1%)
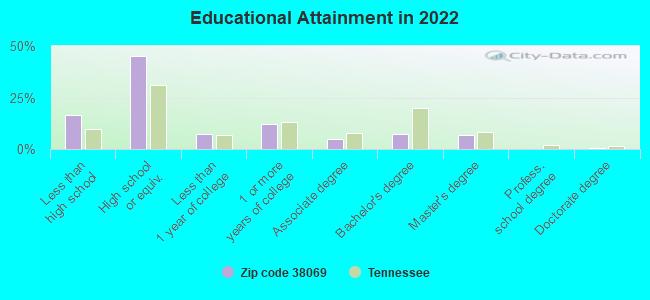
For population 25 years and over in 38069:
High school or higher: 82.0%
Bachelor's degree or higher: 14.4%
Graduate or professional degree: 7.2%
Unemployed: 6.1%
Mean travel time to work (commute): 35.0 minutes
For population 15 years and over in 38069:
Never married: 29.1%
Now married: 43.0%
Separated: 3.6%
Widowed: 10.9%
Divorced: 13.4%
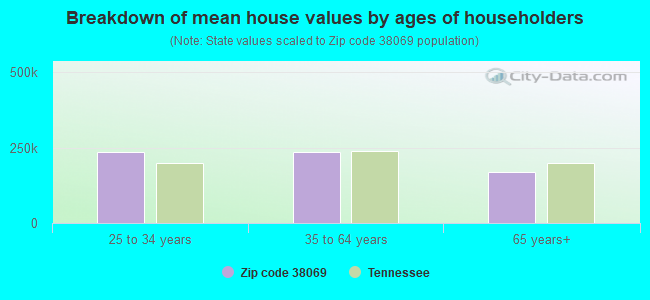
Zip code 38069 compared to state average:
Median house value below state average.
Unemployed percentage above state average.
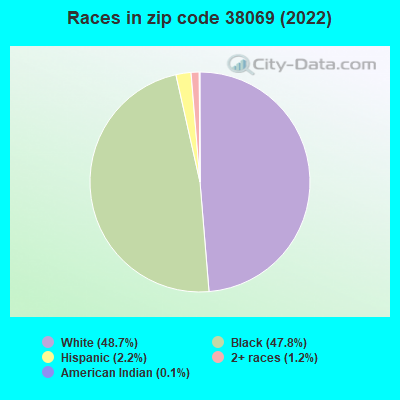
Black race population percentage significantly above state average.
Hispanic race population percentage below state average.
Median age significantly above state average.
Foreign-born population percentage significantly below state average.
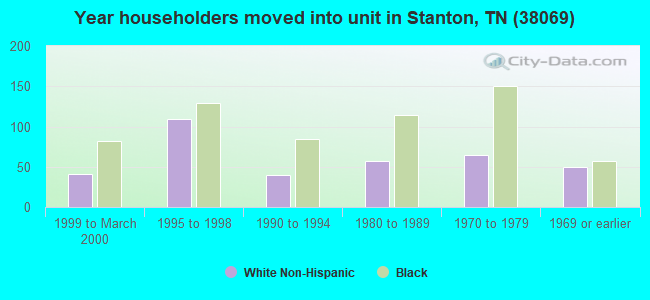
Length of stay since moving in significantly above state average.
Percentage of population with a bachelor's degree or higher below state average.
Averages for the 2020 tax year for zip code 38069, filed in 2021:
Average Adjusted Gross Income (AGI) in 2020: $42,272 (Individual Income Tax Returns)
Here:
$42,272
State:
$69,014
Salary/wage: $39,921 (reported on 84.5% of returns)
Here:
$39,921
State:
$55,872
(% of AGI for various income ranges: 1239.2% for AGIs below $25k, 4027.9% for AGIs $25k-50k, 6683.6% for AGIs $50k-75k, 10620.0% for AGIs $75k-100k, 19072.0% for AGIs $100k-200k)
Taxable interest for individuals: $312 (reported on 13.8% of returns)
This zip code:
$312
Tennessee:
$1,945
(% of AGI for various income ranges: 2.7% for AGIs below $25k, 3.2% for AGIs $25k-50k, 4.5% for AGIs $50k-75k, 25.0% for AGIs $75k-100k, 22.0% for AGIs $100k-200k)
Ordinary dividends: $817 (reported on 5.2% of returns)
Here:
$817
State:
$8,105
(% of AGI for various income ranges: 3.2% for AGIs below $25k, 61.7% for AGIs $75k-100k)
Net capital gain/loss in AGI: +$1,980 (reported on 4.3% of returns)
Here:
+$1,980
State:
+$33,664
(% of AGI for various income ranges: 6.8% for AGIs $25k-50k, 133.3% for AGIs $75k-100k)
Profit/loss from business: +$2,343 (reported on 18.1% of returns)
Here:
+$2,343
State:
+$18,991
(% of AGI for various income ranges: 63.0% for AGIs below $25k, 8.9% for AGIs $25k-50k, 390.0% for AGIs $75k-100k)
Taxable individual retirement arrangement distribution: $8,650 (reported on 3.4% of returns)
38069:
$8,650
Tennessee:
$20,036
(% of AGI for various income ranges: 314.5% for AGIs $50k-75k)
Total itemized deductions: $27,650 (reported on 3.4% of returns)
Here:
$27,650
State:
$40,136
(% of AGI for various income ranges: 1005.5% for AGIs $50k-75k)
Charity contributions: $10,600 (reported on 3.4% of returns)
Here:
$10,600
State:
$19,852
(% of AGI for various income ranges: 385.5% for AGIs $50k-75k)
Taxes paid: $4,325 (reported on 3.4% of returns)
38069:
$4,325
State:
$6,038
(% of AGI for various income ranges: 157.3% for AGIs $50k-75k)
Earned income credit: $2,493 (reported on 25.0% of returns)
Here:
$2,493
State:
$2,391
(% of AGI for various income ranges: 141.1% for AGIs below $25k, 71.8% for AGIs $25k-50k)
Percentage of individuals using paid preparers for their 2020 taxes: 93.1%
Here:
93%
State:
93%
(% for various income ranges: 93.5% for AGIs below $25k, 91.7% for AGIs $25k-50k, 93.3% for AGIs $50k-75k, 90.0% for AGIs $75k-100k, 100.0% for AGIs $100k-200k)
Averages for the 2012 tax year for zip code 38069, filed in 2013:
Average Adjusted Gross Income (AGI) in 2012: $34,280 (Individual Income Tax Returns)
Here:
$34,280
State:
$53,767
Salary/wage: $31,638 (reported on 86.0% of returns)
Here:
$31,638
State:
$45,421
(% of AGI for various income ranges: 83.7% for AGIs below $25k, 90.1% for AGIs $25k-50k, 79.4% for AGIs $50k-75k, 74.7% for AGIs $75k-100k, 58.7% for AGIs $100k-200k)
Taxable interest for individuals: $553 (reported on 13.2% of returns)
This zip code:
$553
Tennessee:
$1,732
(% of AGI for various income ranges: 0.3% for AGIs below $25k, 0.2% for AGIs $25k-50k, 0.2% for AGIs $50k-75k, 0.5% for AGIs $75k-100k)
Ordinary dividends: $475 (reported on 3.5% of returns)
Here:
$475
State:
$6,739
Net capital gain/loss in AGI: +$3,800 (reported on 2.6% of returns)
Here:
+$3,800
State:
+$19,082
Profit/loss from business: +$4,147 (reported on 16.7% of returns)
Here:
+$4,147
State:
+$15,240
(% of AGI for various income ranges: 6.2% for AGIs below $25k, 1.8% for AGIs $25k-50k, 1.4% for AGIs $50k-75k)
Taxable individual retirement arrangement distribution: $9,700 (reported on 4.4% of returns)
38069:
$9,700
Tennessee:
$15,505
Total itemized deductions: $16,527 (29% of AGI, reported on 13.2% of returns)
Here:
$16,527
State:
$21,976
Here:
29.2% of AGI
State:
17.8% of AGI
(% of AGI for various income ranges: 5.8% for AGIs below $25k, 6.6% for AGIs $25k-50k, 11.4% for AGIs $50k-75k, 5.8% for AGIs $100k-200k)
Charity contributions: $4,969 (reported on 11.4% of returns)
Here:
$4,969
State:
$6,709
(% of AGI for various income ranges: 0.9% for AGIs below $25k, 1.5% for AGIs $25k-50k, 1.8% for AGIs $50k-75k, 4.7% for AGIs $75k-100k)
Taxes paid: $2,407 (reported on 13.2% of returns)
38069:
$2,407
State:
$4,829
(% of AGI for various income ranges: 0.5% for AGIs below $25k, 0.8% for AGIs $25k-50k, 1.3% for AGIs $50k-75k, 2.4% for AGIs $75k-100k)
Earned income credit: $2,452 (reported on 36.8% of returns)
Here:
$2,452
State:
$2,404
(% of AGI for various income ranges: 11.0% for AGIs below $25k, 1.7% for AGIs $25k-50k)
Percentage of individuals using paid preparers for their 2012 taxes: 57.9%
Here:
58%
State:
52%
(% for various income ranges: 57.9% for AGIs below $25k, 54.5% for AGIs $25k-50k, 53.8% for AGIs $50k-75k, 83.3% for AGIs $75k-100k, 60.0% for AGIs $100k-200k)
Averages for the 2004 tax year for zip code 38069, filed in 2005:
Average Adjusted Gross Income (AGI) in 2004: $27,778 (Individual Income Tax Returns)
Here:
$27,778
State:
$44,088
Salary/wage: $26,028 (reported on 90.3% of returns)
Here:
$26,028
State:
$38,825
(% of AGI for various income ranges: 126.3% for AGIs below $10k, 87.6% for AGIs $10k-25k, 89.8% for AGIs $25k-50k, 85.0% for AGIs $50k-75k, 65.5% for AGIs $75k-100k, 53.8% for AGIs over 100k)
Taxable interest for individuals: $717 (reported on 16.5% of returns)
This zip code:
$717
Tennessee:
$1,802
(% of AGI for various income ranges: 0.3% for AGIs below $10k, 0.6% for AGIs $10k-25k, 0.6% for AGIs $25k-50k, 0.1% for AGIs $50k-75k, 0.4% for AGIs $75k-100k, 0.1% for AGIs over 100k)
Taxable dividends: $652 (reported on 5.3% of returns)
Here:
$652
State:
$3,727
(% of AGI for various income ranges: 0.1% for AGIs $10k-25k, 0.1% for AGIs $25k-50k, 0.1% for AGIs $50k-75k, 0.6% for AGIs $75k-100k)
Net capital gain/loss: +$1,385 (reported on 4.2% of returns)
Here:
+$1,385
State:
+$15,776
Profit/loss from business: +$4,994 (reported on 12.8% of returns)
Here:
+$4,994
State:
+$12,882
(% of AGI for various income ranges: 2.2% for AGIs below $10k, 3.7% for AGIs $10k-25k, 0.7% for AGIs $25k-50k, 5.9% for AGIs $50k-75k)
Total itemized deductions: $14,864 (30% of AGI, reported on 14.8% of returns)
Here:
$14,864
State:
$18,035
Here:
29.7% of AGI
State:
19.9% of AGI
(% of AGI for various income ranges: 3.6% for AGIs $10k-25k, 8.6% for AGIs $25k-50k, 9.7% for AGIs $50k-75k, 13.9% for AGIs $75k-100k, 8.6% for AGIs over 100k)
Charity contributions deductions: $4,497 (9% of AGI, reported on 12.8% of returns)
Here:
$4,497
State:
$5,167
Here:
9.0% of AGI
State:
5.3% of AGI
(% of AGI for various income ranges: 0.5% for AGIs $10k-25k, 1.9% for AGIs $25k-50k, 2.5% for AGIs $50k-75k, 8.6% for AGIs $75k-100k)
Total tax: $3,226 (reported on 61.0% of returns)
38069:
$3,226
State:
$7,482
(% of AGI for various income ranges: 3.3% for AGIs below $10k, 2.6% for AGIs $10k-25k, 5.7% for AGIs $25k-50k, 9.6% for AGIs $50k-75k, 12.2% for AGIs $75k-100k, 16.0% for AGIs over 100k)
Earned income credit: $1,891 (reported on 39.1% of returns)
Here:
$1,891
State:
$1,826
Percentage of individuals using paid preparers for their 2004 taxes: 69.4%
Here:
69%
State:
60%
(% for various income ranges: 61.1% for AGIs below $10k, 74.4% for AGIs $10k-25k, 68.6% for AGIs $25k-50k, 66.4% for AGIs $50k-75k, 72.7% for AGIs $75k-100k, 89.5% for AGIs over 100k)
Household received Food Stamps/SNAP in the past 12 months: 252 Household did not receive Food Stamps/SNAP in the past 12 months: 1,010
Women who had a birth in the past 12 months: 18 (9 now married, 9 unmarried) Women who did not have a birth in the past 12 months: 495 (157 now married, 337 unmarried)
Housing units in zip code 38069 with a mortgage: 317 (32 second mortgage, 21 both second mortgage and home equity loan) Median monthly owner costs for units with a mortgage: $994 Median monthly owner costs for units without a mortgage: $421
Residents with income below the poverty level in 2022:
This zip code:
11.7%
Whole state:
13.3%
Residents with income below 50% of the poverty level in 2022:
This zip code:
6.2%
Whole state:
7.1%
Median number of rooms in houses and condos:
Here:
6.7
State:
6.5
Median number of rooms in apartments:
Here:
4.7
State:
4.4
Notable locations in this zip code not listed on our city pages
Notable locations in zip code 38069: Brownsville - Haywood County Fire Department District 3 (A), Stanton Fire Department (B), Brownsville - Haywood County Fire Department District 4 (C), Brownsville - Haywood County Fire Department District 10 (D). Display/hide their locations on the map
Churches in zip code 38069 include: Fredonia Church (A), Green Leaf Church (B), Spring Hill Church (C), Saint Matthews Church (D), Prospect Church (E), Good Hope Church (F), Dancyville United Methodist Church (G), Harmony Church (H), Charleston United Methodist Church (I). Display/hide their locations on the map
Cemeteries: Scratchunder Cemetery (1), Scrub Oak Cemetery (2), Charleston Cemetery (3), Keeling Cemetery (4), Wesley Cemetery (5), Dancyville Cemetery (6), Collier Cemeteries (7). Display/hide their locations on the map
Lakes and reservoirs: Cutoff Lake (A), Bradford Lake (B), Round Hole Lake (C), Moon Lake (D), Wesley Lakes (E), Shepard Lake (F), Bond Cutoff Lake (G), Coffee Lake (H). Display/hide their locations on the map
Streams, rivers, and creeks: London Creek (A), Jeter Creek (B), Bear Creek (C), Big Muddy Creek (D), Poplar Creek (E), Big Ditch Branch (F), Prairie Creek (G). Display/hide their locations on the map
Size of family households: 377 2-persons, 192 3-persons, 103 4-persons, 4 5-persons, 44 6-persons, 22 7-or-more-persons
Size of nonfamily households: 464 1-person, 54 2-persons, 2 3-persons
113 married couples with children.
282 single-parent households (282 women).
98.4% of residents of 38069 zip code speak English at home.
1.0% of residents speak Spanish at home (82% very well, 18% well).
0.2% of residents speak Asian or Pacific Island language at home (100% very well).
0.3% of residents speak other language at home (56% very well, 44% well).
Foreign born population: 9 (0.3%) (100.0% of them are naturalized citizens)
This zip code:
0.3%
Whole state:
5.6%
44%Honduras
44%Ecuador
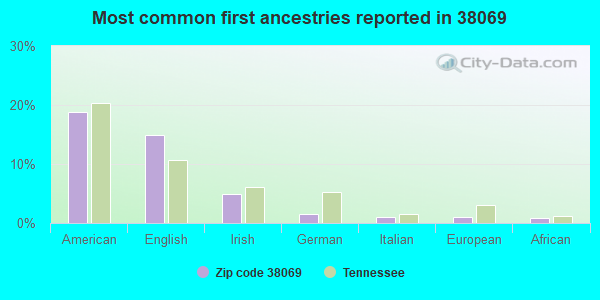
19%American
15%English
5%Irish
2%German
1%Italian
1%European
1%African
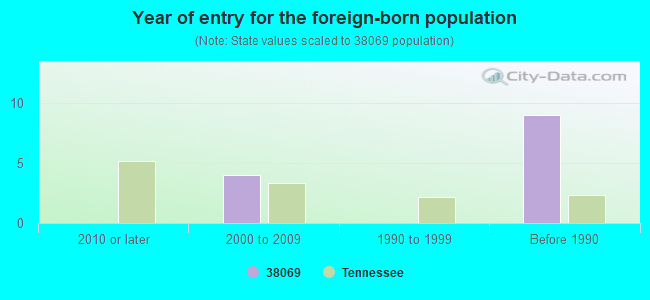
Year of entry for the foreign-born population
02010 or later
42000 to 2009
01990 to 1999
9Before 1990
Facilities with environmental interests located in this zip code:
EXIT 47 PLAZA SITE (815 DANCYVILLE ROAD in STANTON, TN)
SUPERFUND (Superfund database) Alternative names: 47 PLAZA CHEMICAL SPILL
Housing units lacking complete plumbing facilities: 5.7% Housing units lacking complete kitchen facilities: 5.7%
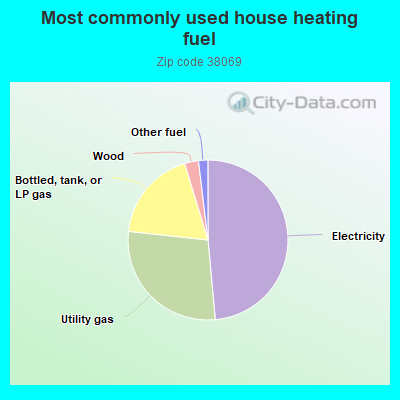
48.6%Electricity
28.2%Utility gas
18.6%Bottled, tank, or LP gas
2.8%Wood
1.9%Other fuel
Population in 1990: 2,940.
Place of birth for U.S.-born residents:
This state: 2,407
Northeast: 6
Midwest: 148
South: 193
West: 31
66% of the 38069 zip code residents lived in the same house 5 years ago. Out of people who lived in different houses, 59% lived in this county. Out of people who lived in different counties, 50% lived in Tennessee.
96% of the 38069 zip code residents lived in the same house 1 year ago. Out of people who lived in different houses, 42% moved from this county. Out of people who lived in different houses, 12% moved from different county within same state. Out of people who lived in different houses, 55% moved from different state.
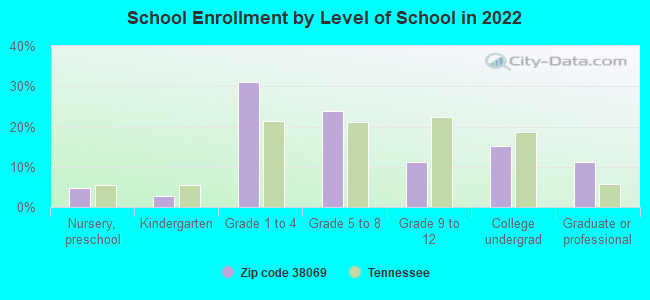
Private vs. public school enrollment:
Students in private schools in grades 1 to 8 (elementary and middle school): 5
Here:
1.6%
Tennessee:
15.0%
Students in private schools in grades 9 to 12 (high school):
Here:
0.0%
Tennessee:
16.2%
Students in private undergraduate colleges: 29
Here:
32.0%
Tennessee:
23.5%
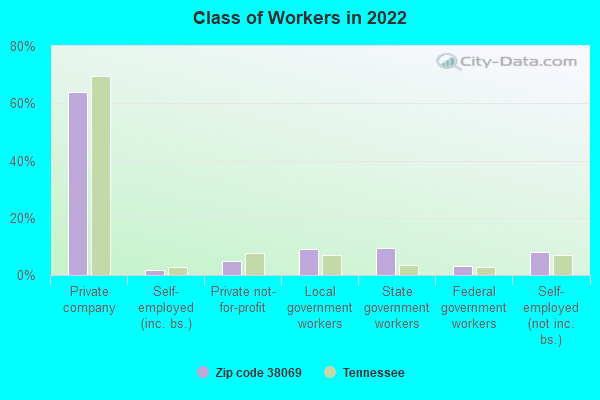
Occupation by median earnings in the past 12 months ($)
207,328Installation, maintenance, and repair occupations
147,844Management occupations
109,251Business and financial operations occupations
78,468Health diagnosing and treating practitioners and other technical occupations
52,606Health technologists and technicians
50,779Production occupations
Top industries in this zip code by the number of employees in 2005:
Construction: Plumbing, Heating, and Air-Conditioning Contractors (5-9 employees: 1 establishment)
Health Care and Social Assistance: Offices of Dentists (5-9: 1)
Other Services (except Public Administration): Religious Organizations (1-4: 3)
Construction: New Single-Family Housing Construction (except Operative Builders) (1-4: 2)
Construction: Site Preparation Contractors (1-4: 1)
People in group quarters in 2000:
10 people in other noninstitutional group quarters
Fatal accident statistics in 2014:
Fatal accident count: 1
Vehicles involved in fatal accidents: 3
Fatal accidents caused by drunken drivers: 0
Fatalities: 1
Persons involved in fatal accidents: 5
Pedestrians involved in fatal accidents: 0
Fatal accident statistics in 2013:
Fatal accident count: 3
Vehicles involved in fatal accidents: 3
Fatal accidents caused by drunken drivers: 1
Fatalities: 5
Persons involved in fatal accidents: 9
Pedestrians involved in fatal accidents: 1
2002 - 2018 National Fire Incident Reporting System (NFIRS) incidents
Based on the data from the years 2002 - 2018 the average number of fires per year is 9. The highest number of fire incidents - 20 took place in 2011, and the least - 3 in 2006. The data has a constant trend.
When looking into fire subcategories, the most reports belonged to: Outside Fires (40.9%), and Structure Fires (31.4%).
Fire incident types reported to NFIRS in Zip Code 38069


 Nearest zip codes: 38012, 38068, 38075, 38049, 38392, 38019.


 Based on the data from the years 2002 - 2018 the average number of fires per year is 9. The highest number of fire incidents - 20 took place in 2011, and the least - 3 in 2006. The data has a constant trend.
 When looking into fire subcategories, the most reports belonged to: Outside Fires (40.9%), and Structure Fires (31.4%).