Estimated zip code population in 2022: 4,166 Zip code population in 2010: 3,876 Zip code population in 2000: 3,741
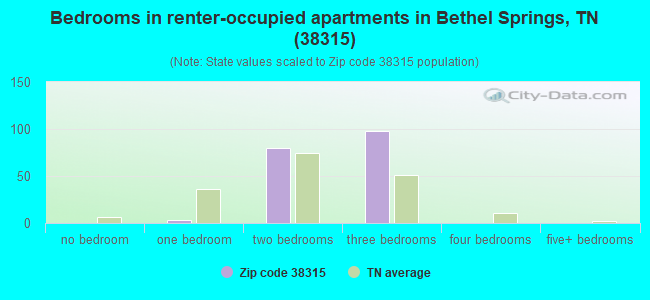
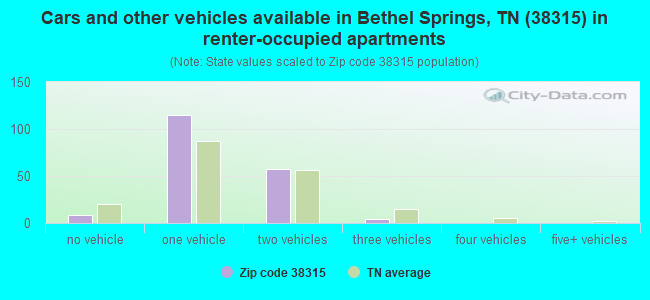
Houses and condos: 1,880 Renter-occupied apartments: 184
% of renters here:
12%
State:
33%
March 2022 cost of living index in zip code 38315: 78.6 (low, U.S. average is 100)
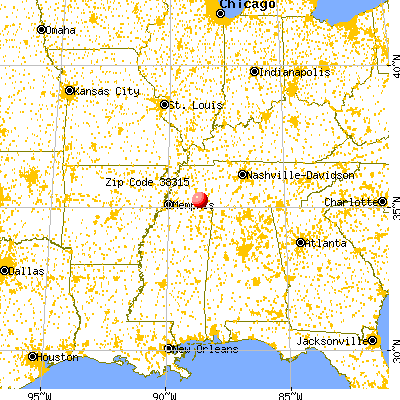
Land area: 111.5 sq. mi. Water area: 0.1 sq. mi.
Population density: 37 people per square mile
(very low).
OSM Map
General Map
Google Map
MSN Map
OSM Map
General Map
Google Map
MSN Map
OSM Map
General Map
Google Map
MSN Map
OSM Map
General Map
Google Map
MSN Map
Please wait while loading the map...
Real estate property taxes paid for housing units in 2022:
This zip code:
0.4% ($560)
Tennessee:
0.5% ($1,376)
Median real estate property taxes paid for housing units with mortgages in 2022: $626 (0.4%) Median real estate property taxes paid for housing units with no mortgage in 2022: $523 (0.4%)
Business Search- 14 Million verified businesses
Males: 1,809
(43.4%)
Females: 2,357
(56.6%)
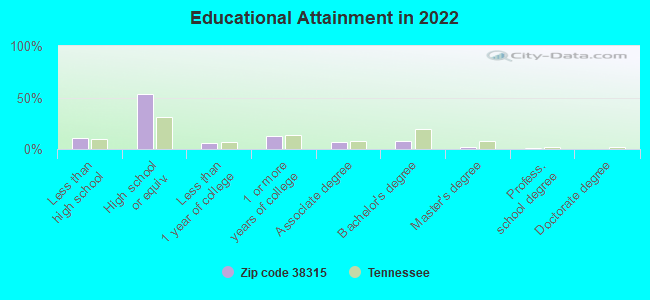
For population 25 years and over in 38315:
High school or higher: 88.1%
Bachelor's degree or higher: 10.7%
Graduate or professional degree: 2.8%
Unemployed: 3.7%
Mean travel time to work (commute): 32.7 minutes
For population 15 years and over in 38315:
Never married: 22.8%
Now married: 48.9%
Separated: 1.6%
Widowed: 12.0%
Divorced: 14.8%
Zip code 38315 compared to state average:
Median house value below state average.
Black race population percentage below state average.
Median age above state average.
Foreign-born population percentage significantly below state average.
Renting percentage significantly below state average.
Length of stay since moving in significantly above state average.
Number of college students below state average.
Percentage of population with a bachelor's degree or higher significantly below state average.
Averages for the 2020 tax year for zip code 38315, filed in 2021:
Average Adjusted Gross Income (AGI) in 2020: $43,399 (Individual Income Tax Returns)
Here:
$43,399
State:
$69,014
Salary/wage: $40,533 (reported on 76.8% of returns)
Here:
$40,533
State:
$55,872
(% of AGI for various income ranges: 1079.3% for AGIs below $25k, 3343.7% for AGIs $25k-50k, 6278.8% for AGIs $50k-75k, 8412.2% for AGIs $75k-100k, 14147.8% for AGIs $100k-200k)
Taxable interest for individuals: $738 (reported on 21.2% of returns)
This zip code:
$738
Tennessee:
$1,945
(% of AGI for various income ranges: 14.3% for AGIs below $25k, 7.7% for AGIs $25k-50k, 26.9% for AGIs $50k-75k, 51.1% for AGIs $75k-100k, 60.0% for AGIs $100k-200k)
Ordinary dividends: $1,492 (reported on 8.6% of returns)
Here:
$1,492
State:
$8,105
(% of AGI for various income ranges: 7.6% for AGIs below $25k, 7.4% for AGIs $25k-50k, 56.9% for AGIs $50k-75k, 46.7% for AGIs $100k-200k)
Net capital gain/loss in AGI: +$8,354 (reported on 8.6% of returns)
Here:
+$8,354
State:
+$33,664
(% of AGI for various income ranges: 7.4% for AGIs below $25k, 6.0% for AGIs $25k-50k, 153.8% for AGIs $50k-75k, 872.2% for AGIs $100k-200k)
Profit/loss from business: +$11,446 (reported on 18.5% of returns)
Here:
+$11,446
State:
+$18,991
(% of AGI for various income ranges: 169.6% for AGIs below $25k, 232.0% for AGIs $25k-50k, 468.1% for AGIs $50k-75k, 960.0% for AGIs $100k-200k)
Taxable individual retirement arrangement distribution: $12,218 (reported on 7.3% of returns)
38315:
$12,218
Tennessee:
$20,036
(% of AGI for various income ranges: 50.9% for AGIs below $25k, 140.0% for AGIs $25k-50k, 688.9% for AGIs $75k-100k)
Total itemized deductions: $27,400 (reported on 2.0% of returns)
Here:
$27,400
State:
$40,136
(% of AGI for various income ranges: 513.8% for AGIs $50k-75k)
Charity contributions: $9,800 (reported on 1.3% of returns)
Here:
$9,800
State:
$19,852
(% of AGI for various income ranges: 56.0% for AGIs $25k-50k)
Taxes paid: $2,633 (reported on 2.0% of returns)
38315:
$2,633
State:
$6,038
(% of AGI for various income ranges: 49.4% for AGIs $50k-75k)
Earned income credit: $2,556 (reported on 23.8% of returns)
Here:
$2,556
State:
$2,391
(% of AGI for various income ranges: 133.3% for AGIs below $25k, 87.7% for AGIs $25k-50k)
Percentage of individuals using paid preparers for their 2020 taxes: 95.4%
Here:
95%
State:
93%
(% for various income ranges: 95.2% for AGIs below $25k, 95.3% for AGIs $25k-50k, 95.2% for AGIs $50k-75k, 100.0% for AGIs $75k-100k, 92.9% for AGIs $100k-200k)
Averages for the 2012 tax year for zip code 38315, filed in 2013:
Average Adjusted Gross Income (AGI) in 2012: $35,094 (Individual Income Tax Returns)
Here:
$35,094
State:
$53,767
Salary/wage: $32,971 (reported on 82.2% of returns)
Here:
$32,971
State:
$45,421
(% of AGI for various income ranges: 69.7% for AGIs below $25k, 79.4% for AGIs $25k-50k, 83.9% for AGIs $50k-75k, 75.3% for AGIs $75k-100k, 72.8% for AGIs $100k-200k)
Taxable interest for individuals: $861 (reported on 20.7% of returns)
This zip code:
$861
Tennessee:
$1,732
(% of AGI for various income ranges: 0.8% for AGIs below $25k, 0.7% for AGIs $25k-50k, 0.2% for AGIs $50k-75k, 0.2% for AGIs $75k-100k, 0.6% for AGIs $100k-200k)
Ordinary dividends: $1,560 (reported on 7.4% of returns)
Here:
$1,560
State:
$6,739
(% of AGI for various income ranges: 0.5% for AGIs below $25k, 0.4% for AGIs $25k-50k, 0.2% for AGIs $50k-75k, 0.6% for AGIs $75k-100k)
Net capital gain/loss in AGI: +$3,178 (reported on 6.7% of returns)
Here:
+$3,178
State:
+$19,082
(% of AGI for various income ranges: 0.7% for AGIs $25k-50k, 2.8% for AGIs $75k-100k)
Profit/loss from business: +$8,309 (reported on 17.0% of returns)
Here:
+$8,309
State:
+$15,240
(% of AGI for various income ranges: 10.7% for AGIs below $25k, 4.7% for AGIs $25k-50k, 1.9% for AGIs $50k-75k, 2.2% for AGIs $75k-100k)
Taxable individual retirement arrangement distribution: $8,727 (reported on 8.1% of returns)
38315:
$8,727
Tennessee:
$15,505
(% of AGI for various income ranges: 3.0% for AGIs below $25k, 2.2% for AGIs $25k-50k, 3.4% for AGIs $50k-75k)
Total itemized deductions: $17,980 (28% of AGI, reported on 11.1% of returns)
Here:
$17,980
State:
$21,976
Here:
28.5% of AGI
State:
17.8% of AGI
(% of AGI for various income ranges: 2.8% for AGIs below $25k, 5.0% for AGIs $25k-50k, 5.2% for AGIs $50k-75k, 8.3% for AGIs $75k-100k, 8.8% for AGIs $100k-200k)
Charity contributions: $4,640 (reported on 7.4% of returns)
Here:
$4,640
State:
$6,709
(% of AGI for various income ranges: 1.0% for AGIs $25k-50k, 1.0% for AGIs $50k-75k, 2.9% for AGIs $75k-100k)
Taxes paid: $2,493 (reported on 11.1% of returns)
38315:
$2,493
State:
$4,829
(% of AGI for various income ranges: 0.8% for AGIs $25k-50k, 0.8% for AGIs $50k-75k, 1.1% for AGIs $75k-100k, 1.4% for AGIs $100k-200k)
Earned income credit: $2,470 (reported on 29.6% of returns)
Here:
$2,470
State:
$2,404
(% of AGI for various income ranges: 8.8% for AGIs below $25k, 1.8% for AGIs $25k-50k)
Percentage of individuals using paid preparers for their 2012 taxes: 68.9%
Here:
69%
State:
52%
(% for various income ranges: 65.2% for AGIs below $25k, 74.3% for AGIs $25k-50k, 70.0% for AGIs $50k-75k, 66.7% for AGIs $75k-100k, 80.0% for AGIs $100k-200k)
Averages for the 2004 tax year for zip code 38315, filed in 2005:
Average Adjusted Gross Income (AGI) in 2004: $27,610 (Individual Income Tax Returns)
Here:
$27,610
State:
$44,088
Salary/wage: $27,079 (reported on 83.8% of returns)
Here:
$27,079
State:
$38,825
(% of AGI for various income ranges: 125.4% for AGIs below $10k, 72.8% for AGIs $10k-25k, 86.6% for AGIs $25k-50k, 84.3% for AGIs $50k-75k, 98.5% for AGIs $75k-100k)
Taxable interest for individuals: $1,381 (reported on 24.8% of returns)
This zip code:
$1,381
Tennessee:
$1,802
(% of AGI for various income ranges: 4.4% for AGIs below $10k, 1.9% for AGIs $10k-25k, 1.1% for AGIs $25k-50k, 1.0% for AGIs $50k-75k, 0.7% for AGIs $75k-100k)
Taxable dividends: $972 (reported on 10.3% of returns)
Here:
$972
State:
$3,727
(% of AGI for various income ranges: 2.8% for AGIs below $10k, 0.3% for AGIs $10k-25k, 0.2% for AGIs $25k-50k, 0.5% for AGIs $50k-75k, 0.4% for AGIs $75k-100k)
Net capital gain/loss: +$2,458 (reported on 8.7% of returns)
Here:
+$2,458
State:
+$15,776
(% of AGI for various income ranges: -3.1% for AGIs below $10k, 0.8% for AGIs $10k-25k, 0.6% for AGIs $25k-50k, 1.2% for AGIs $50k-75k, 1.2% for AGIs $75k-100k)
Profit/loss from business: +$5,783 (reported on 20.3% of returns)
Here:
+$5,783
State:
+$12,882
(% of AGI for various income ranges: -0.1% for AGIs below $10k, 11.3% for AGIs $10k-25k, 2.5% for AGIs $25k-50k, 3.6% for AGIs $50k-75k)
IRA payment deduction: $2,423 (reported on 1.9% of returns)
38315:
$2,423
Tennessee:
$2,934
Total itemized deductions: $16,056 (31% of AGI, reported on 10.4% of returns)
Here:
$16,056
State:
$18,035
Here:
31.3% of AGI
State:
19.9% of AGI
(% of AGI for various income ranges: 4.1% for AGIs $10k-25k, 5.1% for AGIs $25k-50k, 6.9% for AGIs $50k-75k, 15.0% for AGIs $75k-100k)
Charity contributions deductions: $3,703 (7% of AGI, reported on 8.0% of returns)
Here:
$3,703
State:
$5,167
Here:
7.0% of AGI
State:
5.3% of AGI
(% of AGI for various income ranges: 0.5% for AGIs $10k-25k, 0.8% for AGIs $25k-50k, 1.6% for AGIs $50k-75k, 2.5% for AGIs $75k-100k)
Total tax: $2,745 (reported on 70.1% of returns)
38315:
$2,745
State:
$7,482
(% of AGI for various income ranges: 6.3% for AGIs below $10k, 4.2% for AGIs $10k-25k, 6.0% for AGIs $25k-50k, 8.4% for AGIs $50k-75k, 9.7% for AGIs $75k-100k, 15.2% for AGIs over 100k)
Earned income credit: $1,856 (reported on 29.0% of returns)
Here:
$1,856
State:
$1,826
Percentage of individuals using paid preparers for their 2004 taxes: 74.1%
Here:
74%
State:
60%
(% for various income ranges: 70.5% for AGIs below $10k, 75.8% for AGIs $10k-25k, 74.0% for AGIs $25k-50k, 76.7% for AGIs $50k-75k, 90.7% for AGIs $75k-100k)
Household received Food Stamps/SNAP in the past 12 months: 238 Household did not receive Food Stamps/SNAP in the past 12 months: 1,316
Women who had a birth in the past 12 months: 45 (33 now married, 12 unmarried) Women who did not have a birth in the past 12 months: 862 (373 now married, 488 unmarried)
Housing units in zip code 38315 with a mortgage: 458 (4 second mortgage, 4 both second mortgage and home equity loan) Median monthly owner costs for units with a mortgage: $1,157 Median monthly owner costs for units without a mortgage: $430
Residents with income below the poverty level in 2022:
This zip code:
18.4%
Whole state:
13.3%
Residents with income below 50% of the poverty level in 2022:
This zip code:
11.4%
Whole state:
7.1%
Median number of rooms in houses and condos:
Here:
6.0
State:
6.5
Median number of rooms in apartments:
Here:
4.7
State:
4.4
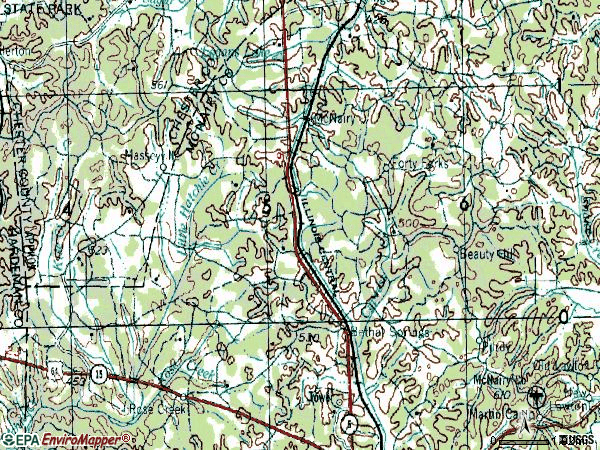
Notable locations in this zip code not listed on our city pages
Notable locations in zip code 38315: Chester County Fire Department / Masseyville Volunteer Fire Department Station 550 (A), McNairy County Fire Department Station 13 Beauty Hill Fire Department (B), McNairy County Fire Department Station 11 McNairy Fire Department (C), McNairy County Fire Department Station 43 Rose Creek Fire Department (D), Bethel Springs Fire Department (E). Display/hide their locations on the map
Churches in zip code 38315 include: Little Hatchie Church (A), Liberty Church (B), Refuge Church (C), Rose Hill Church (D), Bethel Springs First Baptist Church (E), Forty Forks Baptist Church (F), Pleasant Hill Church (G), Sandy Flat Church (H), Beauty Hill Church (I). Display/hide their locations on the map
Cemeteries: Alexander Cemetery (1), Baucum Cemetery (2), Little Hatchie Cemetery (3), Beaty Cemetery (4), Chapel Hill Cemetery (5), Blakeley Cemetery (6), Hendrix Cemetery (7). Display/hide their locations on the map
Streams, rivers, and creeks: Larue Branch (A), Kise Creek (B), King Branch (C), Hodger Branch (D), Hendrix Branch (E), Hamestring Creek (F), Swaim Creek (G), Brown Branch (H), Sheffield Branch (I). Display/hide their locations on the map
Size of family households: 464 2-persons, 209 3-persons, 301 4-persons, 51 5-persons, 21 6-persons, 17 7-or-more-persons
Size of nonfamily households: 454 1-person, 32 2-persons
683 married couples with children.
209 single-parent households (141 men, 68 women).
95.0% of residents of 38315 zip code speak English at home.
4.7% of residents speak Spanish at home (74% very well, 13% well, 13% not well).
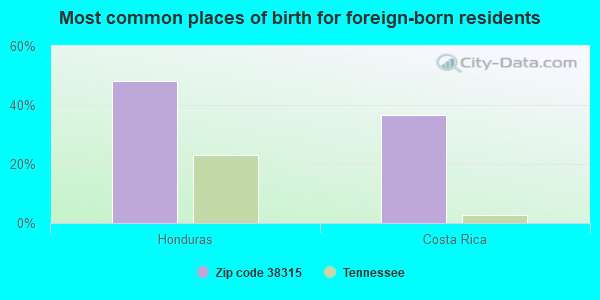
Foreign born population: 51 (1.2%) (71.7% of them are naturalized citizens)
This zip code:
1.2%
Whole state:
5.6%
48%Honduras
37%Costa Rica
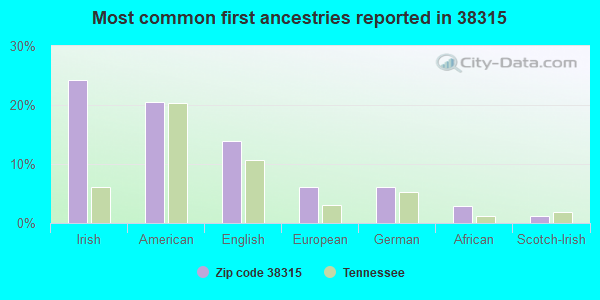
24%Irish
21%American
14%English
6%European
6%German
3%African
1%Scotch-Irish
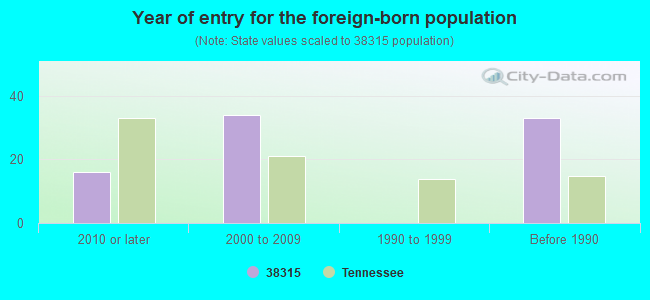
Year of entry for the foreign-born population
162010 or later
342000 to 2009
01990 to 1999
33Before 1990
Facilities with environmental interests located in this zip code:
CITY OF BETHEL SPRINGS (4815 MAIN STREET in BETHEL SPRINGS, TN)
National Pollutant Discharge Elimination System NON-MAJOR (Tracking pollutant discharge elimination systems) - permit Organizations: CITY OF BETHEL SPRINGS STP (CONTACT/OWNER)
Alternative names: BETHEL SPRINGS STP
Housing units lacking complete plumbing facilities: 0.5% Housing units lacking complete kitchen facilities: 0.6%
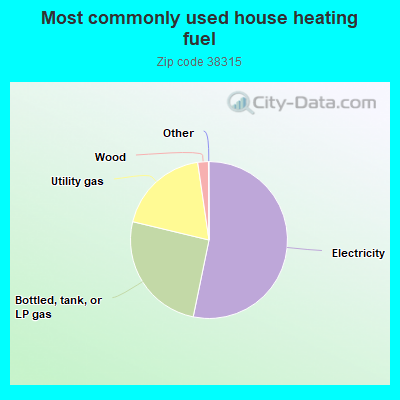
53.4%Electricity
25.6%Bottled, tank, or LP gas
19.0%Utility gas
2.2%Wood
Population in 1990: 2,457. Population change in the 1990s: +1,284 (+52.3%).
Place of birth for U.S.-born residents:
This state: 2,922
Northeast: 106
Midwest: 200
South: 666
West: 159
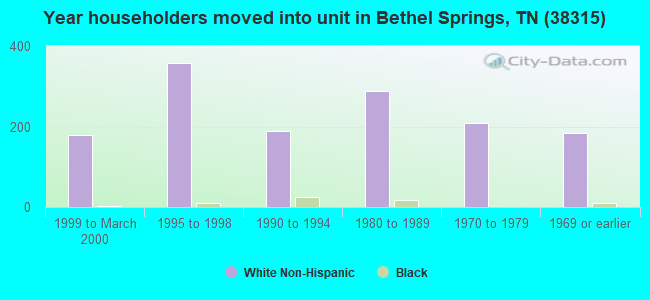
62% of the 38315 zip code residents lived in the same house 5 years ago. Out of people who lived in different houses, 59% lived in this county. Out of people who lived in different counties, 50% lived in Tennessee.
97% of the 38315 zip code residents lived in the same house 1 year ago. Out of people who lived in different houses, 17% moved from this county. Out of people who lived in different houses, 72% moved from different county within same state. Out of people who lived in different houses, 27% moved from different state.
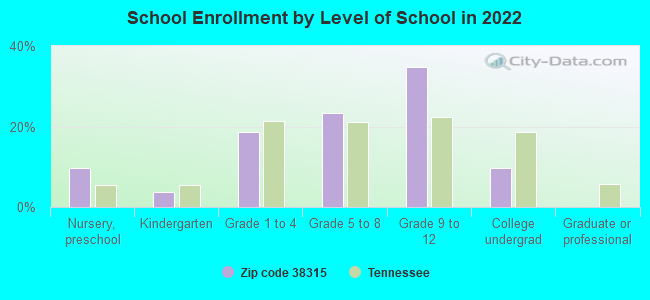
Private vs. public school enrollment:
Students in private schools in grades 1 to 8 (elementary and middle school): 21
Here:
5.8%
Tennessee:
15.0%
Students in private schools in grades 9 to 12 (high school): 98
Here:
31.1%
Tennessee:
16.2%
Students in private undergraduate colleges: 63
Here:
74.2%
Tennessee:
23.5%
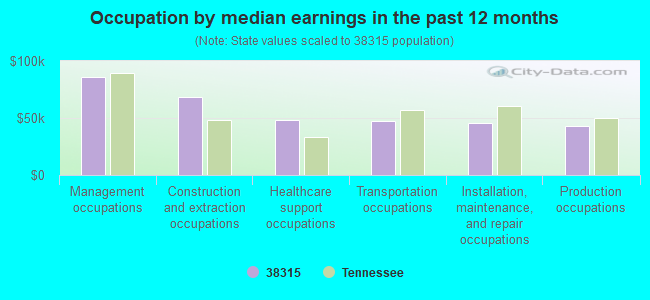
Occupation by median earnings in the past 12 months ($)
85,835Management occupations
68,797Construction and extraction occupations
47,898Healthcare support occupations
47,572Transportation occupations
45,298Installation, maintenance, and repair occupations
42,828Production occupations
Top industries in this zip code by the number of employees in 2005:
Administrative and Support and Waste Management and Remediation Services: All Other Support Services (20-49 employees: 1 establishment)
Professional, Scientific, and Technical Services: Veterinary Services (10-19: 1)
Other Services (except Public Administration): Religious Organizations (5-9: 1, 1-4: 2)
Administrative and Support and Waste Management and Remediation Services: Packaging and Labeling Services (5-9: 1)
Construction: Plumbing, Heating, and Air-Conditioning Contractors (1-4: 3)
Finance and Insurance: Commercial Banking (1-4: 2)
Fatal accident statistics in 2013:
Fatal accident count: 2
Vehicles involved in fatal accidents: 4
Fatal accidents caused by drunken drivers: 0
Fatalities: 2
Persons involved in fatal accidents: 8
Pedestrians involved in fatal accidents: 0
Fatal accident statistics in 2012:
Fatal accident count: 2
Vehicles involved in fatal accidents: 2
Fatal accidents caused by drunken drivers: 1
Fatalities: 2
Persons involved in fatal accidents: 2
Pedestrians involved in fatal accidents: 0
2002 - 2018 National Fire Incident Reporting System (NFIRS) incidents
Based on the data from the years 2002 - 2018 the average number of fires per year is 17. The highest number of reported fires - 29 took place in 2016, and the least - 2 in 2002. The data has a growing trend.
When looking into fire subcategories, the most incidents belonged to: Structure Fires (47.5%), and Outside Fires (36.5%).
Fire incident types reported to NFIRS in Zip Code 38315


 Nearest zip codes: 38334, 38375, 38340, 38044, 38310, 38379.


 Based on the data from the years 2002 - 2018 the average number of fires per year is 17. The highest number of reported fires - 29 took place in 2016, and the least - 2 in 2002. The data has a growing trend.
 When looking into fire subcategories, the most incidents belonged to: Structure Fires (47.5%), and Outside Fires (36.5%).