Estimated zip code population in 2022: 10,971 Zip code population in 2010: 10,686 Zip code population in 2000: 10,842
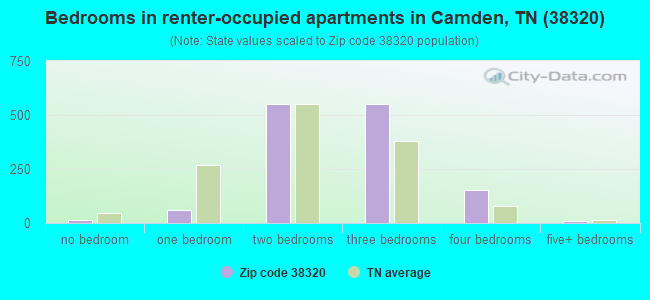
Houses and condos: 5,280 Renter-occupied apartments: 1,345
% of renters here:
29%
State:
33%
March 2022 cost of living index in zip code 38320: 78.8 (low, U.S. average is 100)
Land area: 147.6 sq. mi. Water area: 5.3 sq. mi.
Population density: 74 people per square mile
(very low).
OSM Map
General Map
Google Map
MSN Map
OSM Map
General Map
Google Map
MSN Map
OSM Map
General Map
Google Map
MSN Map
OSM Map
General Map
Google Map
MSN Map
Please wait while loading the map...
Real estate property taxes paid for housing units in 2022:
This zip code:
0.5% ($722)
Tennessee:
0.5% ($1,376)
Median real estate property taxes paid for housing units with mortgages in 2022: $785 (0.4%) Median real estate property taxes paid for housing units with no mortgage in 2022: $663 (0.6%)
Business Search- 14 Million verified businesses
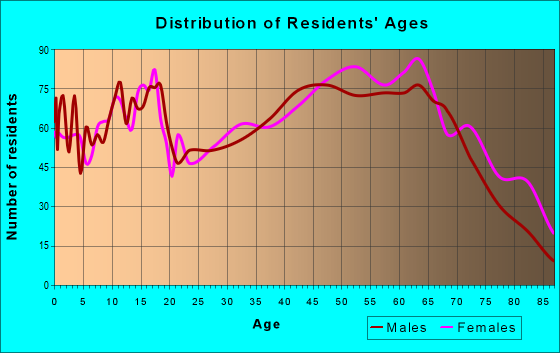
Males: 5,407
(49.3%)
Females: 5,564
(50.7%)
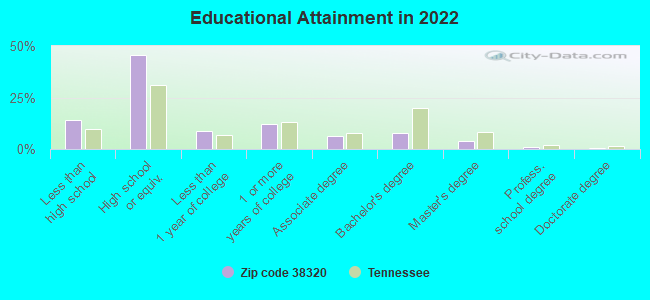
For population 25 years and over in 38320:
High school or higher: 84.0%
Bachelor's degree or higher: 12.8%
Graduate or professional degree: 5.3%
Unemployed: 3.1%
Mean travel time to work (commute): 22.7 minutes
For population 15 years and over in 38320:
Never married: 24.7%
Now married: 48.8%
Separated: 2.8%
Widowed: 9.1%
Divorced: 14.6%
Zip code 38320 compared to state average:
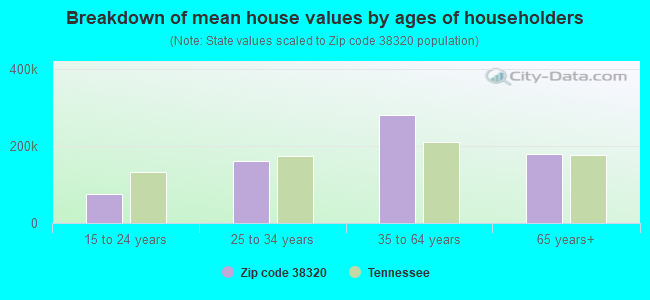
Median house value below state average.
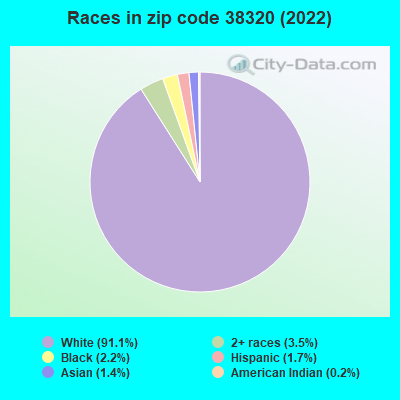
Black race population percentage significantly below state average.
Hispanic race population percentage significantly below state average.
Median age above state average.
Foreign-born population percentage significantly below state average.
Length of stay since moving in significantly above state average.
Number of college students below state average.
Percentage of population with a bachelor's degree or higher significantly below state average.
Averages for the 2020 tax year for zip code 38320, filed in 2021:
Average Adjusted Gross Income (AGI) in 2020: $48,262 (Individual Income Tax Returns)
Here:
$48,262
State:
$69,014
Salary/wage: $42,094 (reported on 79.0% of returns)
Here:
$42,094
State:
$55,872
(% of AGI for various income ranges: 1103.3% for AGIs below $25k, 3455.4% for AGIs $25k-50k, 5934.3% for AGIs $50k-75k, 9008.0% for AGIs $75k-100k, 14134.1% for AGIs $100k-200k)
Taxable interest for individuals: $1,345 (reported on 30.4% of returns)
This zip code:
$1,345
Tennessee:
$1,945
(% of AGI for various income ranges: 17.2% for AGIs below $25k, 25.9% for AGIs $25k-50k, 58.2% for AGIs $50k-75k, 58.3% for AGIs $75k-100k, 233.3% for AGIs $100k-200k)
Ordinary dividends: $3,967 (reported on 11.8% of returns)
Here:
$3,967
State:
$8,105
(% of AGI for various income ranges: 12.9% for AGIs below $25k, 20.3% for AGIs $25k-50k, 40.4% for AGIs $50k-75k, 95.3% for AGIs $75k-100k, 236.3% for AGIs $100k-200k)
Net capital gain/loss in AGI: +$8,569 (reported on 10.9% of returns)
Here:
+$8,569
State:
+$33,664
(% of AGI for various income ranges: 6.7% for AGIs below $25k, 25.2% for AGIs $25k-50k, 94.3% for AGIs $50k-75k, 143.7% for AGIs $75k-100k, 430.0% for AGIs $100k-200k)
Profit/loss from business: +$10,554 (reported on 14.3% of returns)
Here:
+$10,554
State:
+$18,991
(% of AGI for various income ranges: 82.4% for AGIs below $25k, 131.9% for AGIs $25k-50k, 215.3% for AGIs $50k-75k, 42.7% for AGIs $75k-100k, 586.3% for AGIs $100k-200k)
Taxable individual retirement arrangement distribution: $13,203 (reported on 7.3% of returns)
38320:
$13,203
Tennessee:
$20,036
(% of AGI for various income ranges: 40.1% for AGIs below $25k, 73.1% for AGIs $25k-50k, 160.6% for AGIs $50k-75k, 202.7% for AGIs $75k-100k, 657.0% for AGIs $100k-200k)
Total itemized deductions: $29,469 (reported on 2.8% of returns)
Here:
$29,469
State:
$40,136
(% of AGI for various income ranges: 101.9% for AGIs $25k-50k, 227.3% for AGIs $50k-75k, 628.9% for AGIs $100k-200k)
Charity contributions: $11,878 (reported on 1.9% of returns)
Here:
$11,878
State:
$19,852
(% of AGI for various income ranges: 10.1% for AGIs below $25k, 40.0% for AGIs $50k-75k, 268.5% for AGIs $100k-200k)
Taxes paid: $3,854 (reported on 2.8% of returns)
38320:
$3,854
State:
$6,038
(% of AGI for various income ranges: 11.6% for AGIs $25k-50k, 21.2% for AGIs $50k-75k, 104.1% for AGIs $100k-200k)
Earned income credit: $2,315 (reported on 23.8% of returns)
Here:
$2,315
State:
$2,391
(% of AGI for various income ranges: 123.2% for AGIs below $25k, 75.9% for AGIs $25k-50k)
Percentage of individuals using paid preparers for their 2020 taxes: 95.5%
Here:
96%
State:
93%
(% for various income ranges: 94.7% for AGIs below $25k, 96.8% for AGIs $25k-50k, 93.9% for AGIs $50k-75k, 97.6% for AGIs $75k-100k, 95.0% for AGIs $100k-200k, 100.0% for AGIs over 200k)
Averages for the 2012 tax year for zip code 38320, filed in 2013:
Average Adjusted Gross Income (AGI) in 2012: $40,403 (Individual Income Tax Returns)
Here:
$40,403
State:
$53,767
Salary/wage: $35,915 (reported on 81.0% of returns)
Here:
$35,915
State:
$45,421
(% of AGI for various income ranges: 72.3% for AGIs below $25k, 76.7% for AGIs $25k-50k, 72.4% for AGIs $50k-75k, 76.6% for AGIs $75k-100k, 76.1% for AGIs $100k-200k, 48.0% for AGIs over 200k)
Taxable interest for individuals: $1,708 (reported on 31.5% of returns)
This zip code:
$1,708
Tennessee:
$1,732
(% of AGI for various income ranges: 1.4% for AGIs below $25k, 1.3% for AGIs $25k-50k, 1.2% for AGIs $50k-75k, 0.8% for AGIs $75k-100k, 1.1% for AGIs $100k-200k, 2.5% for AGIs over 200k)
Ordinary dividends: $3,488 (reported on 11.3% of returns)
Here:
$3,488
State:
$6,739
(% of AGI for various income ranges: 0.6% for AGIs below $25k, 0.8% for AGIs $25k-50k, 0.8% for AGIs $50k-75k, 0.7% for AGIs $75k-100k, 1.2% for AGIs $100k-200k, 2.0% for AGIs over 200k)
Net capital gain/loss in AGI: +$4,114 (reported on 9.5% of returns)
Here:
+$4,114
State:
+$19,082
(% of AGI for various income ranges: 0.4% for AGIs $25k-50k, 0.6% for AGIs $50k-75k, 1.1% for AGIs $75k-100k, 0.7% for AGIs $100k-200k, 4.3% for AGIs over 200k)
Profit/loss from business: +$10,996 (reported on 16.1% of returns)
Here:
+$10,996
State:
+$15,240
(% of AGI for various income ranges: 9.1% for AGIs below $25k, 1.8% for AGIs $25k-50k, 1.5% for AGIs $50k-75k, 1.4% for AGIs $75k-100k, 11.0% for AGIs $100k-200k)
Taxable individual retirement arrangement distribution: $10,103 (reported on 8.4% of returns)
38320:
$10,103
Tennessee:
$15,505
(% of AGI for various income ranges: 1.8% for AGIs below $25k, 1.8% for AGIs $25k-50k, 2.3% for AGIs $50k-75k, 2.1% for AGIs $75k-100k, 3.6% for AGIs $100k-200k)
Total itemized deductions: $19,587 (21% of AGI, reported on 14.1% of returns)
Here:
$19,587
State:
$21,976
Here:
21.4% of AGI
State:
17.8% of AGI
(% of AGI for various income ranges: 3.8% for AGIs below $25k, 6.2% for AGIs $25k-50k, 7.0% for AGIs $50k-75k, 7.2% for AGIs $75k-100k, 9.1% for AGIs $100k-200k, 7.3% for AGIs over 200k)
Charity contributions: $5,895 (reported on 9.8% of returns)
Here:
$5,895
State:
$6,709
(% of AGI for various income ranges: 0.4% for AGIs below $25k, 0.7% for AGIs $25k-50k, 1.4% for AGIs $50k-75k, 1.5% for AGIs $75k-100k, 2.8% for AGIs $100k-200k, 1.8% for AGIs over 200k)
Taxes paid: $3,505 (reported on 13.6% of returns)
38320:
$3,505
State:
$4,829
(% of AGI for various income ranges: 0.4% for AGIs below $25k, 0.8% for AGIs $25k-50k, 1.1% for AGIs $50k-75k, 1.3% for AGIs $75k-100k, 1.8% for AGIs $100k-200k, 1.9% for AGIs over 200k)
Earned income credit: $2,388 (reported on 28.1% of returns)
Here:
$2,388
State:
$2,404
(% of AGI for various income ranges: 9.0% for AGIs below $25k, 1.4% for AGIs $25k-50k)
Percentage of individuals using paid preparers for their 2012 taxes: 64.6%
Here:
65%
State:
52%
(% for various income ranges: 60.6% for AGIs below $25k, 64.8% for AGIs $25k-50k, 70.4% for AGIs $50k-75k, 70.0% for AGIs $75k-100k, 75.0% for AGIs $100k-200k, 80.0% for AGIs over 200k)
Averages for the 2004 tax year for zip code 38320, filed in 2005:
Average Adjusted Gross Income (AGI) in 2004: $31,564 (Individual Income Tax Returns)
Here:
$31,564
State:
$44,088
Salary/wage: $29,597 (reported on 82.3% of returns)
Here:
$29,597
State:
$38,825
(% of AGI for various income ranges: 138.7% for AGIs below $10k, 75.9% for AGIs $10k-25k, 80.5% for AGIs $25k-50k, 83.8% for AGIs $50k-75k, 80.6% for AGIs $75k-100k, 50.7% for AGIs over 100k)
Taxable interest for individuals: $1,654 (reported on 39.3% of returns)
This zip code:
$1,654
Tennessee:
$1,802
(% of AGI for various income ranges: 7.0% for AGIs below $10k, 2.3% for AGIs $10k-25k, 1.9% for AGIs $25k-50k, 1.5% for AGIs $50k-75k, 1.7% for AGIs $75k-100k, 2.6% for AGIs over 100k)
Taxable dividends: $1,825 (reported on 15.0% of returns)
Here:
$1,825
State:
$3,727
(% of AGI for various income ranges: 2.1% for AGIs below $10k, 0.9% for AGIs $10k-25k, 0.5% for AGIs $25k-50k, 0.5% for AGIs $50k-75k, 0.6% for AGIs $75k-100k, 2.1% for AGIs over 100k)
Net capital gain/loss: +$5,178 (reported on 11.0% of returns)
Here:
+$5,178
State:
+$15,776
(% of AGI for various income ranges: -0.7% for AGIs below $10k, 0.8% for AGIs $10k-25k, 0.6% for AGIs $25k-50k, 0.8% for AGIs $50k-75k, 1.6% for AGIs $75k-100k, 7.0% for AGIs over 100k)
Profit/loss from business: +$6,811 (reported on 18.4% of returns)
Here:
+$6,811
State:
+$12,882
(% of AGI for various income ranges: 6.8% for AGIs below $10k, 5.4% for AGIs $10k-25k, 1.5% for AGIs $25k-50k, 1.9% for AGIs $50k-75k, 3.4% for AGIs $75k-100k, 10.1% for AGIs over 100k)
IRA payment deduction: $2,580 (reported on 2.7% of returns)
38320:
$2,580
Tennessee:
$2,934
(% of AGI for various income ranges: 0.2% for AGIs $10k-25k, 0.2% for AGIs $25k-50k, 0.3% for AGIs $50k-75k, 0.1% for AGIs $75k-100k, 0.2% for AGIs over 100k)
Self-employed pension: $15,909 (reported on 0.2% of returns)
Here:
$15,909
Tennessee:
$16,857
Total itemized deductions: $16,624 (25% of AGI, reported on 15.2% of returns)
Here:
$16,624
State:
$18,035
Here:
25.3% of AGI
State:
19.9% of AGI
(% of AGI for various income ranges: 9.1% for AGIs below $10k, 6.2% for AGIs $10k-25k, 7.5% for AGIs $25k-50k, 9.0% for AGIs $50k-75k, 8.6% for AGIs $75k-100k, 8.5% for AGIs over 100k)
Charity contributions deductions: $4,151 (6% of AGI, reported on 12.5% of returns)
Here:
$4,151
State:
$5,167
Here:
5.9% of AGI
State:
5.3% of AGI
(% of AGI for various income ranges: 0.3% for AGIs below $10k, 0.7% for AGIs $10k-25k, 1.0% for AGIs $25k-50k, 1.4% for AGIs $50k-75k, 2.7% for AGIs $75k-100k, 3.5% for AGIs over 100k)
Total tax: $4,178 (reported on 68.3% of returns)
38320:
$4,178
State:
$7,482
(% of AGI for various income ranges: 5.1% for AGIs below $10k, 3.5% for AGIs $10k-25k, 6.0% for AGIs $25k-50k, 9.0% for AGIs $50k-75k, 10.8% for AGIs $75k-100k, 19.2% for AGIs over 100k)
Earned income credit: $1,744 (reported on 25.5% of returns)
Here:
$1,744
State:
$1,826
Percentage of individuals using paid preparers for their 2004 taxes: 70.1%
Here:
70%
State:
60%
(% for various income ranges: 65.4% for AGIs below $10k, 70.3% for AGIs $10k-25k, 72.5% for AGIs $25k-50k, 74.0% for AGIs $50k-75k, 70.7% for AGIs $75k-100k, 67.2% for AGIs over 100k)
Likely homosexual households (counted as self-reported same-sex unmarried-partner households)
Lesbian couples: 0.2% of all households
Gay men: 0.0% of all households
Household received Food Stamps/SNAP in the past 12 months: 714 Household did not receive Food Stamps/SNAP in the past 12 months: 3,889
Women who had a birth in the past 12 months: 132 (24 now married, 104 unmarried) Women who did not have a birth in the past 12 months: 2,196 (1,071 now married, 1,125 unmarried)
Housing units in zip code 38320 with a mortgage: 1,294 (102 second mortgage, 89 both second mortgage and home equity loan) Houses without a mortgage: 28
Median monthly owner costs for units with a mortgage: $1,106 Median monthly owner costs for units without a mortgage: $420
Residents with income below the poverty level in 2022:
This zip code:
14.7%
Whole state:
13.3%
Residents with income below 50% of the poverty level in 2022:
This zip code:
10.1%
Whole state:
7.1%
Median number of rooms in houses and condos:
Here:
6.0
State:
6.5
Median number of rooms in apartments:
Here:
5.1
State:
4.4
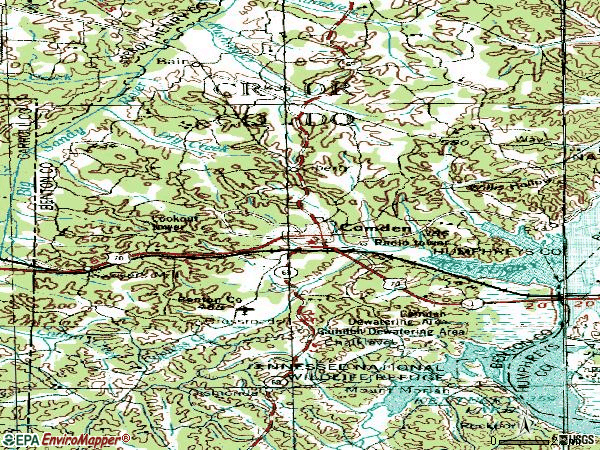
Notable locations in this zip code not listed on our city pages
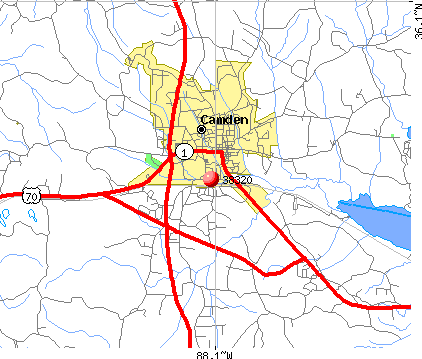
Notable locations in zip code 38320: Way (A), Birdsong Drive-In (B), Rushing Creek Community Center (C), West Camden Sanitary Landfill (D), Camden Dewatering Area (E), West Tennessee Boy Scout Camp (F), Young Farmers and Homemakers Camp (G), Lake View Camp (H), Benton County Fairgrounds (I), Birdsong Dock and Resort (J), Beaverdam Creek Cabin Area (K), Morris Chapel Volunteer Fire Department (L), Sandy River Volunteer Fire Department (M), Chalk Level Volunteer Fire Department Station 1 (N), Chalk Level Volunteer Fire Department Station 2 (O), Camden Fire Department (P), Benton County Rescue Squad (Q), Center Hill Community Center (R), Camden City Hall (S), Benton County Courthouse (T). Display/hide their locations on the map
Churches in zip code 38320 include: Flatwoods Church (A), Liberty Methodist Church (B), Rushing Church (C), Rushings Creek Baptist Church (D), Cowells Chapel (E), Williams Grove Church (F), Beaverdam Church (G), Bethel Church (H), Chalk Hill Baptist Church (I). Display/hide their locations on the map
Cemeteries: Hudson Cemetery (1), Jordan Cemetery (2), Weatherly Cemetery (3), Lashlee Cemetery (4), Wyly Cemetery (5), Arhold Cemetery (6), Arnold Cemetery (7). Display/hide their locations on the map
Reservoirs: Butterworth Lake (A), Blackburn Lake (B), Cole Lake (C), Hardy Sand Company Lake (D), C H Sullins Lake (E), Cedar Lake Number Two (F), Cedar Lake Number One (G). Display/hide their locations on the map
Streams, rivers, and creeks: Badger Creek (A), Jepp Branch (B), Hollingsworth Branch (C), Hawley Creek (D), Umstead Branch (E), Fourmile Slough (F), Evans Branch (G), Middle Brook (H), Ford Creek (I). Display/hide their locations on the map
In group quarters: 183 (-1 institutionalized population)
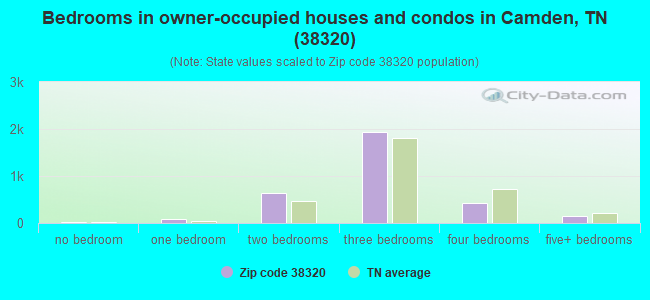
Size of family households: 1,439 2-persons, 628 3-persons, 638 4-persons, 189 5-persons, 34 6-persons, 14 7-or-more-persons
Size of nonfamily households: 1,429 1-person, 194 2-persons, 34 3-persons
1,310 married couples with children.
515 single-parent households (236 men, 279 women).
99.0% of residents of 38320 zip code speak English at home.
0.3% of residents speak Spanish at home (100% very well).
0.3% of residents speak other Indo-European language at home (80% very well, 20% well).
0.2% of residents speak Asian or Pacific Island language at home (100% very well).
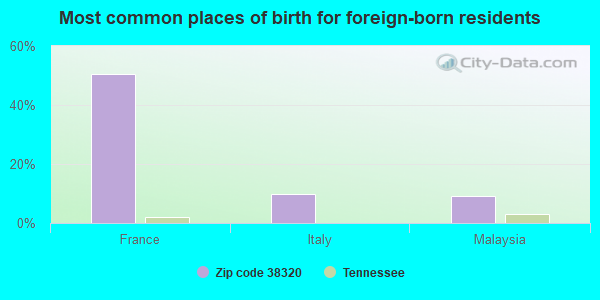
Foreign born population: 240 (2.2%) (95.6% of them are naturalized citizens)
This zip code:
2.2%
Whole state:
5.6%
50%France
10%Italy
9%Malaysia
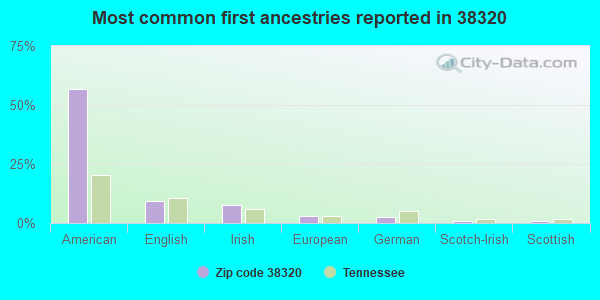
57%American
9%English
8%Irish
3%European
3%German
1%Scotch-Irish
1%Scottish
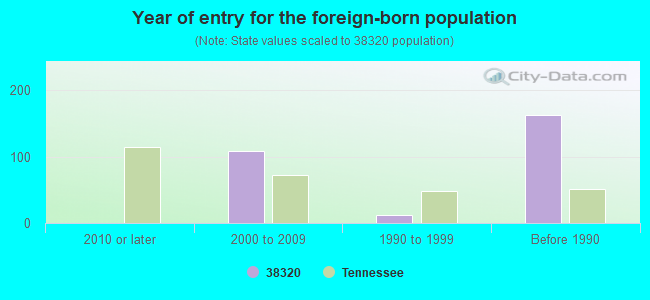
Year of entry for the foreign-born population
02010 or later
1092000 to 2009
121990 to 1999
163Before 1990
Major facilities with environmental interests located in this zip code:
CAMDEN ELEMENTARY SCHOOL (208 WASHINGTON AV in CAMDEN, TN)
(Geographic Names Information System) (National Center for Education Statistics) - STATE ID-0020 Organizations: BENTON COUNTY SCHOOL DISTRICT (SCHOOL DISTRICT)
BRIARWOOD SCHOOL (169 BRIARWOOD ST in CAMDEN, TN)
(National Center for Education Statistics) - STATE ID-0015 Organizations: BENTON COUNTY SCHOOL DISTRICT (SCHOOL DISTRICT)
CAMDEN CENTRAL HIGH (115 SCHOOLS DR in CAMDEN, TN)
(National Center for Education Statistics) - STATE ID-0025 Organizations: BENTON COUNTY SCHOOL DISTRICT (SCHOOL DISTRICT)
CAMDEN CLEANERS (195 EAST COURT SQUARE in CAMDEN, TN)
AIR MINOR (AIRS/AFS) (Resource Conservation and Recovery Act (tracking hazardous waste)) Business SIC classification: COIN-OPERATED LAUNDRIES AND DRYCLEANING Organizations: GARY PATTON (CONTACT/OPERATOR)
Alternative names: CAMDEN DRY CLEANERS
CAMDEN JR HIGH (75 SCHOOLS DR in CAMDEN, TN)
(National Center for Education Statistics) - STATE ID-0027 Organizations: BENTON COUNTY SCHOOL DISTRICT (SCHOOL DISTRICT)
AIR MAJOR (AIRS/AFS) CRITERIA AND HAZARDOUS AIR POLLUTANT INVENTORY (Inventory of air pollution sources) (Resource Conservation and Recovery Act (tracking hazardous waste)) TRI REPORTER (Tracking of toxic chemicals releasing facilities) Business SIC classification: GRAY AND DUCTILE IRON FOUNDRIES Business NAICS classification: IRON FOUNDRIES. Alternative names: CITATION CAMDEN CASTING CENTER
CAMDEN CASTING CENTER INC (245 FOUNDRY LANE CAMDEN in CAMDEN, TN)
(Resource Conservation and Recovery Act (tracking hazardous waste)) Business NAICS classification: IRON FOUNDRIES. Organizations: PHILLIP GRAY (CONTACT/OPERATOR)
, CITATION CORPORATION (CONTACT/OWNER)
CAMDEN GRAVEL COMPANY (CARROLL SITE in CAMDEN, TN)
National Pollutant Discharge Elimination System NON-MAJOR (Tracking pollutant discharge elimination systems) - permit Business SIC classification: CONSTRUCTION SAND AND GRAVEL Alternative names: CARROLL COUNTY HWY. DEPT., RICKY SCOTT
CAMDEN GRAVEL COMPANY (CAMDEN GRAVEL #3 in CAMDEN, TN)
National Pollutant Discharge Elimination System NON-MAJOR (Tracking pollutant discharge elimination systems) - permit Business SIC classification: CONSTRUCTION SAND AND GRAVEL
CAMDEN GRAVEL COMPANY (CAMDEN PIT 2 in CAMDEN, TN)
National Pollutant Discharge Elimination System NON-MAJOR (Tracking pollutant discharge elimination systems) - permit Business SIC classification: CONSTRUCTION SAND AND GRAVEL Organizations: FORD CONSTRUCTION COMPANY (CONTACT/OWNER)
Alternative names: CAMDEN GRAVEL/FORD CONSTR. CO.
CAMDEN GRAVEL COMPANY (CAMDEN PIT in CAMDEN, TN)
National Pollutant Discharge Elimination System NON-MAJOR (Tracking pollutant discharge elimination systems) - permit Business SIC classification: CONSTRUCTION SAND AND GRAVEL Organizations: FORD CONSTRUCTION COMPANY (CONTACT/OWNER)
Alternative names: CAMDEN GRAVEL COMPANY C/O FORD
CAMDEN HCR LAGOON (POST OFFICE BOX 779 in CAMDEN, TN)
National Pollutant Discharge Elimination System NON-MAJOR (Tracking pollutant discharge elimination systems) - permit Business SIC classification: SEWERAGE SYSTEMS Organizations: WENDEL OGLESBY (CONTACT/OWNER)
CAMDEN WATER TREATMENT PLANT (P.O. BOX 779 in CAMDEN, TN)
National Pollutant Discharge Elimination System NON-MAJOR (Tracking pollutant discharge elimination systems) - permit Business SIC classification: WATER SUPPLY Organizations: JERRY PARISH (CONTACT/OWNER)
Alternative names: CAMDEN WATER TREAT PLT CAMDEN
Housing units lacking complete plumbing facilities: 1.8% Housing units lacking complete kitchen facilities: 5.0%
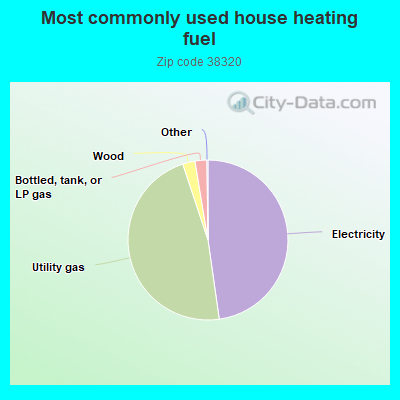
47.8%Electricity
47.2%Utility gas
2.5%Wood
2.4%Bottled, tank, or LP gas
Population in 1990: 8,922. Population change in the 1990s: +1,920 (+21.5%).
Place of birth for U.S.-born residents:
This state: 7,188
Northeast: 208
Midwest: 1,419
South: 1,474
West: 289
64% of the 38320 zip code residents lived in the same house 5 years ago. Out of people who lived in different houses, 56% lived in this county. Out of people who lived in different counties, 50% lived in Tennessee.
92% of the 38320 zip code residents lived in the same house 1 year ago. Out of people who lived in different houses, 58% moved from this county. Out of people who lived in different houses, 32% moved from different county within same state. Out of people who lived in different houses, 9% moved from different state.
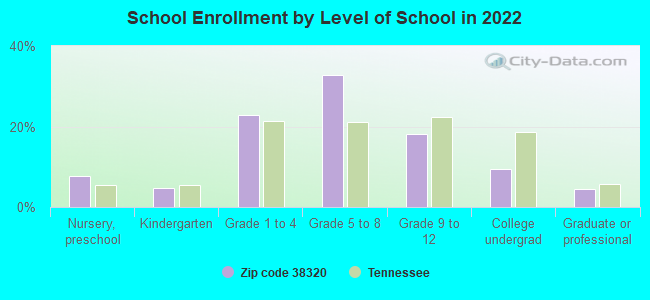
Private vs. public school enrollment:
Students in private schools in grades 1 to 8 (elementary and middle school): 159
Here:
13.6%
Tennessee:
15.0%
Students in private schools in grades 9 to 12 (high school): 6
Here:
1.8%
Tennessee:
16.2%
Students in private undergraduate colleges: 38
Here:
19.6%
Tennessee:
23.5%
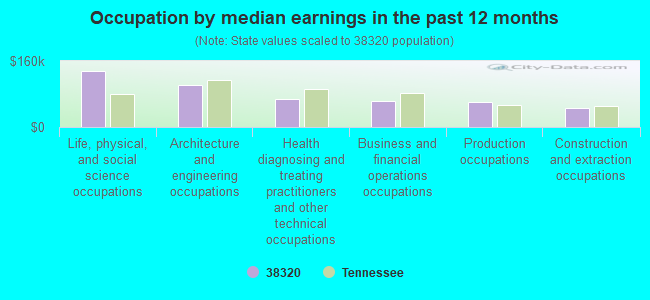
Occupation by median earnings in the past 12 months ($)
136,715Life, physical, and social science occupations
101,686Architecture and engineering occupations
67,317Health diagnosing and treating practitioners and other technical occupations
63,283Business and financial operations occupations
59,604Production occupations
46,180Construction and extraction occupations
Top industries in this zip code by the number of employees in 2005:
Health Care and Social Assistance: Home Health Care Services (50-99: 1, 20-49: 1, 1-4: 1)
People in group quarters in 2010:
84 people in nursing facilities/skilled-nursing facilities
43 people in local jails and other municipal confinement facilities
26 people in residential treatment centers for adults
9 people in group homes intended for adults
People in group quarters in 2000:
164 people in nursing homes
54 people in local jails and other confinement facilities (including police lockups)
40 people in other noninstitutional group quarters
7 people in homes for the mentally ill
7 people in homes for the mentally retarded
Fatal accident statistics in 2014:
Fatal accident count: 3
Vehicles involved in fatal accidents: 6
Fatal accidents caused by drunken drivers: 0
Fatalities: 3
Persons involved in fatal accidents: 11
Pedestrians involved in fatal accidents: 0
Fatal accident statistics in 2013:
Fatal accident count: 4
Vehicles involved in fatal accidents: 7
Fatal accidents caused by drunken drivers: 0
Fatalities: 4
Persons involved in fatal accidents: 12
Pedestrians involved in fatal accidents: 0
2002 - 2018 National Fire Incident Reporting System (NFIRS) incidents
According to the data from the years 2002 - 2018 the average number of fire incidents per year is 70. The highest number of reported fire incidents - 143 took place in 2006, and the least - 2 in 2003. The data has an increasing trend.
When looking into fire subcategories, the most reports belonged to: Structure Fires (44.0%), and Outside Fires (38.3%).
Fire incident types reported to NFIRS in Zip Code 38320
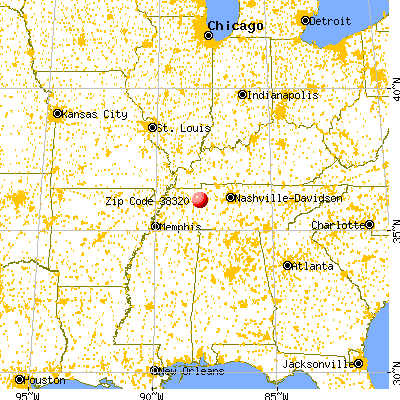


 Nearest zip codes: 38317, 38318, 37134, 38333, 38341, 38342.
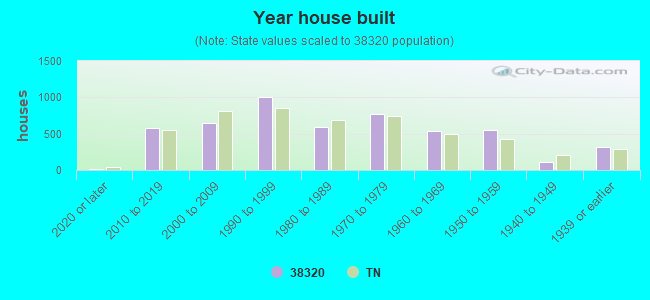


 According to the data from the years 2002 - 2018 the average number of fire incidents per year is 70. The highest number of reported fire incidents - 143 took place in 2006, and the least - 2 in 2003. The data has an increasing trend.
 When looking into fire subcategories, the most reports belonged to: Structure Fires (44.0%), and Outside Fires (38.3%).