Estimated zip code population in 2022: 3,007 Zip code population in 2010: 2,431 Zip code population in 2000: 2,216
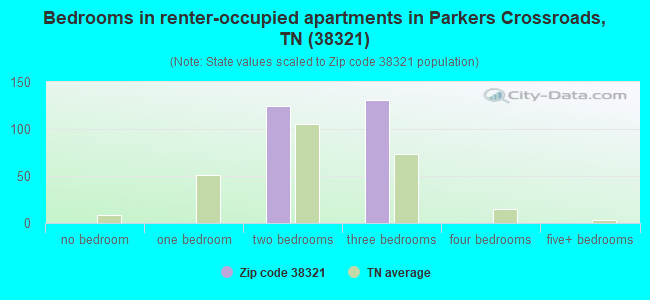
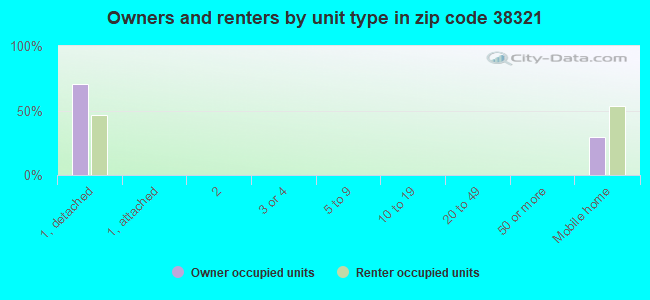
Houses and condos: 1,292 Renter-occupied apartments: 260
% of renters here:
22%
State:
33%
March 2022 cost of living index in zip code 38321: 78.0 (low, U.S. average is 100)
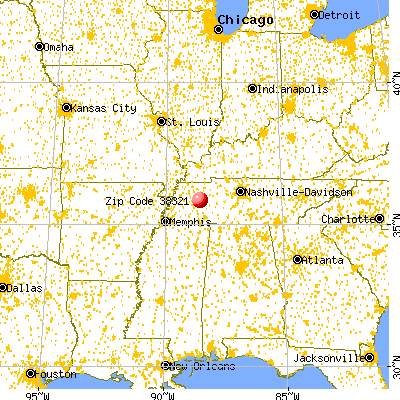
Land area: 95.4 sq. mi. Water area: 0.3 sq. mi.
Population density: 32 people per square mile
(very low).
OSM Map
General Map
Google Map
MSN Map
OSM Map
General Map
Google Map
MSN Map
OSM Map
General Map
Google Map
MSN Map
OSM Map
General Map
Google Map
MSN Map
Please wait while loading the map...
Real estate property taxes paid for housing units in 2022:
This zip code:
0.4% ($531)
Tennessee:
0.5% ($1,376)
Median real estate property taxes paid for housing units with mortgages in 2022: $996 (0.4%) Median real estate property taxes paid for housing units with no mortgage in 2022: $392 (0.4%)
Business Search- 14 Million verified businesses
Males: 1,577
(52.4%)
Females: 1,430
(47.6%)
For population 25 years and over in 38321:
High school or higher: 85.0%
Bachelor's degree or higher: 8.6%
Graduate or professional degree: 2.8%
Unemployed: 1.7%
Mean travel time to work (commute): 34.5 minutes
For population 15 years and over in 38321:
Never married: 27.7%
Now married: 50.4%
Separated: 1.4%
Widowed: 7.7%
Divorced: 12.7%
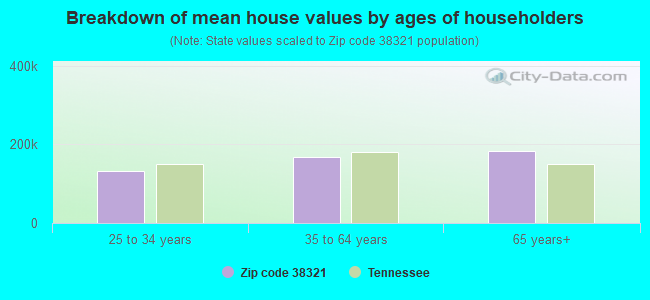
Zip code 38321 compared to state average:
Median house value significantly below state average.
Unemployed percentage below state average.
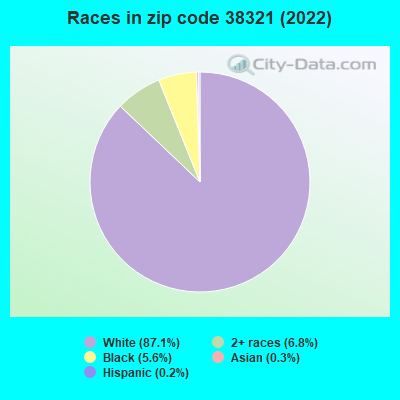
Black race population percentage below state average.
Hispanic race population percentage significantly below state average.
Foreign-born population percentage significantly below state average.
Renting percentage below state average.
Length of stay since moving in significantly above state average.
Number of college students below state average.
Percentage of population with a bachelor's degree or higher significantly below state average.
Averages for the 2020 tax year for zip code 38321, filed in 2021:
Average Adjusted Gross Income (AGI) in 2020: $48,313 (Individual Income Tax Returns)
Here:
$48,313
State:
$69,014
Salary/wage: $42,108 (reported on 81.2% of returns)
Here:
$42,108
State:
$55,872
(% of AGI for various income ranges: 1036.1% for AGIs below $25k, 3383.1% for AGIs $25k-50k, 5795.7% for AGIs $50k-75k, 9781.4% for AGIs $75k-100k, 15917.1% for AGIs $100k-200k)
Taxable interest for individuals: $624 (reported on 25.9% of returns)
This zip code:
$624
Tennessee:
$1,945
(% of AGI for various income ranges: 5.2% for AGIs below $25k, 11.9% for AGIs $25k-50k, 27.9% for AGIs $50k-75k, 48.6% for AGIs $75k-100k, 85.7% for AGIs $100k-200k)
Ordinary dividends: $1,533 (reported on 8.0% of returns)
Here:
$1,533
State:
$8,105
(% of AGI for various income ranges: 22.7% for AGIs $25k-50k, 24.3% for AGIs $50k-75k, 64.3% for AGIs $100k-200k)
Net capital gain/loss in AGI: +$8,556 (reported on 8.0% of returns)
Here:
+$8,556
State:
+$33,664
(% of AGI for various income ranges: 11.5% for AGIs $25k-50k, 32.9% for AGIs $50k-75k, 991.4% for AGIs $100k-200k)
Profit/loss from business: +$13,700 (reported on 14.3% of returns)
Here:
+$13,700
State:
+$18,991
(% of AGI for various income ranges: 175.8% for AGIs below $25k, 226.9% for AGIs $25k-50k, 152.9% for AGIs $50k-75k, 1154.3% for AGIs $75k-100k)
Taxable individual retirement arrangement distribution: $16,600 (reported on 8.9% of returns)
38321:
$16,600
Tennessee:
$20,036
(% of AGI for various income ranges: 55.5% for AGIs below $25k, 234.6% for AGIs $25k-50k, 1238.6% for AGIs $75k-100k)
Earned income credit: $2,471 (reported on 21.4% of returns)
Here:
$2,471
State:
$2,391
(% of AGI for various income ranges: 123.3% for AGIs below $25k, 71.5% for AGIs $25k-50k)
Percentage of individuals using paid preparers for their 2020 taxes: 95.5%
Here:
96%
State:
93%
(% for various income ranges: 95.1% for AGIs below $25k, 96.9% for AGIs $25k-50k, 94.1% for AGIs $50k-75k, 100.0% for AGIs $75k-100k, 91.7% for AGIs $100k-200k)
Averages for the 2012 tax year for zip code 38321, filed in 2013:
Average Adjusted Gross Income (AGI) in 2012: $38,481 (Individual Income Tax Returns)
Here:
$38,481
State:
$53,767
Salary/wage: $33,959 (reported on 85.7% of returns)
Here:
$33,959
State:
$45,421
(% of AGI for various income ranges: 76.4% for AGIs below $25k, 81.0% for AGIs $25k-50k, 82.1% for AGIs $50k-75k, 72.9% for AGIs $75k-100k, 60.3% for AGIs $100k-200k)
Taxable interest for individuals: $670 (reported on 25.7% of returns)
This zip code:
$670
Tennessee:
$1,732
(% of AGI for various income ranges: 0.7% for AGIs below $25k, 0.6% for AGIs $25k-50k, 0.2% for AGIs $50k-75k, 0.5% for AGIs $75k-100k, 0.2% for AGIs $100k-200k)
Ordinary dividends: $1,045 (reported on 10.5% of returns)
Here:
$1,045
State:
$6,739
(% of AGI for various income ranges: 0.6% for AGIs below $25k, 0.5% for AGIs $25k-50k, 0.2% for AGIs $75k-100k, 0.1% for AGIs $100k-200k)
Net capital gain/loss in AGI: +$5,989 (reported on 8.6% of returns)
Here:
+$5,989
State:
+$19,082
(% of AGI for various income ranges: 0.8% for AGIs $25k-50k, 3.2% for AGIs $50k-75k, 2.0% for AGIs $75k-100k)
Profit/loss from business: +$5,300 (reported on 12.4% of returns)
Here:
+$5,300
State:
+$15,240
(% of AGI for various income ranges: 7.5% for AGIs below $25k, 2.4% for AGIs $25k-50k)
Taxable individual retirement arrangement distribution: $12,340 (reported on 9.5% of returns)
38321:
$12,340
Tennessee:
$15,505
(% of AGI for various income ranges: 2.7% for AGIs below $25k, 5.2% for AGIs $25k-50k, 6.4% for AGIs $75k-100k)
Total itemized deductions: $18,644 (25% of AGI, reported on 8.6% of returns)
Here:
$18,644
State:
$21,976
Here:
25.3% of AGI
State:
17.8% of AGI
(% of AGI for various income ranges: 4.0% for AGIs $25k-50k, 4.7% for AGIs $50k-75k, 10.4% for AGIs $75k-100k)
Charity contributions: $4,414 (reported on 6.7% of returns)
Here:
$4,414
State:
$6,709
Taxes paid: $3,411 (reported on 8.6% of returns)
38321:
$3,411
State:
$4,829
Earned income credit: $2,338 (reported on 24.8% of returns)
Here:
$2,338
State:
$2,404
(% of AGI for various income ranges: 8.0% for AGIs below $25k, 1.4% for AGIs $25k-50k)
Percentage of individuals using paid preparers for their 2012 taxes: 57.1%
Here:
57%
State:
52%
(% for various income ranges: 52.3% for AGIs below $25k, 59.4% for AGIs $25k-50k, 60.0% for AGIs $50k-75k, 66.7% for AGIs $75k-100k, 60.0% for AGIs $100k-200k)
Averages for the 2004 tax year for zip code 38321, filed in 2005:
Average Adjusted Gross Income (AGI) in 2004: $32,176 (Individual Income Tax Returns)
Here:
$32,176
State:
$44,088
Salary/wage: $30,720 (reported on 85.9% of returns)
Here:
$30,720
State:
$38,825
(% of AGI for various income ranges: 102.2% for AGIs below $10k, 81.9% for AGIs $10k-25k, 88.3% for AGIs $25k-50k, 87.3% for AGIs $50k-75k, 77.1% for AGIs $75k-100k, 54.4% for AGIs over 100k)
Taxable interest for individuals: $866 (reported on 28.2% of returns)
This zip code:
$866
Tennessee:
$1,802
(% of AGI for various income ranges: 2.9% for AGIs below $10k, 1.9% for AGIs $10k-25k, 0.6% for AGIs $25k-50k, 0.5% for AGIs $50k-75k, 0.3% for AGIs $75k-100k, 0.3% for AGIs over 100k)
Taxable dividends: $564 (reported on 12.6% of returns)
Here:
$564
State:
$3,727
(% of AGI for various income ranges: 1.2% for AGIs below $10k, 0.4% for AGIs $10k-25k, 0.1% for AGIs $25k-50k, 0.2% for AGIs $50k-75k, 0.1% for AGIs $75k-100k, 0.2% for AGIs over 100k)
Net capital gain/loss: +$1,619 (reported on 9.2% of returns)
Here:
+$1,619
State:
+$15,776
(% of AGI for various income ranges: 0.6% for AGIs below $10k, 0.5% for AGIs $10k-25k, 0.5% for AGIs $25k-50k, 0.1% for AGIs $50k-75k, -0.2% for AGIs $75k-100k, 1.6% for AGIs over 100k)
Profit/loss from business: +$5,655 (reported on 15.9% of returns)
Here:
+$5,655
State:
+$12,882
(% of AGI for various income ranges: 8.7% for AGIs below $10k, 4.8% for AGIs $10k-25k, 2.6% for AGIs $25k-50k, 0.3% for AGIs $50k-75k, 6.9% for AGIs $75k-100k)
IRA payment deduction: $1,750 (reported on 1.9% of returns)
38321:
$1,750
Tennessee:
$2,934
Total itemized deductions: $15,088 (23% of AGI, reported on 10.7% of returns)
Here:
$15,088
State:
$18,035
Here:
22.5% of AGI
State:
19.9% of AGI
(% of AGI for various income ranges: 5.7% for AGIs $25k-50k, 5.9% for AGIs $50k-75k, 7.2% for AGIs $75k-100k, 6.4% for AGIs over 100k)
Charity contributions deductions: $3,227 (4% of AGI, reported on 8.3% of returns)
Here:
$3,227
State:
$5,167
Here:
4.5% of AGI
State:
5.3% of AGI
(% of AGI for various income ranges: 0.5% for AGIs $25k-50k, 0.9% for AGIs $50k-75k, 1.6% for AGIs $75k-100k, 2.0% for AGIs over 100k)
Total tax: $3,734 (reported on 70.4% of returns)
38321:
$3,734
State:
$7,482
(% of AGI for various income ranges: 2.6% for AGIs below $10k, 3.5% for AGIs $10k-25k, 6.2% for AGIs $25k-50k, 8.8% for AGIs $50k-75k, 10.9% for AGIs $75k-100k, 16.7% for AGIs over 100k)
Earned income credit: $1,660 (reported on 22.3% of returns)
Here:
$1,660
State:
$1,826
Percentage of individuals using paid preparers for their 2004 taxes: 67.3%
Here:
67%
State:
60%
(% for various income ranges: 55.6% for AGIs below $10k, 73.5% for AGIs $10k-25k, 68.5% for AGIs $25k-50k, 63.7% for AGIs $50k-75k, 76.9% for AGIs $75k-100k, 78.6% for AGIs over 100k)
Likely homosexual households (counted as self-reported same-sex unmarried-partner households)
Lesbian couples: 1.1% of all households
Gay men: 0.0% of all households
Household received Food Stamps/SNAP in the past 12 months: 202 Household did not receive Food Stamps/SNAP in the past 12 months: 1,001
Women who had a birth in the past 12 months: 55 (56 now married, 0 unmarried) Women who did not have a birth in the past 12 months: 473 (159 now married, 313 unmarried)
Housing units in zip code 38321 with a mortgage: 330 (6 second mortgage) Median monthly owner costs for units with a mortgage: $1,228 Median monthly owner costs for units without a mortgage: $299
Residents with income below the poverty level in 2022:
This zip code:
23.4%
Whole state:
13.3%
Residents with income below 50% of the poverty level in 2022:
This zip code:
13.4%
Whole state:
7.1%
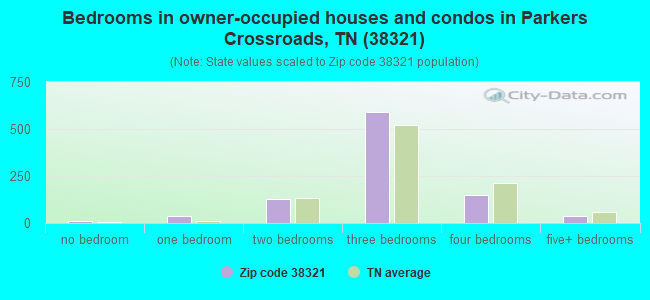
Median number of rooms in houses and condos:
Here:
6.1
State:
6.5
Median number of rooms in apartments:
Here:
4.6
State:
4.4
Notable locations in this zip code not listed on our city pages
Notable locations in zip code 38321: Stanford Farms (A), Moss Rest (B), Carroll County Rural Fire Department District 5 Cedar Grove (C). Display/hide their locations on the map
Churches in zip code 38321 include: Mount Gilead Baptist Church (A), Hickory Plains Church (B), Hickory Flat Church (C), Liberty Baptist Church (D), New Bethel Baptist Church (E), Christian Chapel (F), Palestine Church (G), Obion Chapel (H), Cedar Grove Church (I). Display/hide their locations on the map
Cemeteries: Woodard Cemetery (1), Antioch Cemetery (2), Palestine Cemetery (3), Liberty Cemetery (4), Christian Chapel Cemetery (5), Morning Sun Cemetery (6), Pleasant Hill Cemetery (7). Display/hide their locations on the map
Lakes and reservoirs: Twin Lakes (A), Susan Branch Lake (B), Indian Creek Lake Number 87-1 (C), Spring Creek Lake (D), Hoopers Lake (E), Donald Halters Lake (F), OFDBA 87-3 Lake (G), Moss Creek Lake (H). Display/hide their locations on the map
Streams, rivers, and creeks: Indian Creek (A), Griffin Creek (B), Grassy Hollow Creek (C), Gin Branch (D), Eubank Branch (E), Cat Creek (F), Meals Creek (G), Bardwell Branch (H), Buggy Branch (I). Display/hide their locations on the map
Size of family households: 335 2-persons, 128 3-persons, 122 4-persons, 112 5-persons, 80 7-or-more-persons
Size of nonfamily households: 366 1-person, 49 2-persons, 15 3-persons
324 married couples with children.
452 single-parent households (226 men, 226 women).
99.5% of residents of 38321 zip code speak English at home.
0.2% of residents speak Spanish at home (100% not well).
Foreign born population: 10 (0.3%) (100.0% of them are naturalized citizens)
This zip code:
0.3%
Whole state:
5.6%
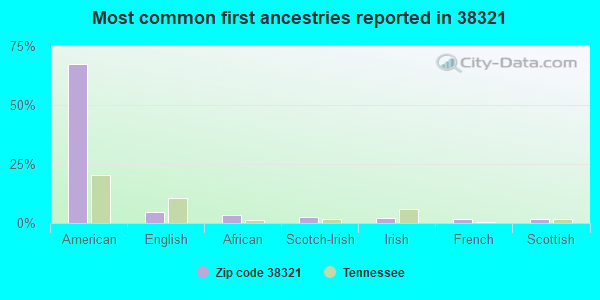
68%American
5%English
3%African
2%Scotch-Irish
2%Irish
2%French
2%Scottish
Year of entry for the foreign-born population
122010 or later
02000 to 2009
01990 to 1999
0Before 1990
Housing units lacking complete plumbing facilities: 2.8% Housing units lacking complete kitchen facilities: 2.4%
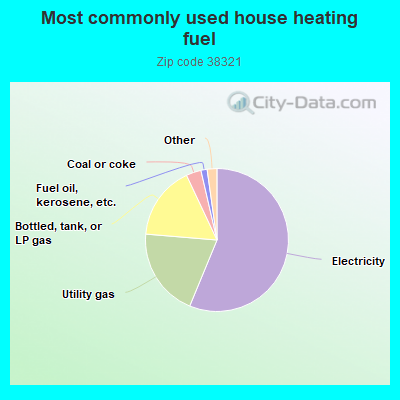
56.3%Electricity
20.1%Utility gas
16.7%Bottled, tank, or LP gas
3.4%Coal or coke
1.4%Fuel oil, kerosene, etc.
1.0%Wood
1.0%No fuel used
Population in 1990: 1,150. Population change in the 1990s: +1,066 (+92.7%).
Place of birth for U.S.-born residents:
This state: 2,185
Northeast: 81
Midwest: 214
South: 324
West: 174
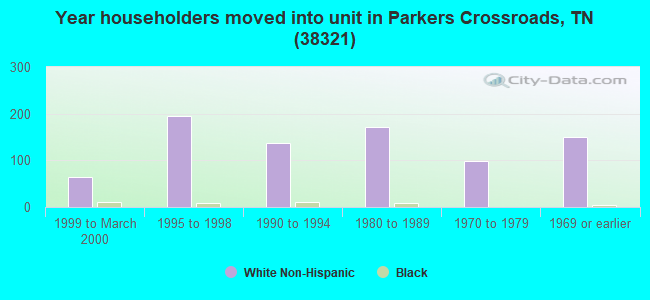
69% of the 38321 zip code residents lived in the same house 5 years ago. Out of people who lived in different houses, 50% lived in this county. Out of people who lived in different counties, 50% lived in Tennessee.
98% of the 38321 zip code residents lived in the same house 1 year ago. Out of people who lived in different houses, 69% moved from this county. Out of people who lived in different houses, 29% moved from different county within same state. Out of people who lived in different houses, 11% moved from different state. Out of people who lived in different houses, 20% moved from abroad.
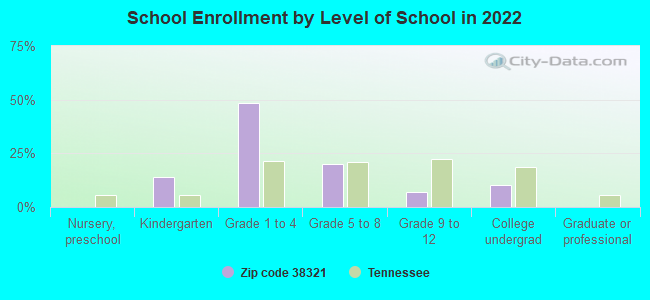
Private vs. public school enrollment:
Students in private schools in grades 1 to 8 (elementary and middle school): 68
Here:
17.4%
Tennessee:
15.0%
Students in private schools in grades 9 to 12 (high school): 16
Here:
39.3%
Tennessee:
16.2%
Students in private undergraduate colleges: 14
Here:
25.0%
Tennessee:
23.5%
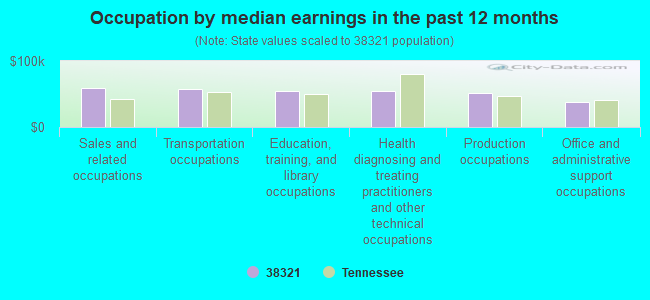
Occupation by median earnings in the past 12 months ($)
58,758Sales and related occupations
57,348Transportation occupations
54,851Education, training, and library occupations
54,122Health diagnosing and treating practitioners and other technical occupations
51,009Production occupations
37,378Office and administrative support occupations
Top industries in this zip code by the number of employees in 2005:
Construction: Other Building Finishing Contractors (10-19 employees: 1 establishment)
Administrative and Support and Waste Management and Remediation Services: Septic Tank and Related Services (5-9: 1)
2002 - 2018 National Fire Incident Reporting System (NFIRS) incidents
According to the data from the years 2002 - 2018 the average number of fire incidents per year is 19. The highest number of reported fire incidents - 31 took place in 2017, and the least - 9 in 2006. The data has an increasing trend.
When looking into fire subcategories, the most reports belonged to: Outside Fires (44.4%), and Structure Fires (29.6%).
Fire incident types reported to NFIRS in Zip Code 38321


 Nearest zip codes: 38348, 38235, 38390, 38344, 38220, 38258.


 According to the data from the years 2002 - 2018 the average number of fire incidents per year is 19. The highest number of reported fire incidents - 31 took place in 2017, and the least - 9 in 2006. The data has an increasing trend.
 When looking into fire subcategories, the most reports belonged to: Outside Fires (44.4%), and Structure Fires (29.6%).