Estimated median house/condo value in 2022: $170,806
38362:
$170,806
Tennessee:
$284,800
According to our research of Tennessee and other state lists, there were 3 registered sex offenders living in 38362 zip code as of June 08, 2024. The ratio of all residents to sex offenders in zip code 38362 is 388 to 1. The ratio of registered sex offenders to all residents in this zip code is near the state average.
Median resident age:
This zip code:
37.4 years
Tennessee median age:
39.2 years
Average household size:
This zip code:
2.2 people
Tennessee:
2.4 people
Averages for the 2020 tax year for zip code 38362, filed in 2021:
Average Adjusted Gross Income (AGI) in 2020: $45,545 (Individual Income Tax Returns)
Here:
$45,545
State:
$69,014
Salary/wage: $43,264 (reported on 87.5% of returns)
Here:
$43,264
State:
$55,872
(% of AGI for various income ranges: 1272.0% for AGIs below $25k, 3800.7% for AGIs $25k-50k, 6480.0% for AGIs $50k-75k, 8396.0% for AGIs $75k-100k, 19843.3% for AGIs $100k-200k)
Taxable interest for individuals: $250 (reported on 15.6% of returns)
This zip code:
$250
Tennessee:
$1,945
(% of AGI for various income ranges: 2.0% for AGIs below $25k, 3.3% for AGIs $50k-75k, 14.0% for AGIs $75k-100k, 36.7% for AGIs $100k-200k)
Ordinary dividends: $775 (reported on 6.2% of returns)
Here:
$775
State:
$8,105
(% of AGI for various income ranges: 34.4% for AGIs $50k-75k)
Net capital gain/loss in AGI: +$600 (reported on 4.7% of returns)
Here:
+$600
State:
+$33,664
(% of AGI for various income ranges: 20.0% for AGIs $50k-75k)
Profit/loss from business: +$11,030 (reported on 15.6% of returns)
Here:
+$11,030
State:
+$18,991
(% of AGI for various income ranges: 156.0% for AGIs below $25k, 143.3% for AGIs $25k-50k, 640.0% for AGIs $50k-75k)
Taxable individual retirement arrangement distribution: $15,200 (reported on 6.2% of returns)
38362:
$15,200
Tennessee:
$20,036
(% of AGI for various income ranges: 675.6% for AGIs $50k-75k)
Earned income credit: $2,907 (reported on 21.9% of returns)
Here:
$2,907
State:
$2,391
(% of AGI for various income ranges: 145.0% for AGIs below $25k, 78.0% for AGIs $25k-50k)
Percentage of individuals using paid preparers for their 2020 taxes: 96.9%
Here:
97%
State:
93%
(% for various income ranges: 95.8% for AGIs below $25k, 94.4% for AGIs $25k-50k, 100.0% for AGIs $50k-75k, 100.0% for AGIs $75k-100k, 100.0% for AGIs $100k-200k)
Averages for the 2012 tax year for zip code 38362, filed in 2013:
Average Adjusted Gross Income (AGI) in 2012: $42,409 (Individual Income Tax Returns)
Here:
$42,409
State:
$53,767
Salary/wage: $38,773 (reported on 92.9% of returns)
Here:
$38,773
State:
$45,421
(% of AGI for various income ranges: 87.6% for AGIs below $25k, 92.1% for AGIs $25k-50k, 89.7% for AGIs $50k-75k, 90.9% for AGIs $75k-100k, 61.4% for AGIs $100k-200k)
Taxable interest for individuals: $218 (reported on 19.6% of returns)
This zip code:
$218
Tennessee:
$1,732
(% of AGI for various income ranges: 0.3% for AGIs below $25k, 0.2% for AGIs $75k-100k)
Ordinary dividends: $217 (reported on 10.7% of returns)
Here:
$217
State:
$6,739
Net capital gain/loss in AGI: +$7,900 (reported on 5.4% of returns)
Here:
+$7,900
State:
+$19,082
Profit/loss from business: +$5,917 (reported on 10.7% of returns)
Here:
+$5,917
State:
+$15,240
Taxable individual retirement arrangement distribution: $11,600 (reported on 3.6% of returns)
38362:
$11,600
Tennessee:
$15,505
Total itemized deductions: $15,818 (24% of AGI, reported on 19.6% of returns)
Here:
$15,818
State:
$21,976
Here:
23.8% of AGI
State:
17.8% of AGI
(% of AGI for various income ranges: 9.5% for AGIs $25k-50k, 7.9% for AGIs $50k-75k, 16.2% for AGIs $75k-100k)
Charity contributions: $4,644 (reported on 16.1% of returns)
Here:
$4,644
State:
$6,709
(% of AGI for various income ranges: 1.4% for AGIs $25k-50k, 2.2% for AGIs $50k-75k, 5.0% for AGIs $75k-100k)
Taxes paid: $2,509 (reported on 19.6% of returns)
38362:
$2,509
State:
$4,829
(% of AGI for various income ranges: 1.2% for AGIs $25k-50k, 1.4% for AGIs $50k-75k, 2.8% for AGIs $75k-100k)
Earned income credit: $2,447 (reported on 26.8% of returns)
Here:
$2,447
State:
$2,404
(% of AGI for various income ranges: 9.5% for AGIs below $25k, 1.7% for AGIs $25k-50k)
Percentage of individuals using paid preparers for their 2012 taxes: 50.0%
Here:
50%
State:
52%
(% for various income ranges: 55.0% for AGIs below $25k, 44.4% for AGIs $25k-50k, 50.0% for AGIs $50k-75k, 40.0% for AGIs $75k-100k, 66.7% for AGIs $100k-200k)
Averages for the 2004 tax year for zip code 38362, filed in 2005:
Average Adjusted Gross Income (AGI) in 2004: $38,470 (Individual Income Tax Returns)
Here:
$38,470
State:
$44,088
Salary/wage: $36,180 (reported on 93.2% of returns)
Here:
$36,180
State:
$38,825
(% of AGI for various income ranges: 112.2% for AGIs below $10k, 84.8% for AGIs $10k-25k, 91.0% for AGIs $25k-50k, 92.8% for AGIs $50k-75k, 92.3% for AGIs $75k-100k, 56.5% for AGIs over 100k)
Taxable interest for individuals: $345 (reported on 25.0% of returns)
This zip code:
$345
Tennessee:
$1,802
(% of AGI for various income ranges: 0.6% for AGIs $10k-25k, 0.2% for AGIs $25k-50k, 0.1% for AGIs $50k-75k, 0.1% for AGIs $75k-100k, 0.5% for AGIs over 100k)
Taxable dividends: $338 (reported on 12.3% of returns)
Here:
$338
State:
$3,727
(% of AGI for various income ranges: 0.0% for AGIs below $10k, 0.1% for AGIs $25k-50k, 0.2% for AGIs $50k-75k, 0.2% for AGIs $75k-100k)
Net capital gain/loss: +$3,647 (reported on 6.1% of returns)
Here:
+$3,647
State:
+$15,776
Profit/loss from business: +$4,341 (reported on 15.9% of returns)
Here:
+$4,341
State:
+$12,882
(% of AGI for various income ranges: 11.5% for AGIs below $10k, 1.9% for AGIs $10k-25k, 2.4% for AGIs $25k-50k, 2.0% for AGIs $50k-75k)
Total itemized deductions: $12,987 (24% of AGI, reported on 26.8% of returns)
Here:
$12,987
State:
$18,035
Here:
23.7% of AGI
State:
19.9% of AGI
(% of AGI for various income ranges: 11.5% for AGIs $10k-25k, 10.4% for AGIs $25k-50k, 6.9% for AGIs $50k-75k, 9.0% for AGIs $75k-100k, 10.4% for AGIs over 100k)
Charity contributions deductions: $3,789 (7% of AGI, reported on 20.5% of returns)
Here:
$3,789
State:
$5,167
Here:
6.7% of AGI
State:
5.3% of AGI
(% of AGI for various income ranges: 2.1% for AGIs $10k-25k, 2.1% for AGIs $25k-50k, 1.6% for AGIs $50k-75k, 1.8% for AGIs $75k-100k, 3.4% for AGIs over 100k)
Total tax: $4,367 (reported on 74.1% of returns)
38362:
$4,367
State:
$7,482
(% of AGI for various income ranges: 2.6% for AGIs below $10k, 3.6% for AGIs $10k-25k, 5.9% for AGIs $25k-50k, 8.7% for AGIs $50k-75k, 10.5% for AGIs $75k-100k, 17.3% for AGIs over 100k)
Earned income credit: $1,639 (reported on 19.5% of returns)
Here:
$1,639
State:
$1,826
Percentage of individuals using paid preparers for their 2004 taxes: 58.2%
Here:
58%
State:
60%
(% for various income ranges: 43.0% for AGIs below $10k, 63.0% for AGIs $10k-25k, 63.9% for AGIs $25k-50k, 50.0% for AGIs $50k-75k, 60.5% for AGIs $75k-100k, 77.8% for AGIs over 100k)
Household received Food Stamps/SNAP in the past 12 months: 14 Household did not receive Food Stamps/SNAP in the past 12 months: 442
Women who had a birth in the past 12 months: 62 (48 now married, 14 unmarried) Women who did not have a birth in the past 12 months: 310 (115 now married, 195 unmarried)
Housing units in zip code 38362 with a mortgage: 296 (17 second mortgage, 17 both second mortgage and home equity loan) Residents with income below the poverty level in 2022:
This zip code:
9.9%
Whole state:
13.3%
Residents with income below 50% of the poverty level in 2022:
This zip code:
3.8%
Whole state:
7.1%
Median number of rooms in houses and condos:
Here:
6.8
State:
6.5
Median number of rooms in apartments:
Here:
4.2
State:
4.4
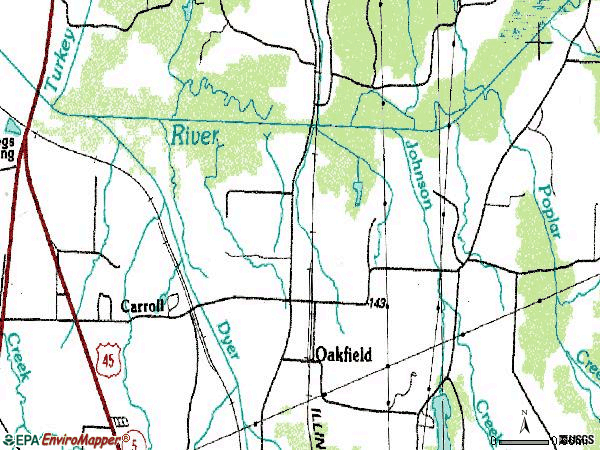
Notable locations in this zip code not listed on our city pages
Size of family households: 106 2-persons, 107 3-persons, 20 4-persons, 38 5-persons
Size of nonfamily households: 110 1-person, 74 2-persons
155 married couples with children.
14 single-parent households (14 women).
89.8% of residents of 38362 zip code speak English at home.
7.1% of residents speak Spanish at home (30% very well, 70% well).
2.5% of residents speak other Indo-European language at home (100% very well).
Foreign born population: 57 (5.6%) (23.4% of them are naturalized citizens)
This zip code:
5.6%
Whole state:
5.6%
63%Nicaragua
21%Malaysia
18%English
10%Irish
9%German
9%French
3%Italian
3%American
1%European
Year of entry for the foreign-born population
02010 or later
02000 to 2009
551990 to 1999
0Before 1990
59.9%Utility gas
36.9%Electricity
3.7%Bottled, tank, or LP gas
Population in 1990: 2,239.
Place of birth for U.S.-born residents:
This state: 691
Northeast: 34
Midwest: 105
South: 122
47% of the 38362 zip code residents lived in the same house 5 years ago. Out of people who lived in different houses, 55% lived in this county. Out of people who lived in different counties, 50% lived in Tennessee.
80% of the 38362 zip code residents lived in the same house 1 year ago. Out of people who lived in different houses, 47% moved from this county. Out of people who lived in different houses, 47% moved from different county within same state.
Private vs. public school enrollment:
Students in private schools in grades 1 to 8 (elementary and middle school):
Here:
0.0%
Tennessee:
15.0%
Students in private undergraduate colleges: 44
Here:
64.3%
Tennessee:
23.5%
Occupation by median earnings in the past 12 months ($)
69,125Sales and related occupations
40,225Health technologists and technicians
28,750Office and administrative support occupations
28,683Material moving occupations
Top industries in this zip code by the number of employees in 2005:
Wholesale Trade: Medical, Dental, and Hospital Equipment and Supplies Merchant Wholesalers (20-49 employees: 1 establishment)
Administrative and Support and Waste Management and Remediation Services: Janitorial Services (10-19: 2)
Construction: Power and Communication Line and Related Structures Construction (10-19: 1)
Other Services (except Public Administration): Religious Organizations (5-9: 1)
Construction: Painting and Wall Covering Contractors (1-4: 1)
Fatal accident statistics in 2013:
Fatal accident count: 1
Vehicles involved in fatal accidents: 1
Fatal accidents caused by drunken drivers: 1
Fatalities: 1
Persons involved in fatal accidents: 1
Pedestrians involved in fatal accidents: 0
Fatal accident statistics in 2010:
Fatal accident count: 1
Vehicles involved in fatal accidents: 1
Fatal accidents caused by drunken drivers: 0
Fatalities: 1
Persons involved in fatal accidents: 1
Pedestrians involved in fatal accidents: 0
Home Mortgage Disclosure Act Aggregated Statistics For Year 2009 (Based on 4 partial tracts)
A) FHA, FSA/RHS & VA Home Purchase Loans
B) Conventional Home Purchase Loans
C) Refinancings
D) Home Improvement Loans
F) Non-occupant Loans on < 5 Family Dwellings (A B C & D)
G) Loans On Manufactured Home Dwelling (A B C & D)
Number
Average Value
Number
Average Value
Number
Average Value
Number
Average Value
Number
Average Value
Number
Average Value
LOANS ORIGINATED
54
$129,431
36
$116,092
108
$131,437
2
$30,860
19
$100,871
0
$0
APPLICATIONS APPROVED, NOT ACCEPTED
3
$131,037
0
$0
6
$165,923
0
$0
0
$0
0
$0
APPLICATIONS DENIED
7
$112,590
1
$99,140
33
$125,997
3
$7,550
1
$73,880
0
$0
APPLICATIONS WITHDRAWN
2
$170,295
2
$50,790
28
$133,948
0
$0
1
$28,580
2
$12,660
FILES CLOSED FOR INCOMPLETENESS
0
$0
1
$56,020
8
$144,275
0
$0
0
$0
0
$0
Aggregated Statistics For Year 2008 (Based on 4 partial tracts)
A) FHA, FSA/RHS & VA Home Purchase Loans
B) Conventional Home Purchase Loans
C) Refinancings
D) Home Improvement Loans
F) Non-occupant Loans on < 5 Family Dwellings (A B C & D)
G) Loans On Manufactured Home Dwelling (A B C & D)
Number
Average Value
Number
Average Value
Number
Average Value
Number
Average Value
Number
Average Value
Number
Average Value
LOANS ORIGINATED
48
$121,255
63
$134,720
68
$114,681
6
$34,103
22
$90,216
2
$50,235
APPLICATIONS APPROVED, NOT ACCEPTED
5
$99,756
4
$111,862
6
$109,265
0
$0
0
$0
0
$0
APPLICATIONS DENIED
6
$120,203
12
$83,485
59
$122,187
5
$53,868
4
$76,590
1
$59,740
APPLICATIONS WITHDRAWN
3
$155,333
5
$153,418
24
$119,435
0
$0
2
$113,040
1
$88,150
FILES CLOSED FOR INCOMPLETENESS
0
$0
1
$100,770
3
$111,993
0
$0
0
$0
0
$0
Aggregated Statistics For Year 2007 (Based on 4 partial tracts)
A) FHA, FSA/RHS & VA Home Purchase Loans
B) Conventional Home Purchase Loans
C) Refinancings
D) Home Improvement Loans
F) Non-occupant Loans on < 5 Family Dwellings (A B C & D)
G) Loans On Manufactured Home Dwelling (A B C & D)
Number
Average Value
Number
Average Value
Number
Average Value
Number
Average Value
Number
Average Value
Number
Average Value
LOANS ORIGINATED
18
$140,385
124
$113,043
80
$109,817
5
$27,492
25
$90,626
3
$37,380
APPLICATIONS APPROVED, NOT ACCEPTED
0
$0
19
$120,034
18
$88,006
1
$76,940
3
$86,943
1
$38,790
APPLICATIONS DENIED
3
$110,100
26
$104,785
87
$121,827
12
$32,000
6
$111,670
3
$38,200
APPLICATIONS WITHDRAWN
2
$138,335
9
$155,092
36
$122,803
2
$60,115
4
$100,098
0
$0
FILES CLOSED FOR INCOMPLETENESS
0
$0
2
$110,055
14
$127,499
0
$0
0
$0
0
$0
Aggregated Statistics For Year 2006 (Based on 4 partial tracts)
A) FHA, FSA/RHS & VA Home Purchase Loans
B) Conventional Home Purchase Loans
C) Refinancings
D) Home Improvement Loans
F) Non-occupant Loans on < 5 Family Dwellings (A B C & D)
G) Loans On Manufactured Home Dwelling (A B C & D)
Number
Average Value
Number
Average Value
Number
Average Value
Number
Average Value
Number
Average Value
Number
Average Value
LOANS ORIGINATED
24
$124,258
182
$101,737
70
$100,805
7
$26,917
16
$95,804
2
$27,460
APPLICATIONS APPROVED, NOT ACCEPTED
0
$0
14
$88,031
14
$91,623
2
$15,180
2
$50,935
1
$37,070
APPLICATIONS DENIED
2
$162,330
34
$101,977
85
$122,299
10
$34,388
5
$80,626
6
$39,718
APPLICATIONS WITHDRAWN
2
$130,205
15
$106,699
45
$103,637
1
$17,930
2
$120,590
0
$0
FILES CLOSED FOR INCOMPLETENESS
0
$0
7
$83,801
12
$94,920
0
$0
1
$98,600
0
$0
Aggregated Statistics For Year 2005 (Based on 4 partial tracts)
A) FHA, FSA/RHS & VA Home Purchase Loans
B) Conventional Home Purchase Loans
C) Refinancings
D) Home Improvement Loans
E) Loans on Dwellings For 5+ Families
F) Non-occupant Loans on < 5 Family Dwellings (A B C & D)
G) Loans On Manufactured Home Dwelling (A B C & D)
Number
Average Value
Number
Average Value
Number
Average Value
Number
Average Value
Number
Average Value
Number
Average Value
Number
Average Value
LOANS ORIGINATED
32
$123,134
174
$102,145
98
$95,853
5
$22,112
1
$424,300
32
$76,660
4
$36,278
APPLICATIONS APPROVED, NOT ACCEPTED
2
$64,100
28
$79,159
23
$90,184
1
$29,530
0
$0
3
$158,153
3
$53,587
APPLICATIONS DENIED
2
$143,595
53
$84,230
89
$105,739
13
$18,372
1
$993,510
6
$97,828
6
$138,513
APPLICATIONS WITHDRAWN
0
$0
26
$127,223
47
$110,471
1
$124,110
0
$0
3
$109,173
0
$0
FILES CLOSED FOR INCOMPLETENESS
1
$91,130
9
$97,319
20
$120,025
0
$0
0
$0
1
$133,710
0
$0
Aggregated Statistics For Year 2004 (Based on 4 partial tracts)
A) FHA, FSA/RHS & VA Home Purchase Loans
B) Conventional Home Purchase Loans
C) Refinancings
D) Home Improvement Loans
F) Non-occupant Loans on < 5 Family Dwellings (A B C & D)
G) Loans On Manufactured Home Dwelling (A B C & D)
Number
Average Value
Number
Average Value
Number
Average Value
Number
Average Value
Number
Average Value
Number
Average Value
LOANS ORIGINATED
34
$113,492
133
$98,173
97
$91,304
9
$52,033
21
$69,076
3
$41,223
APPLICATIONS APPROVED, NOT ACCEPTED
1
$76,190
17
$90,715
26
$103,014
3
$35,093
2
$58,655
1
$114,290
APPLICATIONS DENIED
3
$108,277
26
$91,932
81
$105,359
16
$39,429
1
$121,760
4
$50,350
APPLICATIONS WITHDRAWN
5
$108,912
17
$128,281
39
$101,249
2
$37,420
5
$91,168
0
$0
FILES CLOSED FOR INCOMPLETENESS
0
$0
6
$82,565
14
$93,369
1
$67,230
0
$0
0
$0
Aggregated Statistics For Year 2003 (Based on 4 partial tracts)
A) FHA, FSA/RHS & VA Home Purchase Loans
B) Conventional Home Purchase Loans
C) Refinancings
D) Home Improvement Loans
F) Non-occupant Loans on < 5 Family Dwellings (A B C & D)
Number
Average Value
Number
Average Value
Number
Average Value
Number
Average Value
Number
Average Value
LOANS ORIGINATED
35
$106,161
107
$110,573
207
$97,924
9
$10,268
15
$72,817
APPLICATIONS APPROVED, NOT ACCEPTED
1
$39,590
7
$92,079
30
$89,474
4
$14,412
0
$0
APPLICATIONS DENIED
4
$93,760
17
$79,639
80
$93,661
7
$14,140
1
$35,550
APPLICATIONS WITHDRAWN
1
$94,200
18
$101,782
39
$94,862
1
$28,870
1
$87,730
FILES CLOSED FOR INCOMPLETENESS
1
$149,960
4
$147,265
8
$97,408
1
$25,400
0
$0
Aggregated Statistics For Year 1999 (Based on 1 partial tract)
A) FHA, FSA/RHS & VA Home Purchase Loans
B) Conventional Home Purchase Loans
C) Refinancings
D) Home Improvement Loans
F) Non-occupant Loans on < 5 Family Dwellings (A B C & D)


 Nearest zip codes: 38305, 38355, 38301, 38343, 38358, 38348.