Estimated zip code population in 2022: 8,340 Zip code population in 2010: 9,515 Zip code population in 2000: 9,866
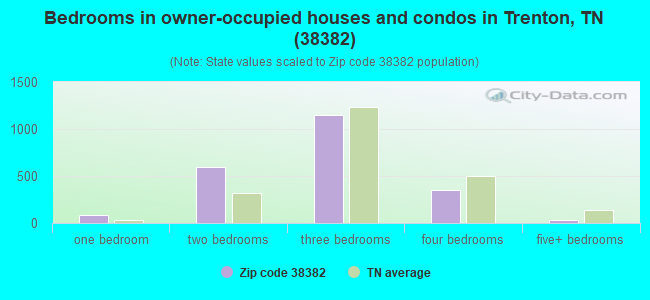
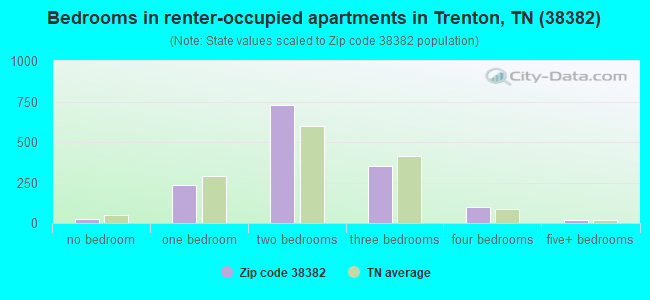
Houses and condos: 4,209 Renter-occupied apartments: 1,454
% of renters here:
39%
State:
33%
March 2022 cost of living index in zip code 38382: 78.1 (low, U.S. average is 100)
Land area: 173.7 sq. mi. Water area: 0.2 sq. mi.
Population density: 48 people per square mile
(very low).
OSM Map
General Map
Google Map
MSN Map
OSM Map
General Map
Google Map
MSN Map
OSM Map
General Map
Google Map
MSN Map
OSM Map
General Map
Google Map
MSN Map
Please wait while loading the map...
Real estate property taxes paid for housing units in 2022:
This zip code:
0.6% ($785)
Tennessee:
0.5% ($1,376)
Median real estate property taxes paid for housing units with mortgages in 2022: $1,164 (0.7%) Median real estate property taxes paid for housing units with no mortgage in 2022: $715 (0.6%)
Averages for the 2020 tax year for zip code 38382, filed in 2021:
Average Adjusted Gross Income (AGI) in 2020: $47,548 (Individual Income Tax Returns)
Here:
$47,548
State:
$69,014
Salary/wage: $40,049 (reported on 82.0% of returns)
Here:
$40,049
State:
$55,872
(% of AGI for various income ranges: 1155.4% for AGIs below $25k, 3602.7% for AGIs $25k-50k, 6085.7% for AGIs $50k-75k, 8874.8% for AGIs $75k-100k, 13014.8% for AGIs $100k-200k)
Taxable interest for individuals: $1,171 (reported on 26.4% of returns)
This zip code:
$1,171
Tennessee:
$1,945
(% of AGI for various income ranges: 14.1% for AGIs below $25k, 23.2% for AGIs $25k-50k, 42.0% for AGIs $50k-75k, 77.6% for AGIs $75k-100k, 90.0% for AGIs $100k-200k)
Ordinary dividends: $2,735 (reported on 10.6% of returns)
Here:
$2,735
State:
$8,105
(% of AGI for various income ranges: 9.6% for AGIs below $25k, 17.4% for AGIs $25k-50k, 39.5% for AGIs $50k-75k, 86.8% for AGIs $75k-100k, 137.0% for AGIs $100k-200k)
Net capital gain/loss in AGI: +$10,843 (reported on 10.3% of returns)
Here:
+$10,843
State:
+$33,664
(% of AGI for various income ranges: 9.6% for AGIs below $25k, 19.4% for AGIs $25k-50k, 75.0% for AGIs $50k-75k, 187.6% for AGIs $75k-100k, 314.3% for AGIs $100k-200k)
Profit/loss from business: +$17,251 (reported on 12.6% of returns)
Here:
+$17,251
State:
+$18,991
(% of AGI for various income ranges: 95.6% for AGIs below $25k, 74.7% for AGIs $25k-50k, 273.2% for AGIs $50k-75k, 348.4% for AGIs $75k-100k, 631.3% for AGIs $100k-200k)
Taxable individual retirement arrangement distribution: $13,309 (reported on 7.9% of returns)
38382:
$13,309
Tennessee:
$20,036
(% of AGI for various income ranges: 32.3% for AGIs below $25k, 85.6% for AGIs $25k-50k, 145.5% for AGIs $50k-75k, 367.6% for AGIs $75k-100k, 650.4% for AGIs $100k-200k)
Total itemized deductions: $30,920 (reported on 2.5% of returns)
Here:
$30,920
State:
$40,136
(% of AGI for various income ranges: 94.7% for AGIs $25k-50k, 222.4% for AGIs $75k-100k, 711.3% for AGIs $100k-200k)
Charity contributions: $16,300 (reported on 1.7% of returns)
Here:
$16,300
State:
$19,852
(% of AGI for various income ranges: 11.1% for AGIs below $25k, 88.8% for AGIs $75k-100k, 341.3% for AGIs $100k-200k)
Taxes paid: $3,567 (reported on 2.2% of returns)
38382:
$3,567
State:
$6,038
(% of AGI for various income ranges: 5.8% for AGIs $25k-50k, 30.8% for AGIs $75k-100k, 82.2% for AGIs $100k-200k)
Earned income credit: $2,476 (reported on 21.9% of returns)
Here:
$2,476
State:
$2,391
(% of AGI for various income ranges: 116.8% for AGIs below $25k, 83.3% for AGIs $25k-50k)
Percentage of individuals using paid preparers for their 2020 taxes: 94.8%
Here:
95%
State:
93%
(% for various income ranges: 94.2% for AGIs below $25k, 95.7% for AGIs $25k-50k, 94.8% for AGIs $50k-75k, 97.2% for AGIs $75k-100k, 93.9% for AGIs $100k-200k, 85.7% for AGIs over 200k)
Averages for the 2012 tax year for zip code 38382, filed in 2013:
Average Adjusted Gross Income (AGI) in 2012: $38,927 (Individual Income Tax Returns)
Here:
$38,927
State:
$53,767
Salary/wage: $32,237 (reported on 83.7% of returns)
Here:
$32,237
State:
$45,421
(% of AGI for various income ranges: 78.0% for AGIs below $25k, 79.5% for AGIs $25k-50k, 74.4% for AGIs $50k-75k, 72.1% for AGIs $75k-100k, 66.5% for AGIs $100k-200k, 15.6% for AGIs over 200k)
Taxable interest for individuals: $1,387 (reported on 26.3% of returns)
This zip code:
$1,387
Tennessee:
$1,732
(% of AGI for various income ranges: 1.3% for AGIs below $25k, 0.8% for AGIs $25k-50k, 0.9% for AGIs $50k-75k, 0.6% for AGIs $75k-100k, 1.0% for AGIs $100k-200k, 1.2% for AGIs over 200k)
Ordinary dividends: $2,559 (reported on 11.7% of returns)
Here:
$2,559
State:
$6,739
(% of AGI for various income ranges: 0.5% for AGIs below $25k, 0.5% for AGIs $25k-50k, 0.9% for AGIs $50k-75k, 0.9% for AGIs $75k-100k, 1.1% for AGIs $100k-200k, 0.8% for AGIs over 200k)
Net capital gain/loss in AGI: +$13,439 (reported on 9.2% of returns)
Here:
+$13,439
State:
+$19,082
(% of AGI for various income ranges: 0.4% for AGIs below $25k, 0.4% for AGIs $25k-50k, 0.6% for AGIs $50k-75k, 1.0% for AGIs $75k-100k, 2.9% for AGIs $100k-200k, 25.5% for AGIs over 200k)
Profit/loss from business: +$12,368 (reported on 14.3% of returns)
Here:
+$12,368
State:
+$15,240
(% of AGI for various income ranges: 5.1% for AGIs below $25k, 2.1% for AGIs $25k-50k, 1.4% for AGIs $50k-75k, 1.9% for AGIs $75k-100k, 16.3% for AGIs $100k-200k)
Taxable individual retirement arrangement distribution: $9,256 (reported on 9.9% of returns)
38382:
$9,256
Tennessee:
$15,505
(% of AGI for various income ranges: 2.5% for AGIs below $25k, 2.0% for AGIs $25k-50k, 2.1% for AGIs $50k-75k, 3.0% for AGIs $75k-100k, 3.9% for AGIs $100k-200k)
Total itemized deductions: $18,929 (22% of AGI, reported on 13.3% of returns)
Here:
$18,929
State:
$21,976
Here:
22.5% of AGI
State:
17.8% of AGI
(% of AGI for various income ranges: 3.9% for AGIs below $25k, 5.6% for AGIs $25k-50k, 6.5% for AGIs $50k-75k, 8.4% for AGIs $75k-100k, 8.0% for AGIs $100k-200k, 6.9% for AGIs over 200k)
Charity contributions: $5,836 (reported on 11.2% of returns)
Here:
$5,836
State:
$6,709
(% of AGI for various income ranges: 0.6% for AGIs below $25k, 0.9% for AGIs $25k-50k, 1.4% for AGIs $50k-75k, 2.2% for AGIs $75k-100k, 2.8% for AGIs $100k-200k, 3.2% for AGIs over 200k)
Taxes paid: $3,465 (reported on 13.3% of returns)
38382:
$3,465
State:
$4,829
(% of AGI for various income ranges: 0.5% for AGIs below $25k, 1.0% for AGIs $25k-50k, 1.1% for AGIs $50k-75k, 1.4% for AGIs $75k-100k, 1.7% for AGIs $100k-200k, 1.8% for AGIs over 200k)
Earned income credit: $2,414 (reported on 28.1% of returns)
Here:
$2,414
State:
$2,404
(% of AGI for various income ranges: 9.2% for AGIs below $25k, 1.4% for AGIs $25k-50k)
Percentage of individuals using paid preparers for their 2012 taxes: 65.3%
Here:
65%
State:
52%
(% for various income ranges: 60.1% for AGIs below $25k, 65.7% for AGIs $25k-50k, 69.8% for AGIs $50k-75k, 76.0% for AGIs $75k-100k, 80.0% for AGIs $100k-200k, 100.0% for AGIs over 200k)
Averages for the 2004 tax year for zip code 38382, filed in 2005:
Average Adjusted Gross Income (AGI) in 2004: $31,952 (Individual Income Tax Returns)
Here:
$31,952
State:
$44,088
Salary/wage: $28,837 (reported on 84.9% of returns)
Here:
$28,837
State:
$38,825
(% of AGI for various income ranges: 137.9% for AGIs below $10k, 80.6% for AGIs $10k-25k, 83.0% for AGIs $25k-50k, 80.3% for AGIs $50k-75k, 80.3% for AGIs $75k-100k, 42.7% for AGIs over 100k)
Taxable interest for individuals: $1,672 (reported on 34.1% of returns)
This zip code:
$1,672
Tennessee:
$1,802
(% of AGI for various income ranges: 8.1% for AGIs below $10k, 2.2% for AGIs $10k-25k, 1.5% for AGIs $25k-50k, 1.5% for AGIs $50k-75k, 0.9% for AGIs $75k-100k, 2.1% for AGIs over 100k)
Taxable dividends: $1,803 (reported on 14.0% of returns)
Here:
$1,803
State:
$3,727
(% of AGI for various income ranges: 3.3% for AGIs below $10k, 0.6% for AGIs $10k-25k, 0.7% for AGIs $25k-50k, 0.7% for AGIs $50k-75k, 0.8% for AGIs $75k-100k, 1.1% for AGIs over 100k)
Net capital gain/loss: +$6,647 (reported on 11.3% of returns)
Here:
+$6,647
State:
+$15,776
(% of AGI for various income ranges: -2.2% for AGIs below $10k, 0.4% for AGIs $10k-25k, 0.4% for AGIs $25k-50k, 0.3% for AGIs $50k-75k, 1.8% for AGIs $75k-100k, 12.7% for AGIs over 100k)
Profit/loss from business: +$10,296 (reported on 15.2% of returns)
Here:
+$10,296
State:
+$12,882
(% of AGI for various income ranges: 6.7% for AGIs below $10k, 2.7% for AGIs $10k-25k, 2.0% for AGIs $25k-50k, 2.2% for AGIs $50k-75k, 4.1% for AGIs $75k-100k, 17.7% for AGIs over 100k)
Profit/loss from farming: +$3,185 (reported on 5.4% of returns)
Here:
+$3,185
State:
-$6,038
(% of AGI for various income ranges: -2.2% for AGIs below $10k, -0.0% for AGIs $10k-25k, -0.5% for AGIs $25k-50k, -0.4% for AGIs $50k-75k, 1.0% for AGIs $75k-100k, 4.6% for AGIs over 100k)
IRA payment deduction: $3,406 (reported on 1.7% of returns)
38382:
$3,406
Tennessee:
$2,934
(% of AGI for various income ranges: 0.2% for AGIs $10k-25k, 0.2% for AGIs $25k-50k, 0.2% for AGIs $50k-75k, 0.3% for AGIs over 100k)
Self-employed pension: $16,182 (reported on 0.3% of returns)
Here:
$16,182
Tennessee:
$16,857
Total itemized deductions: $16,025 (25% of AGI, reported on 11.7% of returns)
Here:
$16,025
State:
$18,035
Here:
24.7% of AGI
State:
19.9% of AGI
(% of AGI for various income ranges: 4.9% for AGIs below $10k, 4.2% for AGIs $10k-25k, 4.9% for AGIs $25k-50k, 6.2% for AGIs $50k-75k, 7.4% for AGIs $75k-100k, 8.0% for AGIs over 100k)
Charity contributions deductions: $4,516 (7% of AGI, reported on 9.7% of returns)
Here:
$4,516
State:
$5,167
Here:
6.5% of AGI
State:
5.3% of AGI
(% of AGI for various income ranges: 0.6% for AGIs $10k-25k, 0.8% for AGIs $25k-50k, 1.3% for AGIs $50k-75k, 1.7% for AGIs $75k-100k, 3.3% for AGIs over 100k)
Total tax: $4,273 (reported on 67.9% of returns)
38382:
$4,273
State:
$7,482
(% of AGI for various income ranges: 4.2% for AGIs below $10k, 3.3% for AGIs $10k-25k, 6.7% for AGIs $25k-50k, 8.8% for AGIs $50k-75k, 11.4% for AGIs $75k-100k, 19.2% for AGIs over 100k)
Earned income credit: $1,868 (reported on 24.7% of returns)
Here:
$1,868
State:
$1,826
Percentage of individuals using paid preparers for their 2004 taxes: 71.9%
Here:
72%
State:
60%
(% for various income ranges: 67.9% for AGIs below $10k, 73.5% for AGIs $10k-25k, 71.9% for AGIs $25k-50k, 71.9% for AGIs $50k-75k, 72.8% for AGIs $75k-100k, 83.8% for AGIs over 100k)
Likely homosexual households (counted as self-reported same-sex unmarried-partner households)
Lesbian couples: 0.0% of all households
Gay men: 1.0% of all households
Household received Food Stamps/SNAP in the past 12 months: 669 Household did not receive Food Stamps/SNAP in the past 12 months: 3,010
Women who had a birth in the past 12 months: 179 (159 now married, 21 unmarried) Women who did not have a birth in the past 12 months: 1,486 (669 now married, 816 unmarried)
Housing units in zip code 38382 with a mortgage: 713 (57 second mortgage, 51 both second mortgage and home equity loan) Houses without a mortgage: 19
Median monthly owner costs for units with a mortgage: $1,119 Median monthly owner costs for units without a mortgage: $393
Residents with income below the poverty level in 2022:
This zip code:
18.2%
Whole state:
13.3%
Residents with income below 50% of the poverty level in 2022:
This zip code:
4.8%
Whole state:
7.1%
Median number of rooms in houses and condos:
Here:
6.1
State:
6.5
Median number of rooms in apartments:
Here:
4.4
State:
4.4
Notable locations in this zip code not listed on our city pages
Notable locations in zip code 38382: Trenton Industrial Park (A), Central (B), Gibson County Courthouse (C), Gibson County Fire Department Station 1 Springhill (D), Gibson County Fire Department Station 3 Brazil (E), Trenton Fire Department (F), Fruitland Volunteer Fire Department (G), Trenton City Hall (H), Gibson County EMS (I). Display/hide their locations on the map
Churches in zip code 38382 include: Follis Chapel (A), Doris Chapel (B), Bethel Baptist Church (C), Salem Church (D), Bethany Church (E), Davidson Chapel (F), Poplar Grove Church (G), Johnson Chapel (H), Union Church (I). Display/hide their locations on the map
Cemeteries: Johnson Chapel Cemetery (1), Walnut Grove Cemetery (2), Keeley Cemetery (3), Wilson Cemetery (4), Whitehall Cemetery (5), Mount Sinai Cemetery (6), Harpers Chapel Cemetery (7). Display/hide their locations on the map
Streams, rivers, and creeks: Bethel Branch (A), Doakville Creek (B), Davis Creek (C), Thompson Levee Creek (D), Camp Creek (E), Bear Creek (F), Parker Branch (G), Reagan Creek (H). Display/hide their locations on the map
543 married couples with children.
585 single-parent households (157 men, 428 women).
98.3% of residents of 38382 zip code speak English at home.
0.9% of residents speak Spanish at home (53% very well, 47% well).
0.6% of residents speak other Indo-European language at home (100% very well).
0.1% of residents speak other language at home (100% very well).
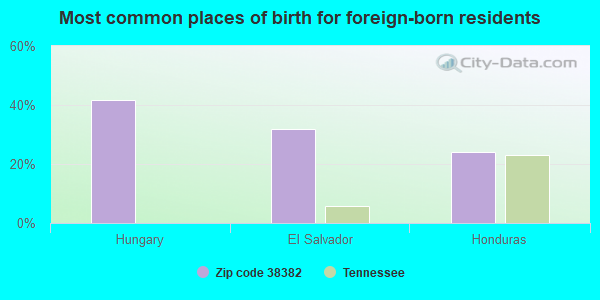
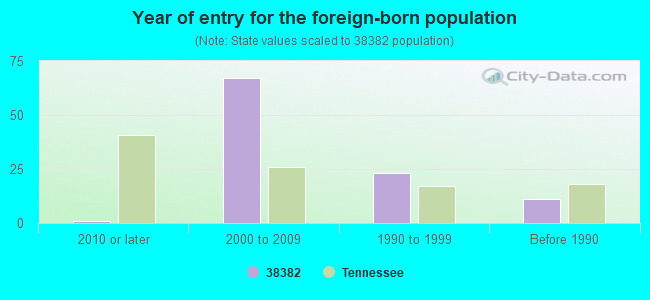
Foreign born population: 91 (1.1%) (59.9% of them are naturalized citizens)
This zip code:
1.1%
Whole state:
5.6%
42%Hungary
32%El Salvador
24%Honduras
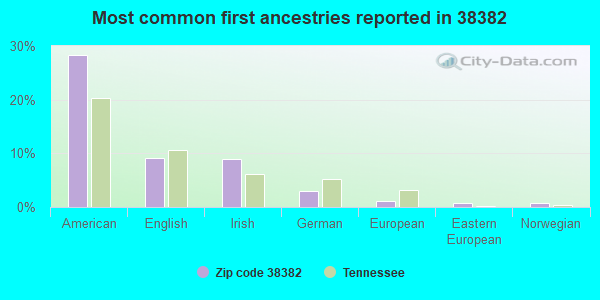
28%American
9%English
9%Irish
3%German
1%European
1%Eastern European
1%Norwegian
Year of entry for the foreign-born population
12010 or later
672000 to 2009
231990 to 1999
11Before 1990
Facilities with environmental interests located in this zip code:
CITY OF TRENTON WWTP (498 N. COLLEGE ST in TRENTON, TN)
National Pollutant Discharge Elimination System NON-MAJOR (Tracking pollutant discharge elimination systems) - permit Business SIC classification: SEWERAGE SYSTEMS Organizations: CITY OF TRENTON-LAGOON (CONTACT/OWNER)
Alternative names: TRENTON LAGOON
BARBERS WASTE OIL SER. (PO BOX 131 in TRENTON, TN)
(Resource Conservation and Recovery Act (tracking hazardous waste))
C & H SANITATION SERVICE, INC. (BOX 24 in TRENTON, TN)
(Resource Conservation and Recovery Act (tracking hazardous waste))
AMERICAN PHOENIX, INC. (800 INDUSTRY PARK DRIVE in TRENTON, TN)
AIR SYNTHETIC MINOR (AIRS/AFS)
Housing units lacking complete plumbing facilities: 2.2% Housing units lacking complete kitchen facilities: 7.4%
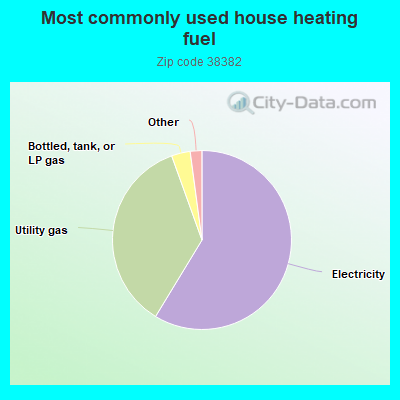
58.7%Electricity
35.8%Utility gas
3.4%Bottled, tank, or LP gas
0.7%No fuel used
0.7%Wood
0.7%Fuel oil, kerosene, etc.
Population in 1990: 9,011. Population change in the 1990s: +855 (+9.5%).
Place of birth for U.S.-born residents:
This state: 6,507
Northeast: 73
Midwest: 712
South: 700
West: 139
60% of the 38382 zip code residents lived in the same house 5 years ago. Out of people who lived in different houses, 70% lived in this county. Out of people who lived in different counties, 50% lived in Tennessee.
87% of the 38382 zip code residents lived in the same house 1 year ago. Out of people who lived in different houses, 48% moved from this county. Out of people who lived in different houses, 38% moved from different county within same state. Out of people who lived in different houses, 12% moved from different state.
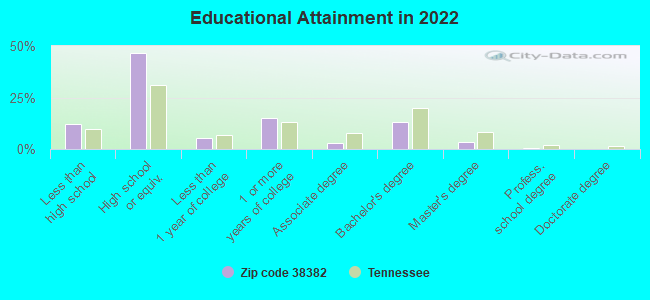
Private vs. public school enrollment:
Students in private schools in grades 1 to 8 (elementary and middle school): 12
Here:
1.7%
Tennessee:
15.0%
Students in private schools in grades 9 to 12 (high school): 6
Here:
3.1%
Tennessee:
16.2%
Students in private undergraduate colleges: 18
Here:
9.1%
Tennessee:
23.5%
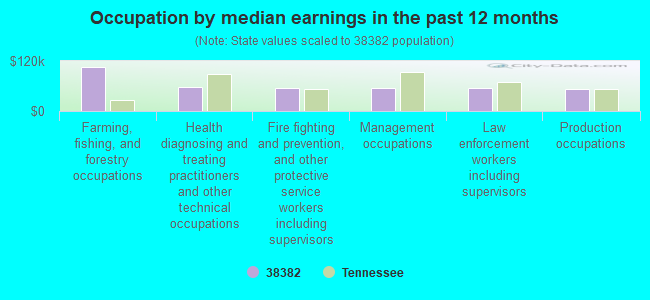
Occupation by median earnings in the past 12 months ($)
106,786Farming, fishing, and forestry occupations
58,150Health diagnosing and treating practitioners and other technical occupations
55,979Fire fighting and prevention, and other protective service workers including supervisors
55,398Management occupations
55,270Law enforcement workers including supervisors
52,459Production occupations
Companies with federal contracts located in this zip code:
ACE BUILDING CENTER (2039 HWY 45W in TRENTON, TN; small business)
$15,629 with Army for Lumber and Related Basic Wood Materials. Signed on 2004-04-19. Completion date: 2004-07-30.
Top industries in this zip code by the number of employees in 2005:
Health Care and Social Assistance: Residential Mental Retardation Facilities (100-249 employees: 1 establishment, 20-49 employees: 1 establishment, 10-19 employees: 1 establishment, 5-9 employees: 1 establishment)
Health Care and Social Assistance: General Medical and Surgical Hospitals (50-99: 1)
Health Care and Social Assistance: Nursing Care Facilities (50-99: 1)
Wholesale Trade: Other Electronic Parts and Equipment Merchant Wholesalers (50-99: 1)
Other Services (except Public Administration): Religious Organizations (10-19: 2, 5-9: 1, 1-4: 14)
People in group quarters in 2010:
151 people in local jails and other municipal confinement facilities
69 people in residential treatment centers for adults
51 people in nursing facilities/skilled-nursing facilities
22 people in group homes intended for adults
People in group quarters in 2000:
162 people in nursing homes
112 people in local jails and other confinement facilities (including police lockups)
14 people in homes for the mentally retarded
Fatal accident statistics in 2014:
Fatal accident count: 2
Vehicles involved in fatal accidents: 3
Fatal accidents caused by drunken drivers: 2
Fatalities: 2
Persons involved in fatal accidents: 3
Pedestrians involved in fatal accidents: 0
Fatal accident statistics in 2013:
Fatal accident count: 2
Vehicles involved in fatal accidents: 3
Fatal accidents caused by drunken drivers: 1
Fatalities: 2
Persons involved in fatal accidents: 4
Pedestrians involved in fatal accidents: 1
2003 - 2018 National Fire Incident Reporting System (NFIRS) incidents
Based on the data from the years 2003 - 2018 the average number of fire incidents per year is 84. The highest number of reported fire incidents - 136 took place in 2005, and the least - 31 in 2003. The data has a growing trend.
When looking into fire subcategories, the most reports belonged to: Outside Fires (45.0%), and Structure Fires (39.4%).
Fire incident types reported to NFIRS in Zip Code 38382


+$3,185
-$6,038
(% of AGI for various income ranges: -2.2% for AGIs below $10k, -0.0% for AGIs $10k-25k, -0.5% for AGIs $25k-50k, -0.4% for AGIs $50k-75k, 1.0% for AGIs $75k-100k, 4.6% for AGIs over 100k) Nearest zip codes: 38330, 38343, 38369, 38337, 38316, 38021.


 Based on the data from the years 2003 - 2018 the average number of fire incidents per year is 84. The highest number of reported fire incidents - 136 took place in 2005, and the least - 31 in 2003. The data has a growing trend.
 When looking into fire subcategories, the most reports belonged to: Outside Fires (45.0%), and Structure Fires (39.4%).